In the world of financial markets, making informed decisions is crucial for success. Technical analysis plays a vital role in helping traders and investors assess market trends and make predictions based on historical price data.
In this article, we will delve into the realm of technical analysis, exploring various indicators and strategies used by professionals to navigate the complex landscape of financial trading.
What is Technical Analysis?
Technical analysis is a method used to evaluate and predict price movements in markets. It involves studying past market data, primarily historical price, and volume, to identify patterns, trends, and potential future price movements.
The Importance of Technical Analysis
Technical analysis provides traders with valuable insights into the market’s behavior.
By understanding market trends, support and resistance levels, and momentum, traders can make well-informed decisions, mitigate risks, and maximize potential profits.
Key Indicators in Technical Analysis
In technical analysis, key indicators are tools used by traders and investors to analyze market data and gain insights into potential price movements.
These indicators are based on mathematical calculations that help traders identify trends, momentum, and potential entry or exit points in the market.
Let’s take a closer look at some of the essential key indicators used in technical analysis:
- Moving Averages (MA): Moving averages are fundamental and widely used indicators in technical analysis. They help smooth out price data and reduce noise by calculating the average price over a specific period. The most common types of moving averages are the Simple Moving Average (SMA) and the Exponential Moving Average (EMA). Traders use moving averages to identify the direction of the trend and potential support and resistance levels.
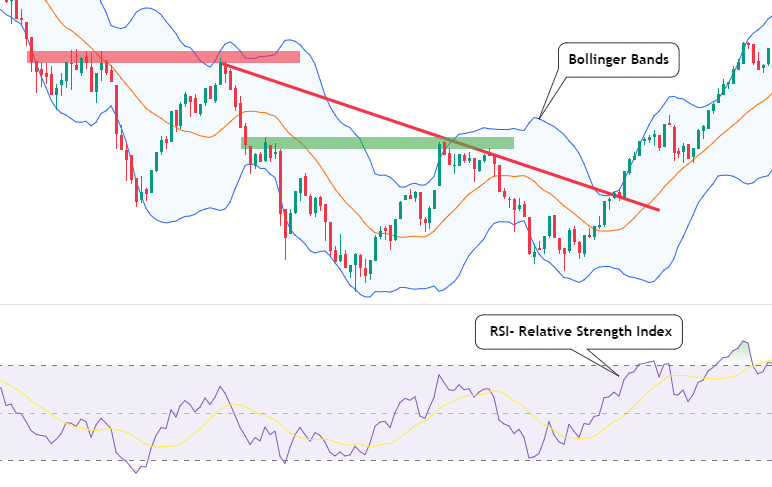
- Relative Strength Index (RSI): The RSI is a momentum oscillator that measures the speed and change of price movements. It oscillates between 0 and 100 and is used to determine whether an asset is overbought or oversold. An RSI value above 70 indicates an overbought condition, while a value below 30 suggests an oversold condition.
- Bollinger Bands: Bollinger Bands consist of a middle line, which is typically a simple moving average, and two standard deviation lines above and below it. These bands provide insights into market volatility. When the market becomes more volatile, the bands widen, and when it becomes less volatile, the bands contract. Traders use Bollinger Bands to identify potential price breakouts and reversals.
- Moving Average Convergence Divergence (MACD): The MACD is a trend-following momentum indicator. It consists of two moving averages – the MACD line (the difference between the short-term and long-term moving averages) and the signal line (a smoothed moving average of the MACD line). Traders use the MACD to identify trend changes and potential entry or exit points.
These indicators are just a few examples of the many technical analysis tools available to traders. Each indicator serves a specific purpose and can be used in combination with others to gain a comprehensive view of the market’s behavior.
Traders need to understand how these indicators work and interpret their signals effectively to make informed trading decisions.
Popular Technical Analysis Strategies
- Support and Resistance Trading: Support and resistance levels are key price levels on a chart where an asset’s price tends to find barriers to further movement. Traders use these levels to identify potential entry and exit points.
When the price approaches a support level, it is expected to bounce back up. Conversely, when the price reaches a resistance level, it is likely to reverse and move downward. Traders place buy orders near support levels and sell orders near resistance levels. Identify price patterns using S/R levels and trendlines.
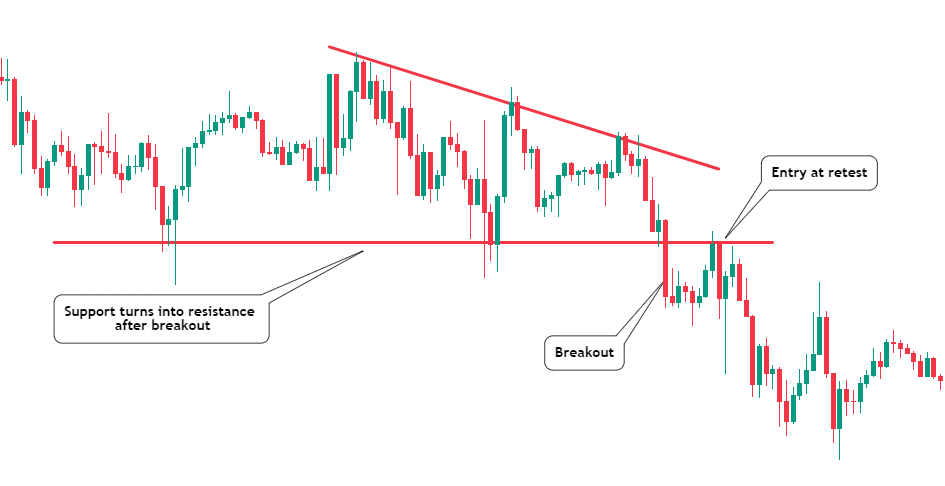
- Breakout Trading: Breakout trading involves identifying key price levels where an asset’s price is likely to break through and continue in a specific direction. Traders monitor consolidation patterns, such as triangles or rectangles, and wait for the price to break above resistance or below support.
Once the breakout occurs, traders enter positions in the direction of the breakout, expecting a significant price movement. Keep an eye on the closing price of candles at the time of breakout.
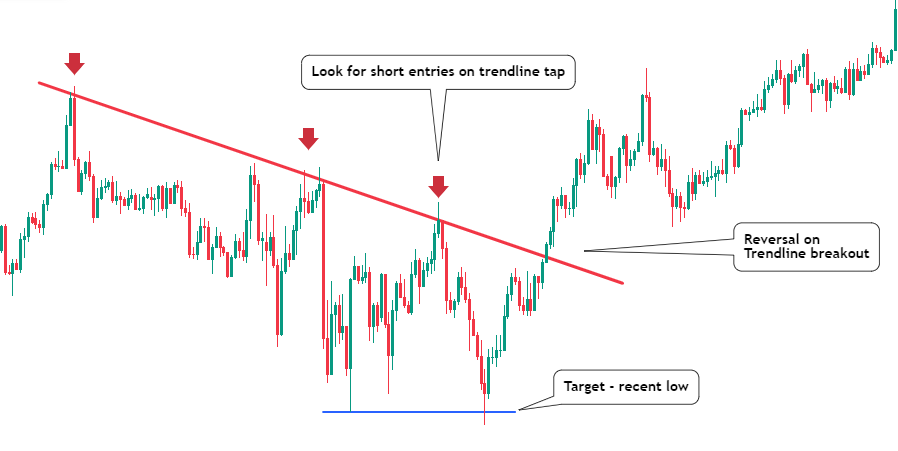
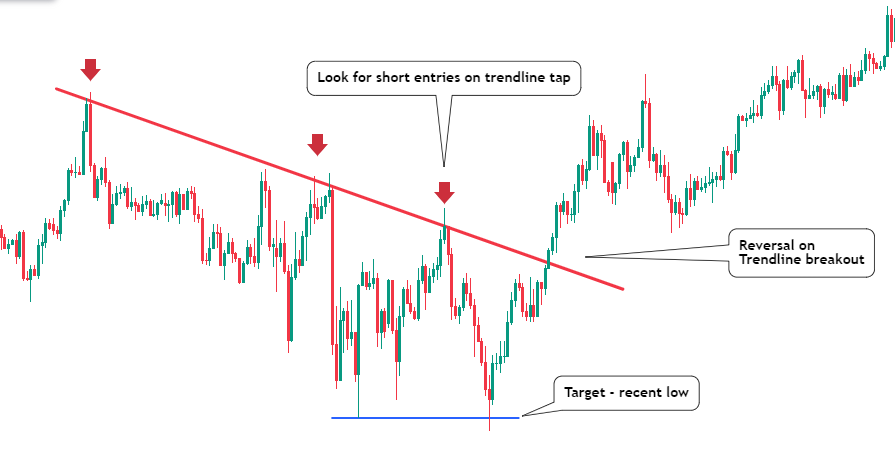
- Trend analysis: Trend following strategies focus on identifying and trading with the prevailing market trend. Traders use various indicators, such as moving averages, to confirm the direction of the trend. In an uptrend, traders look for opportunities to buy, while in a downtrend, they seek opportunities to sell. Trend following strategies aim to ride the trend until signs of a reversal appear.
- Reversal Trading: Reversal trading strategies are employed to identify potential trend reversals. Traders look for specific chart patterns, such as double tops and double bottoms, as well as oversold or overbought conditions indicated by indicators like the Relative Strength Index (RSI). Reversal traders aim to enter the market early during a trend reversal and capture the new trend in its early stages.
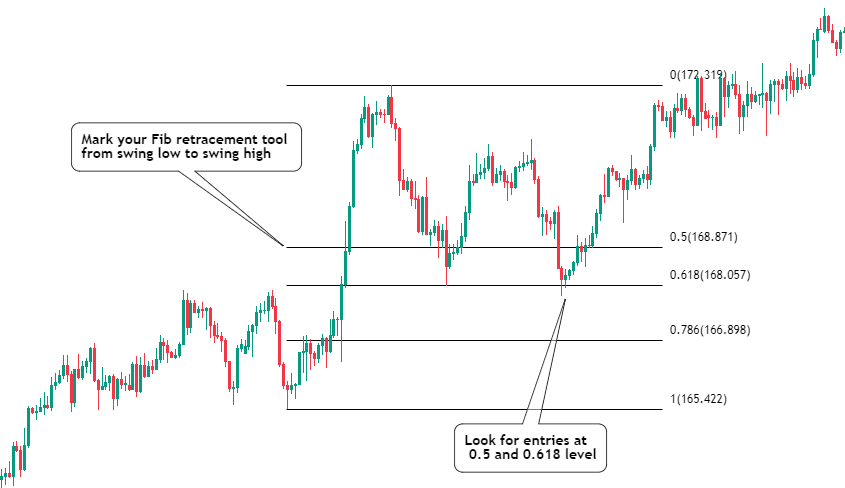
- Fibonacci Retracement: Fibonacci retracement is a technical analysis tool based on the Fibonacci sequence. Traders use these retracement levels to identify potential support and resistance levels after a significant price movement in a particular trading range. The most commonly used Fibonacci retracement levels are 50%, and 61.8%.
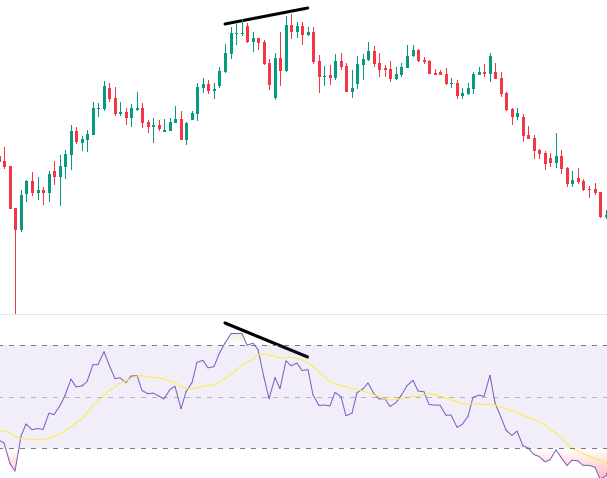
- Divergence Trading: Divergence trading involves comparing price movements with the movements of an oscillator, such as the MACD or RSI. Divergence occurs when the price makes a higher high or lower low, but the oscillator fails to confirm the same pattern. This can be a sign of a potential trend reversal.
Traders need to choose a strategy that aligns with their trading style, risk tolerance, and level of experience. Additionally, combining multiple strategies or using them in conjunction with other technical analysis tools can provide a more comprehensive approach to decision-making in the markets.
How to Develop Trading Strategies and Plan
Developing effective trading strategies and a well-thought-out trading plan is essential for success in the markets. A systematic approach to trading helps technical traders stay disciplined, manage risks, and make informed decisions.
Here’s a step-by-step guide on how to develop trading strategies and create a comprehensive trading plan:
Choose a Trading Style
There are various trading strategies, such as day trading, swing trading, and position trading. Each style requires different time frames and approaches. Consider your available time, risk tolerance, and personality to choose a trading style that suits you best. Make sure you make trading rules.
Conduct Market Analysis
Before developing a strategy, conduct a thorough market analysis. Study the financial instruments you wish to trade such as stocks, forex pairs, or cryptocurrencies. Analyze historical price data, identify trends, and market sentiment, and look for price patterns that can inform your trading decisions.
Select Technical Indicators and Tools
Based on your market analysis, select appropriate technical indicators and tools. These could include moving averages, Bollinger Bands, RSI, MACD, and others. Avoid overloading your strategy with too many indicators, as this can lead to conflicting trading signals and confusion.
Test and Refine Your Strategy
Backtest your trading strategy using historical data and past price movements to assess its performance in different market conditions and analyze future trends. This step is crucial to identify potential flaws and make necessary adjustments. Continuously refine your trading strategy to adapt to changing market dynamics.
Define Entry and Exit Rules
Establish clear entry and exit rules based on your strategy. Determine the conditions that must be met to enter a trade and the criteria for exiting with a profit or cutting losses. Having well-defined rules helps you maintain discipline and avoid emotional decision-making.
Monitor and Evaluate
Once you start trading, consistently monitor your performance, price action, and evaluate the effectiveness of your strategy. Keep a trading journal to record your trades, emotions, and observations. Regularly assess your results to identify areas for improvement.
Stay Disciplined and Stick to Your Plan
Discipline is crucial in trading. Stick to your trading plan and avoid impulsive decisions based on emotions or external influences. Trust in your strategy and trading plan, and don’t deviate from them unless you have sound reasons to do so.
Continuously Educate Yourself
The financial markets are dynamic, and continuous learning is essential for staying relevant and adapting to changes. Stay updated with market news, economic events, and new trading techniques to enhance your trading skills on a price chart.
The Psychology Behind Technical Analysis
The market psychology behind technical analysis is an integral aspect of understanding market behavior and making informed trading decisions. It involves studying how human emotions, behaviors, and cognitive biases influence the price charts of financial assets.
The technical analysis goes beyond mere chart patterns and indicators; it delves into the minds of market participants, recognizing that their emotions and perceptions drive market trends and reversals.
Market Participants and Their Emotions
Financial markets are driven by the actions of various participants, including retail traders, institutional investors, hedge funds, and market makers. Each group has its motivations, risk appetites, and emotions that collectively contribute to price fluctuations.
- Greed and Fear: Two dominant emotions that influence market participants are greed and fear. When investors are driven by greed, they tend to buy assets aggressively, leading to uptrends. Conversely, fear drives selling pressure, causing downtrends. Understanding the interplay between these emotions is crucial in predicting market movements.
- Herd Mentality: Humans are social beings, and this is reflected in the financial markets. The herd mentality refers to the tendency of individuals to follow the crowd. When a significant number of market participants start buying or selling an asset, others may follow suit, amplifying the price movement.
- Confirmation Bias: Traders often seek information that confirms their pre-existing beliefs or biases. This confirmation bias can influence their interpretation of technical indicators and chart patterns, leading to self-fulfilling prophecies as more traders act on similar signals.
Technical analysis vs fundamental analysis
Technical Analysis:
- Focuses on historical price data and chart patterns.
- Identifies short-term trading opportunities.
- Relies on indicators like RSI, moving averages, etc.
Fundamental Analysis:
- Evaluates intrinsic value based on economic data.
- Used by long-term investors.
- Considers financial statements, industry trends, etc.
Fundamental and technical analysis both have strengths and weaknesses. Traders may use a combination for better insights. Choose based on trading style and goals.
Position sizing and risk management
Position Sizing and Risk Management:
Position sizing involves determining the appropriate trade size based on account balance and risk tolerance.
Risk management strategies include using stop-loss orders, diversification, and managing leverage to protect capital and limit potential losses. These practices are crucial for successful and sustainable trading.
Conclusion
Technical analysis is a powerful tool for traders and investors looking to navigate the complexities of financial markets. By utilizing various indicators and strategies while considering the psychology of market participants, traders can make well-informed decisions that increase their chances of success.
FAQs
-
Can technical analysis predict the future price of an asset accurately?
- While technical analysis can provide insights into potential price movements, it cannot guarantee precise predictions due to market uncertainties.
-
Are there any risks associated with technical analysis?
- Like any trading strategy, technical analysis comes with risks. Traders should use risk management techniques to protect their capital.
-
Can I solely rely on technical analysis for trading decisions?
- Many traders combine technical analysis with fundamental analysis to make well-rounded trading decisions.