
Staying ahead of market trends is a prerequisite for success in the quick-paced trading world. This is where the role of trend-following strategies and indicators comes into play. With the help of these potent tools, trading professionals can improve their decision-making skills and raise the likelihood of executing lucrative trades.
The goal of trend trading is to make money by analyzing an asset’s momentum in a specific direction; there are many different ways to do this. No one technical indicator can guarantee market success; in addition to analysis, traders must have a solid understanding of trading psychology and risk management. However, specific techniques have proven successful over time and continue to be widely used by trend traders who are interested in analyzing particular market indicators.
In this article, we shall explore some of the top trend-following trading strategies and indicators, which traders may learn and use to improve their trading style.
What is the Trend Following Strategy?
Trend following strategy is a renowned approach employed by traders to recognize and profit from the dominant direction of market trends. It is predicated on the idea that asset values tend to move in a certain direction for a while before turning around.
As such, they acquire assets before asset prices rise and sell them before their prices fall. Trend followers often employ sound risk management techniques before investing. Such traders observe current trends and keep a watch for any emerging ones in the market; they do not attempt to foresee or forecast a trend.
Identifying Trends – Types
Trend trading strategies enable traders to spot trends sufficiently early in a trade. This way, they can exit the market before the reversal of a trend. Uptrends, downtrends, and sideways trends are the three main categories into which trends are commonly divided.
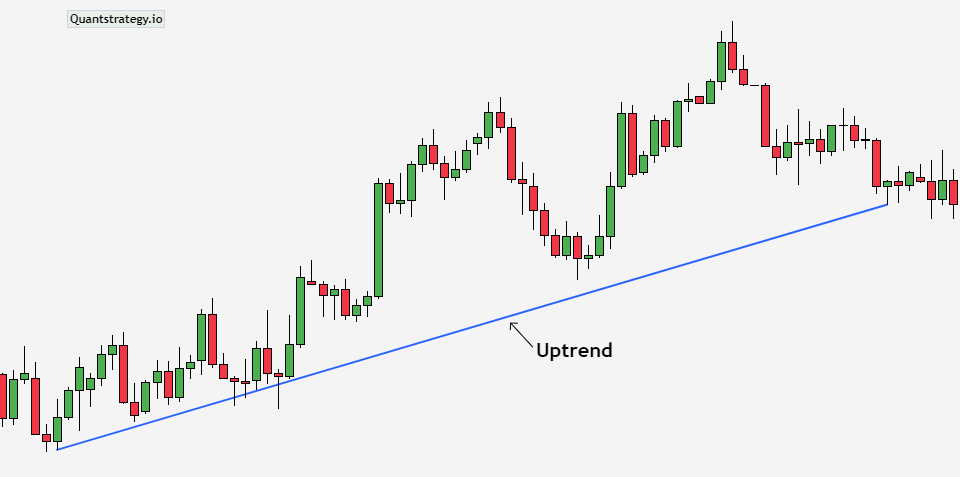
Uptrend
An asset’s price often rises over time when it is in an uptrend, which is indicated by a string of higher highs and lower lows. Traders wanting to use an uptrend strategy tend to enter long positions, expecting further price appreciation. They can decide to purchase stocks or other types of assets in the hope that the uptrend will continue and present lucrative investment opportunities.
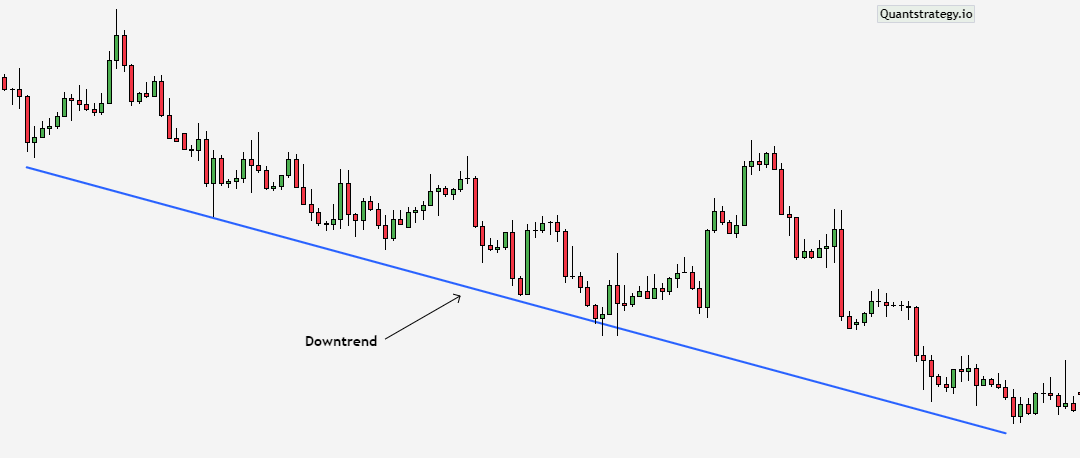
Downtrend
Downtrends occur when an asset’s price starts declining in value and is characterized by a sequence of lower highs and lower lows. In such a case, trend traders enter short positions, anticipating the price will keep its downward trajectory. They can decide to sell the stocks or other types of assets, and if the decline continues and reaches a specific point, they might even decide to exit the trade entirely.
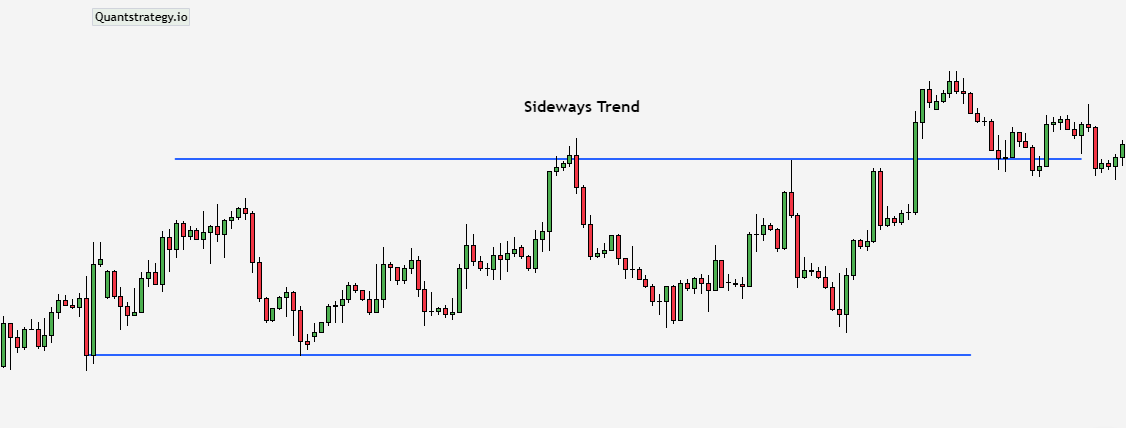
Sideways Trend
When the price of an asset fluctuates within a relatively small range without clearly indicating an upward or downward direction, it is said to be in a sideways trend, which is also referred to as a consolidating or ranging market. Price bounces between support and resistance levels during a sideways trend, forming a trading range. Since there isn’t a strong trend to take advantage of during this phase, traders may find it difficult to implement trend-following strategies. However, scalpers frequently benefit from it to capitalize on extremely brief market fluctuations.
A trend trader aims to capitalize on the momentum and possible profits associated with long-term price movements by aligning his/her trade with the dominant trend. These techniques concentrate on objectively detecting and taking advantage of trends instead of attempting to forecast market reversals or counter-trend moves.
It is crucial to remember that trend-following trading strategies can be used in a variety of financial markets, including stocks, indices, commodities, and currencies. The goal is to recognize the existence of a distinct and well-established trend, which can be accomplished by utilizing several technical indicators and chart patterns.
Trend Trading Strategies & Indicators
Trend trading strategies assist traders in planning out how and when they will trade by spotting emerging trends as soon as possible, confirming them, and then getting out of the market before the trend reverses.
The majority of trading strategies are based on either technical analysis, which includes indicators and price action, or fundamental analysis. Some will combine the two.
Although trend trading is regarded as a strategy itself, it is frequently blended with elements of other approaches based on the sort of trend that is occurring and the type of analysis you want to perform.
The following indicators are considered the top trend-following indicators and strategies:
Breakout Trading
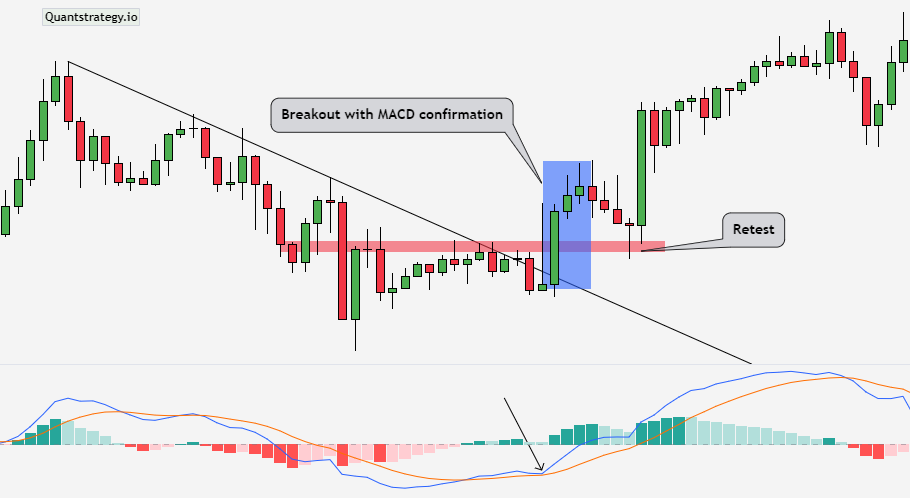
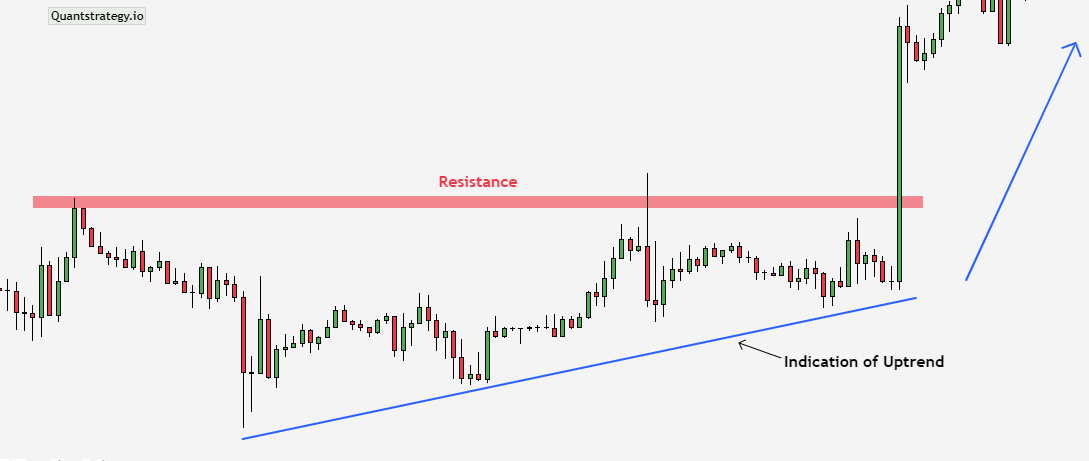
Breakout trading is frequently employed in a strong market trend that is consistently making higher highs or lower lows.
The goal is to locate established support and resistance levels, or points where the market has historically reversed a trend, and to assess the present movement’s momentum. If there is significant momentum as the levels are achieved, the market will likely ‘break out’ of the range and a new trend will emerge.
A possible entry point is indicated when the price breaks below a support level or above a resistance level. Traders can use several strategies, including trailing stops, the completion of a certain price pattern, or target levels based on support/resistance zones, to determine the exit point.
Another example of a breakout strategy is when an uptrend enters a brief consolidation phase before resuming as an uptrend. The same is shown in the example below.
Moving Average
A moving average (MA) indicator is a technical analysis tool that determines the average price of an asset over a specified interval. This results in a smoothing of the price data and the production of a single line that may be used by trend traders to spot trends. The choice will ultimately be individual, however, there are well-liked options like the 50-day and 200-day moving averages.
A moving average is a lagging indicator that moves less quickly than the market price. As a result, it is only useful for reporting past events rather than predicting future patterns. Since the movement of a moving average may confirm whether the market is moving up, down, or sideways, it is particularly helpful for trend traders.
A trader would pay attention to whether the price is above or below the moving average while examining a single moving average. A price above the moving average signals an uptrend, and a price below the moving average signals a downtrend.
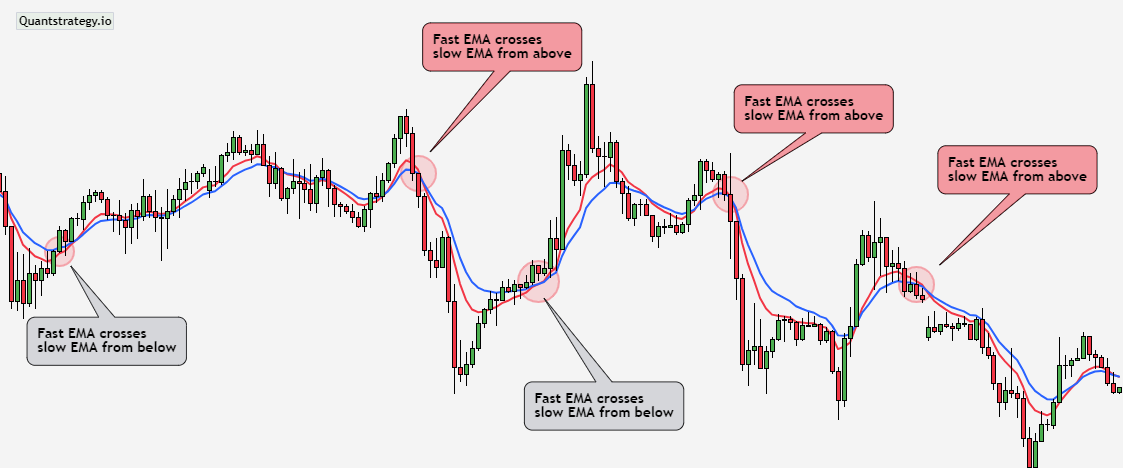
However, a common moving average strategy is to watch for crossovers between two moving averages since this can signal a change in the price trend. Normally, this would be two EMAs (exponential moving averages), one fast and one slow. The slow EMA (red line) is set to 14 days, while the fast EMA (blue line) spans nine days in the example below.
A trend trader would open a long position when the fast EMA passes the slow EMA from below and enter a short position when it crosses from above.
Relative Strength Index (RSI)
The relative strength index is another oscillating trend indicator used to spot overbought or oversold indications and price momentum. To do this, it examines average losses and gains over a specific number of periods, often 14, and ascertains whether more price actions were positive or negative.
It is displayed as a percentage that varies on a scale from 0 to 100. The market is considered “overbought” when the indicator rises above 70 and “oversold” when it falls below 30. Traders view these levels as indicators that a trend may be reaching maturity.
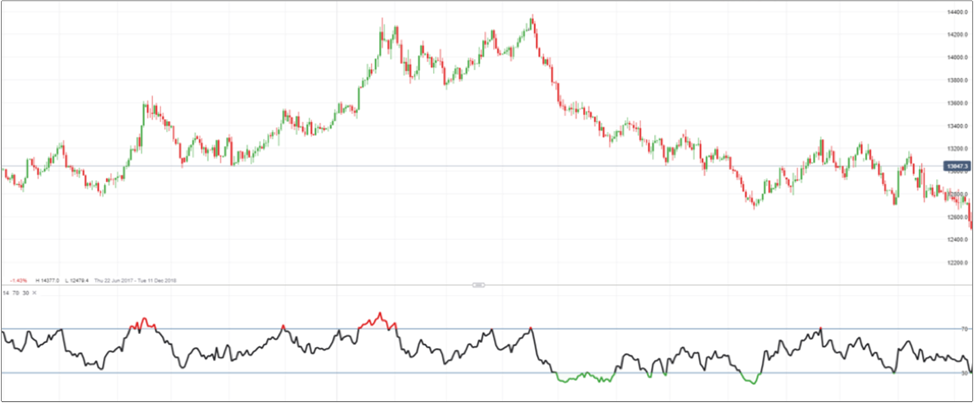
It’s important to remember that the market can linger in an overbought or oversold condition for a long time. Although the RSI only varies between 0 and 100, the market price can range over an even broader set of values, so the RSI isn’t always a warning of an impending change in trend.
However, a trend trader holding a long position will typically utilize the overbought indication as a price point to exit their trade and lock in a profit. While the overbought indication would serve as an entry point for a trader wishing to begin a short position. Trend traders who use the oversold signal would do the opposite: they would use the oversold indication to exit short trades and enter long ones.
Trendline Trading
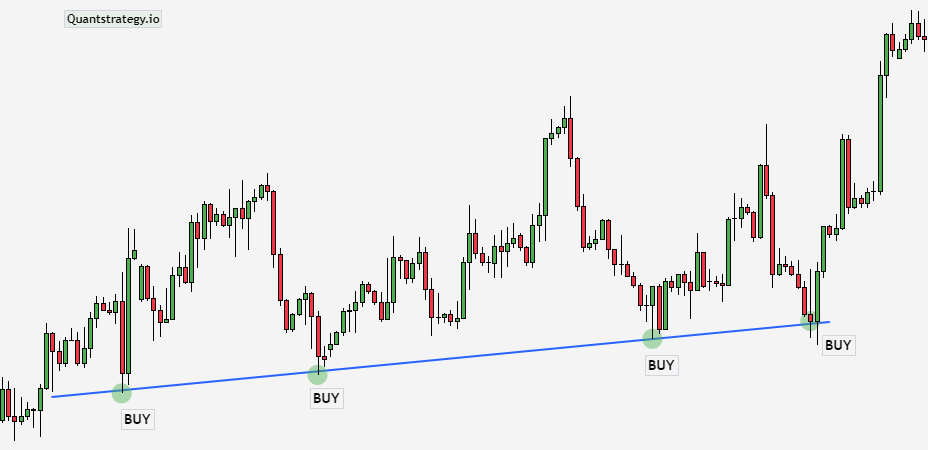
Trendline trading strategy helps trend traders visualize and recognize prevailing trends. It entails outlining trendlines by connecting consecutive lower highs in a downward trend or consecutive higher lows in an upward trend.
A trend reversal or continuance may be indicated by a price break above or below an uptrend line. These trendline breaks can be used by traders to enter a trade, and they can exit a trade when the price exhibits probable reversal indications or hits a predetermined target.
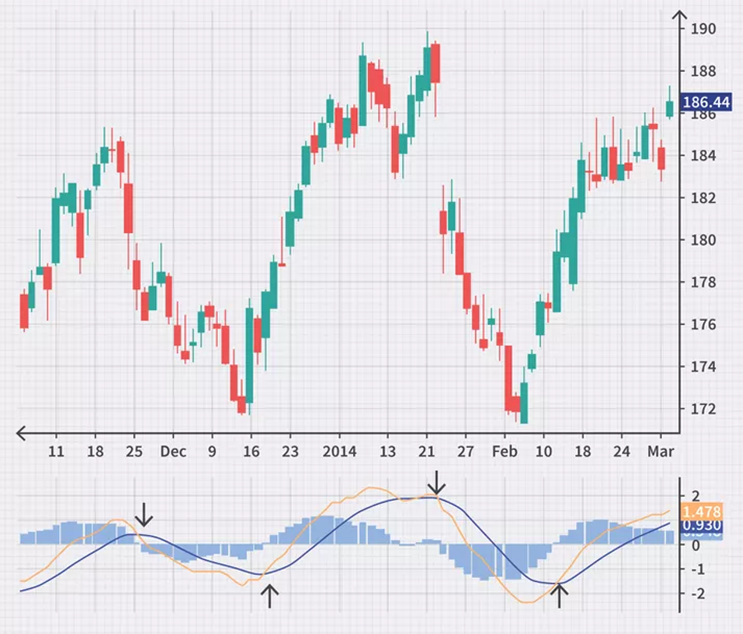
Moving Average Convergence Divergence (MACD)
The Moving Average Convergence Divergence is a type of oscillating indicator. Oscillating indicators are technical analysis indicators that vary up and below a centerline within a band over time (the MACD oscillates above and below zero). It functions as a momentum indicator as well as a trend follower.
A straightforward method to use the MACD is to check which side of zero the MACD lines are in the histogram beneath the chart. The stock is probably heading upward if the MACD line is above zero for an extended length of time. The trend is probably downward if the MACD line is below zero for an extended time. With this approach, prospective buy indications appear when the MACD crosses above zero, and prospective sell signals appear when it does the opposite.
Additionally, signal line crossover may offer buy and sell signals. Both a fast and slow line can be seen on a MACD. The fast line crossing over and above the slow line indicates a buy signal. The fast line crossing through and falling below the slow line is a sell signal.
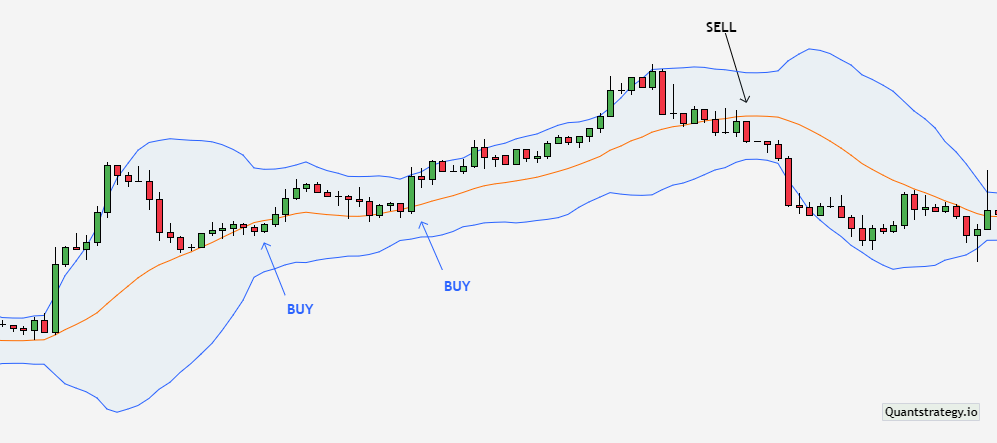
Bollinger Bands
Bollinger Bands is a popular trend indicator formed by three lines – upper, lower, and middle band, which is a moving average. These bands give traders a way to depict price volatility and spot potential trades.
The Contrarian Bollinger Bands method is a contemporary trend-following strategy that uses the Bollinger Bands indicator to spot possible purchasing and selling opportunities. The method calls for opening a long position when the price crosses above the upper Bollinger Band and then finds support on the dynamic support line (intersecting the two bands), indicating a likely continuation of the bullish trend.
In contrast, a short position can be placed when the price crosses below the lower Bollinger Band and encounters resistance from the dynamic resistance line, signaling the continuation of a bearish trend. Exit points for long positions can be established upon the break of dynamic support, and vice versa.
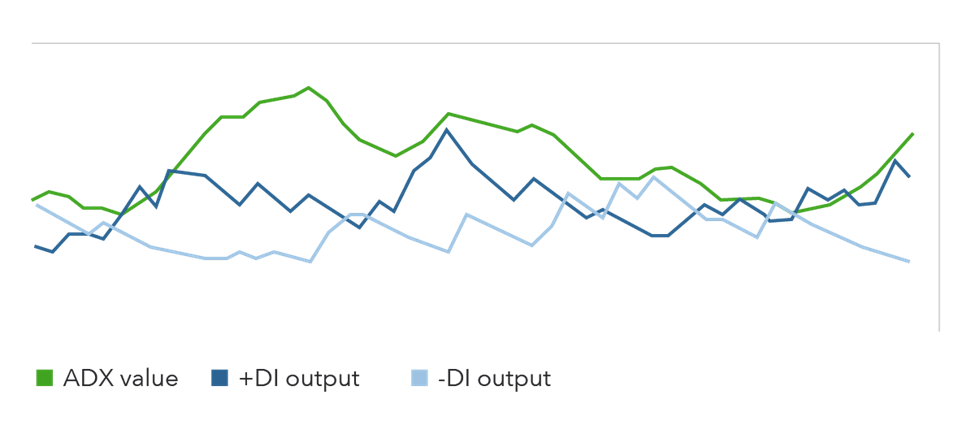
Average Directional Index (ADX)
The average directional index determines the strength of the trend. The ADX line varies from 0 to 100 on a scale. Values below 25 denote a weak trend, whereas values between 25 and 100 denote a strong trend where the strength increases as the numbers rise.
The ADX and the directional movement index (DMI), which consists of two additional lines – the negative directional indicator (-DI) and the positive directional indicator (+DI) are frequently plotted in the same window. The ADX line indicates the trend’s strength, while the other two lines show the trend’s direction.
An indication that an uptrend is about to begin is noticed when the +DI crosses the -DI and the ADX is above 25. Traders may want to consider opening a long position in this case. When the ADX is over 25 and the -DI crosses above the +DI, it is considered an indication that a downtrend is about to begin and a chance to open a short position.
How to Start Trend Trading?
Some of the important steps that are involved in trend trading are:
- Selecting an appropriate market for trading
It’s crucial to have an understanding of what you want to trade before opening a position. While certain trend traders might want to concentrate on a single market, others diversify their prospects by extending their positions across several markets, gaining exposure to multiple trends.
After choosing your trading strategy, you must continue to monitor any developments that can lead to new trends or countertrends. These could include political events, pronouncements about central bank policy, and breaking news.
- Risk management
Trend trading requires careful risk management. Traders can employ effective position sizing and risk management strategies. Stop-loss orders may be employed to reduce possible losses. It should be noted that guaranteed stop losses, although they come with a price, protect against slippage, whereas regular stop losses do not.
Conclusion
Trend-following strategies and indicators can provide trend trading signals, reversal cautions, and a simplified view of price information. Indicators can be applied to all timeframes and, for the most part, have variables that can be changed to accommodate the individual preferences of each trader. Traders can mix indicator strategies or create their own rules to clearly define entry and exit criteria for trades.
It can be challenging to learn how to trade using indicators. You may choose to learn more about a certain indicator if it interests you. Above all, it’s a good idea to practice testing it before using it to execute live trades. A brokerage account must be opened to get access to the stock market, which is crucial information for individuals who have never done this earlier.