In the financial markets, reversals refer to a change in the direction of a price trend. They occur when the prevailing trend exhausts itself, and the price starts moving in the opposite direction. Most traders trade reversals in the market. This works in any timeframe whether it’s intraday trading or swing trading.
Reversals can provide valuable opportunities for traders to enter or exit positions at favorable price levels, maximizing profits and managing risks.
Identifying Reversals: Key Indicators
Identifying reversals accurately is crucial for successful trading. Traders rely on a combination of key indicators and patterns to recognize potential reversals.
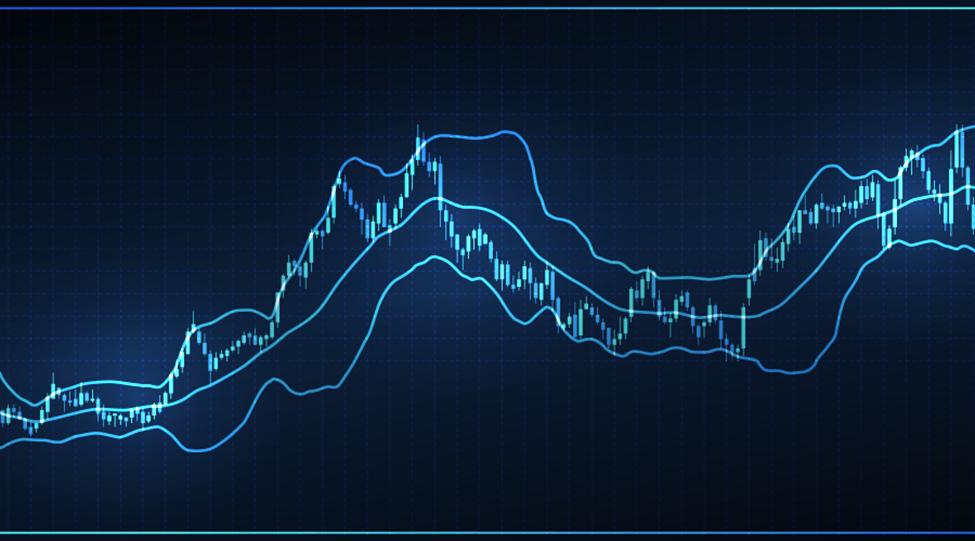
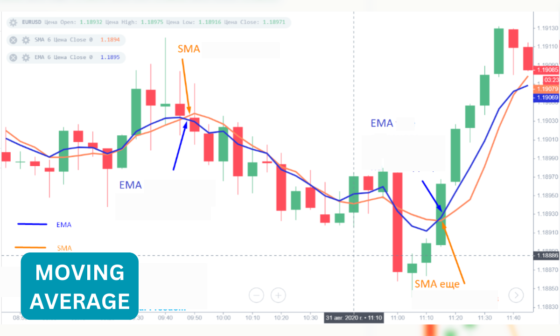
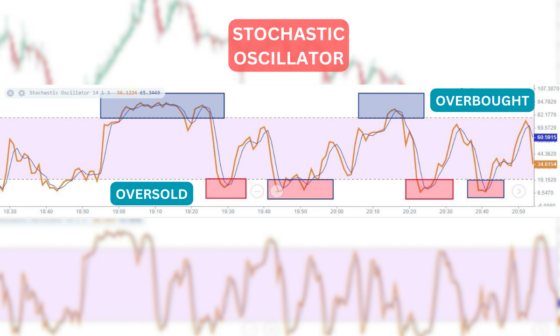
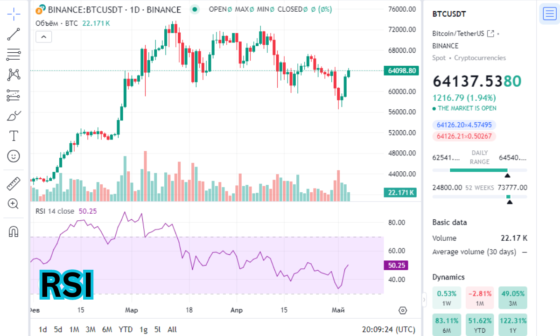
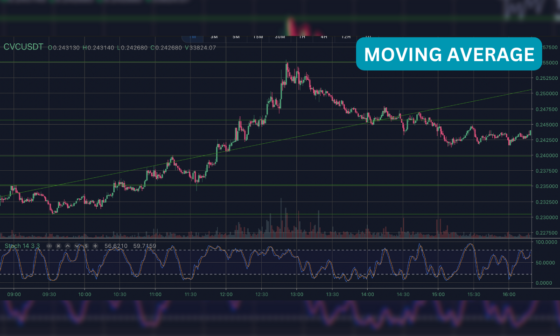
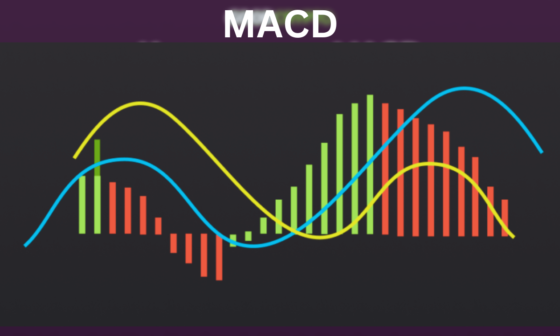
Some widely used indicators include moving averages, Bollinger Bands, MACD, oscillators (such as the Relative Strength Index or RSI, Stochastic RSI), and other indicators and volume analysis. These indicators help traders gauge market sentiment and potential shifts in momentum.
In the above picture, traders could look for a long position as soon as RSI indicates as Oversold, they can also look for a short position in the same way. Using more than two indicators can give better confirmation.
Make sure you don’t get trapped by false signals, therefore you should have a better understanding of Price action also downside risk.
Reversals in Technical Analysis
Technical analysis is a widely used approach to studying price movements and identifying potential reversals. Traders employ various technical tools and techniques to identify and confirm reversals. Here are two popular reversal patterns used in technical analysis:
1. Double Tops and Double Bottoms
Double tops and double bottoms, as mentioned earlier, are reversal patterns that form when the price reaches a specific level twice before reversing its direction.
A double-top pattern suggests a bearish reversal, while a double bottom pattern indicates a bullish reversal. These patterns are often confirmed by a breakdown below the neckline (for double tops) or a breakout above the neckline (for double bottoms).
2. Head and Shoulders Pattern
The head and shoulders pattern, characterized by the three peaks and the neckline, is a powerful reversal pattern. It indicates a potential reversal from a bullish trend to a bearish trend.
Traders look for the formation of the left shoulder, the head, and the right shoulder, followed by a breakdown below the neckline to confirm the reversal.
This pattern is widely recognized and can be seen on various timeframes, from intraday charts to long-term charts.
Reversals in Candlestick Analysis
Candlestick analysis is a popular technique used to identify potential reversals. Many traders analyze the shape, color, and arrangement of candlestick patterns to gain insights into market sentiment and potential trend reversals.
Taking indicators into confluence like the moving average for an entry point, could be better. Here are some key bullish and bearish reversal patterns in candlestick analysis:
1. Bullish Reversal Patterns
- Hammer: A hammer candlestick has a small body and a long lower shadow, indicating a potential bullish reversal after a downtrend.
- Bullish Engulfing: This pattern occurs when a bullish candle fully engulfs the previous bearish candle, signaling a potential shift in momentum.
2. Bearish Reversal Patterns
- Shooting Star: A shooting star candlestick has a small body and a long upper shadow, suggesting a potential bearish reversal after an uptrend.
- Bearish Engulfing: When a bearish candle fully engulfs the previous bullish candle, it indicates a potential reversal.
Reversals in Price Action Analysis
Price action analysis focuses on studying the movement of prices on a chart without relying heavily on indicators. Traders use support and resistance levels, as well as breakout and pullback strategies, to identify potential reversals. Here are two essential concepts related to reversals in price action analysis:
1. Support and Resistance Levels
Support and resistance levels are key areas on a price chart where the price tends to reverse. When the price reaches a support level and starts moving higher, it signals a bullish reversal. Conversely, when the price reaches a resistance level and starts moving lower, it suggests a bearish reversal.
2. Breakouts and Pullbacks
Breakouts occur when the price breaks a significant level of support or resistance. A breakout can signal a potential reversal in the direction of the breakout.
Pullbacks, on the other hand, refer to temporary retracements in the price after a breakout. This is the best trading technique used so far.
Experienced traders often look for pullbacks to enter positions in the direction of the reversal.
Incorporating Reversals in Trading Strategies
Now that we have explored various ways to identify reversals, let’s discuss how to incorporate them into trading strategies. Here are two common strategies:
1. Trend Reversal Strategy
A trend reversal strategy is a trading approach that aims to identify and capitalize on changes in the direction of a prevailing trend.
This strategy involves looking for signs of a potential trend reversal, such as the price reaching key support or resistance levels, the formation of reversal patterns, or the divergence of technical indicators. Looking at volume for buying pressure and selling pressure should be considered.
Traders employing a trend reversal strategy aim to enter trades at the early stages of a new trend, capturing the potential price movement in the opposite direction. Proper risk management and confirmation of reversal signals are crucial elements of this strategy to increase the probability of successful trades.
2. Breakout Reversal Strategy
The breakout reversal strategy involves identifying breakouts and subsequent pullbacks. Traders wait for a breakout to occur and then look for pullbacks that retest the broken level. If the pullback holds and the price starts moving in the opposite direction, it signals a reversal. Traders can enter positions in the direction of the reversal.
Risk Management and Stop Loss Orders
While utilizing reversals in trading strategies can be profitable, it’s crucial to implement proper risk management techniques. Setting stop loss orders is an effective way to limit potential losses in case the price moves against your anticipated reversal. By placing a stop loss order, you can define the maximum acceptable loss for a trade and exit the position if the price hits that level. This helps protect your capital and manage risk effectively.
Additionally, it’s essential to determine the appropriate position size based on your risk tolerance and account size. Risking a small percentage of your capital per trade ensures that a series of losing trades does not have a significant impact on your overall portfolio.
The Psychological Aspect of Trading Reversals
The psychological aspect of trading reversals plays a critical role in a trader’s decision-making process.
When engaging in reversal trading, emotions such as fear, greed, and uncertainty can influence trader behavior. Fear can lead to hesitancy in taking trades, while greed can drive impulsive and risky decisions.
Uncertainty may arise when traders question their analysis or doubt the validity of reversal signals. Traders need to cultivate patience and discipline, manage their emotions effectively, and overcome biases such as confirmation bias.
By understanding and addressing the psychological challenges associated with trading reversals, traders can make more rational and informed trading decisions.
Backtesting and Reversal Trading
Backtesting is a crucial aspect of reversal trading, allowing traders to evaluate the performance of their trading strategies using historical data. It involves simulating trades based on past market conditions to assess profitability and risk-reward ratios.
Writing down past performance on research papers or journalizing should be taken into consideration.
By backtesting, traders can refine their trading rules, optimize parameters, and identify strengths and weaknesses in their reversal trading strategies.
It helps validate assumptions and build confidence in the strategy’s effectiveness. Backtesting also quantifies the risk involved and provides valuable insights into the strategy’s performance under different market conditions.
By incorporating backtesting into their trading routine, traders can make more informed decisions and improve their chances of success in reversal trading.
The Role of Fundamental Analysis in Reversal Trading
Fundamental analysis plays a significant role in reversal trading by providing insights into the underlying factors that can drive price reversals.
It involves examining economic indicators, company financials, news events, and market sentiment to gauge the intrinsic value of an asset.
Fundamental analysis helps traders identify potential catalysts that can trigger reversals, such as changes in company earnings, macroeconomic data, or shifts in market trends.
By incorporating fundamental analysis into their trading strategy, traders can gain a deeper understanding of the market dynamics and make informed decisions when identifying reversal opportunities. It complements technical analysis and enhances the overall effectiveness of reversal trading strategies.
Advanced Reversal Trading Techniques
For experienced traders, advanced reversal trading techniques can further enhance their profitability. These techniques include divergence analysis, Fibonacci retracements, and harmonic patterns.
Divergence analysis involves comparing price movements with technical indicators to identify potential reversals. Fibonacci retracements help identify key levels of support and resistance for potential reversals. Harmonic patterns provide a systematic approach to spotting reversals based on specific geometric structures in price movements.
Managing False Reversals
False reversals, also known as fakeouts, can be a challenge for traders. They occur when the price briefly reverses but then resumes its previous trend. Managing false reversals involves waiting for confirmation signals, such as additional candlestick patterns or indicators, before entering a trade.
This approach helps filter out potential fakeouts and improves the accuracy of your reversal trading strategy.
Reversals in Different Financial Markets
Reversals can occur in various financial markets, presenting opportunities for traders across different asset classes. Here’s a glimpse of reversals in some key financial markets:
- Stock Market: In the stock market, reversals can occur when a prevailing trend changes direction. These reversals can be driven by company-specific news, earnings reports, economic indicators, or shifts in investor sentiment. Traders look for signs of reversal, such as the price breaking key support or resistance levels, chart patterns like double tops or bottoms, or divergences in technical indicators.
- Forex Market: Reversals in the forex market happen when the value of a currency pair changes direction. This can be influenced by geopolitical events, central bank decisions, economic data releases, or shifts in market sentiment. Traders analyze currency charts, trendlines, Fibonacci retracements, and candlestick patterns to identify potential reversal points.
- Commodity Market: Reversals in the commodity market can occur due to factors such as supply and demand imbalances, geopolitical tensions, weather events, or changes in market sentiment. Traders monitor price levels, trendlines, and technical indicators specific to each commodity to identify potential reversal signals.
- Cryptocurrency Market: Reversals in the cryptocurrency market can be driven by a range of factors, including regulatory developments, market adoption, technological advancements, or shifts in investor sentiment. Traders use chart patterns, trendlines, volume analysis, and indicators like the Moving Average Convergence Divergence (MACD) to spot potential reversals in cryptocurrency prices.
- Bond Market: Reversals in the bond market can occur due to changes in interest rates, economic indicators, central bank policies, or market expectations. Traders analyze bond yields, yield curves, and market sentiment indicators to identify potential reversals in bond prices.
In all these financial markets, traders employ various technical and fundamental analysis techniques to identify and capitalize on reversal opportunities. Understanding the unique dynamics of each market is crucial for successful reversal trading and requires continuous monitoring of market conditions and ongoing analysis of relevant factors.
Conclusion
In conclusion, reversals play a crucial role in trading strategies by providing opportunities to identify potential trend changes and profit from them. By incorporating various indicators, patterns, and price action analysis techniques, traders can enhance their ability to identify and capitalize on reversals in the market.
It’s important to remember that reversals do not guarantee profitable trades. Successful trading requires a comprehensive approach that combines reversals with proper risk management, thorough analysis, and an understanding of other market factors.
By staying disciplined, continuously learning, and adapting your strategies to changing market conditions, you can improve your ability to spot reversals and make informed trading decisions.
FAQs
1. How often do reversals occur in the market?
Reversals can occur at any time and frequency in the market. They are influenced by various factors such as market conditions, economic news, and investor sentiment.
2. Can I rely solely on reversals for my trading decisions?
While reversals are valuable indicators, it’s recommended to use them in conjunction with other technical and fundamental analysis tools to increase the accuracy of your trading decisions.
3. Are reversals more suitable for short-term or long-term trading?
Reversals can be applied to both short-term and long-term trading strategies. The timeframe depends on your trading style and preferences.
4. Do reversals guarantee profitable trades?
Reversals do not guarantee profitable trades. It’s important to combine reversals with proper risk management techniques and thorough analysis to increase the probability of successful trades.
5. What are some common mistakes to avoid when using reversals in trading?
One common mistake is relying solely on reversals without considering other market factors. It’s essential to use reversals as part of a comprehensive trading strategy. Additionally, traders should avoid chasing reversals and instead wait for confirmation before entering a trade.


