
Traders intrigued by technical analysis must have encountered or perhaps employed chart patterns in trading. Harmonic trading patterns are complex chart patterns that can assist technical analysts in understanding price action and predicting where the price can go next.
Harmonic patterns have a proven track record of providing profitable trades. They occur naturally in financial charts based on Fibonacci levels and geometric price action. They were first introduced by Harold Mckinley Gatley to the trading world in 1932. Gartley developed a pattern, gave it his name, and described it in his 1935 book Profits in the Stock Market.
In essence, a harmonic pattern helps traders comprehend how price swings and retracements relate to Fibonacci sequences and exhibit order in the seemingly chaotic market action.
When correctly identified, these patterns enable traders to enter the trade with little risk in a highly probable reversal zone. In order to measure these linkages, harmonic trading strategies make use of Fibonacci numbers and price patterns. However, they require patience to form as there are chances of error if the trade is attempted before it fully materializes.
Read on to learn more about them and some top harmonic trading patterns every trader should know.
What is a Harmonic Pattern?
Harmonic patterns are trading tools created from Fibonacci ratios and geometric calculations. They combine mathematical and graphical components and are considered one of the most precise technical analysis tools as they enable traders to foresee the prospective price movement direction and the possible trend targets.
Harmonic trading refers to the concept that trends are harmonic phenomena, meaning they may be divided into smaller or larger waves that can forecast price direction and key trend reversal or turning points. They offer a potential reversal zone that helps traders to enter reversal trades just as they are about to exhaust themselves.
They are a fairly accurate tool for identifying extremely specific price movements. Furthermore, harmonic patterns produce fewer false signals than a lot of other technical tools. This is because certain geometric features as well as harmonic patterns, must form in the proper ratios.
Although harmonic patterns can be tricky, you can master them to improve your trading in the stock and forex market.
History of Harmonic Patterns
Harmonic patterns gained popularity among traders in the past few years. Mostly animal names, such as shark, crab, and bat, inspired the names of these patterns.
H.M. Gartley developed the idea of harmonic patterns in 1932. In his book Profits in the Stock Market, Gartley discussed a 5-point pattern known as Gartley. Furthermore, Larry Pesavento enhanced this pattern using Fibonacci ratios and created guidelines for trading the “Gartley” pattern in his book “Fibonacci Ratios with Pattern Recognition”.
Later several patterns were added to the list of harmonic databases. And the best work done so far is by Scott Carney, who invented patterns like Bat, Crab, 5-0, and Shark and contributed a significant depth of understanding for their risk/money management, trading rules, and validity.
We can tell from the historical development that a single person’s harmonic pattern did not arise over time or by chance. Since its inception, it has been developed over time by several traders, and the harmonic pattern is still developing. There are many harmonic patterns in use today, but we’ll focus on the top ones for the forex market.
How Harmonic Patterns Work?
A harmonic pattern is used to identify significant turning points in a market. This pattern, unlike standard chart patterns, must meet specific movement requirements to be recognized as a valid and thus tradeable pattern. As a result, trading traditional chart patterns becomes less subjective and more objective. Since movement parameters depend upon Fibonacci retracements and extensions, trading harmonic patterns necessitates the proficiency of these Fibonacci tools.
Fibonacci retracements are employed to identify price levels where the price is expected to return moving in the direction of the main trend, whereas Fibonacci extensions are employed to find high-probability price objectives in a trending market.
What do Harmonic Patterns look like?
All harmonic patterns are generally based on five turning points in the price of an asset or security. These points are called X, A, B, C, and D.
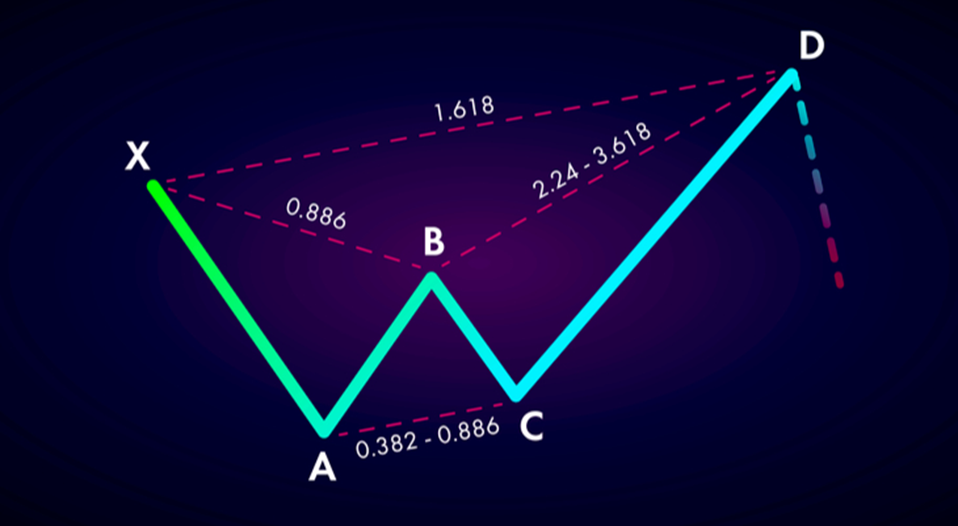
Each type of harmonic chart pattern has a different Fibonacci ratio and geometric shape. They also follow their own set of rules.
Top Harmonic Patterns
There are many different harmonic patterns, but some are more popular. Each has a bullish and bearish variant, meaning when the formation is upside down, it may imply a rise or decline in price.
Traders in all financial markets, including forex, stocks, and commodities, can benefit from harmonic patterns.
Let’s take a look at the detailed explanation of some of the top harmonic patterns and how they can be traded:
The Gartley Pattern
The Gartley pattern is a straightforward harmonic pattern, which is preceded by a prominent low or high. As discussed above, Harold McKinley Gartley created this pattern. Based on the page number it’s described in his book, Profits in the Stock Market, it’s also known as the “222” pattern.
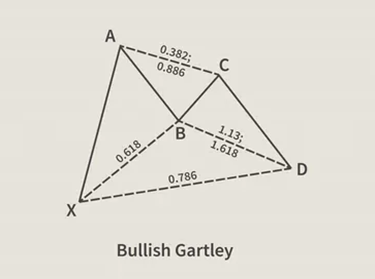
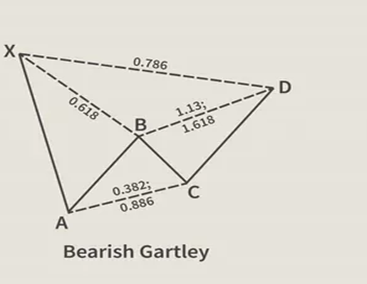
Gartley patterns typically appear when the general trend is being corrected. Bearish Gartley patterns have an ‘M’ shape, whereas bullish patterns have a W shape.
The bullish pattern is frequently observed early in a trend and indicates that the corrective waves are coming to an end and that point D will be followed by an upward surge. Traders need to be aware that any patterns could be seen in the context of a larger trend or range.
There is a lot of information here to process, but this is how to interpret the chart. The bullish example for the Gartley pattern will be used.
Price advances to A, it corrects, and then swings back down to B, which is a 0.618 retracement of wave A. The price rises via BC and represents a retracement of AB from 0.382 to 0.886. The following move is downward via the CD extension of AB from 1.13 to 1.618. A 0.786 retracement of XA occurs at the D point. Many traders anticipate CD extending AB from 1.27 to 1.618.
The probable reversal zone is located at position D. This point is where long positions can be entered, however, it is advised to wait for some evidence that the price has begun to rise before opening long trades here. A stop-loss is set up not far below the entry.
For the bearish pattern, traders can go short near point D, with a stop loss not far above.
The Butterfly Pattern
The butterfly pattern resembles the Gartley harmonic pattern but has different ratios. Besides, point D extends beyond point X.
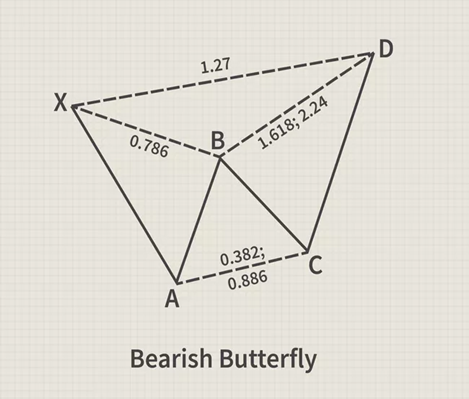
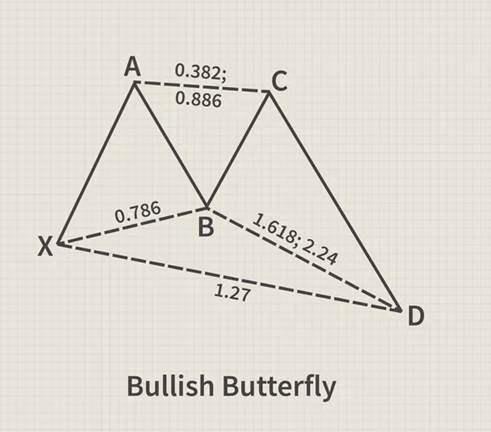
In the case of a bearish butterfly pattern, the price drops to point A. A 0.786 retracement of XA makes up the upward wave of AB. A retracement of AB from 0.382 to 0.886 in BC. A 1.618 to 2.24 extension of AB is CD. The XA wave is extended by 1.27 at D. D is a potential place for a short trade, but it is advised to hold off until there is some evidence that the price is starting to go downward. Set a loss stop just above the swing high at point D.
The AD Fibonacci ratios are used to estimate take profit. Take-profit goals like 0.50, 0.618, 1 (at point A), and 1.618 (above point A) are frequently employed.
The bearish and bullish butterfly patterns are identical in terms of ratios, with the exception that the bullish butterfly pattern starts with an upward XA leg.
With each of these patterns, some traders search for any ratio between the two numbers while others just search for one. For example, it was stated earlier that CD is an extension of AB between 1.618 and 2.24. Some traders will ignore numbers in between unless they are extremely near to the numbers 1.618 or 2.24 and only search for those two digits.
The Bat Pattern
The bat pattern was developed by Scott Carney in the initial years of the 2000s. Like the Gartley pattern, the Bat harmonic pattern is a retracement and continuation pattern, which appears when a trend briefly changes direction but then resumes moving in the original direction.
This pattern enables traders to profitably enter a trend when it is beginning to gain momentum.
The bullish bat pattern looks like a stretched-out letter M. The price rises via XA. B follows XA’s path from 0.382 to 0.5. BC retraces from 0.382 to 0.886 of AB. A 1.618 to 2.618 extension of AB is CD. The D point is located at the 0.886 retracements of XA. D is the place to open a buy position, but you should wait for the price to start increasing before doing so. A stop loss can be positioned not far below.
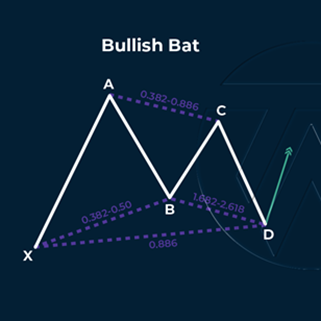
Profit goals can potentially extend higher than A and are based on Fibonacci ratios. The take-profit levels 0.50, 0.618, 1, and 1.618 are frequently used since they could act as future support and resistance levels.
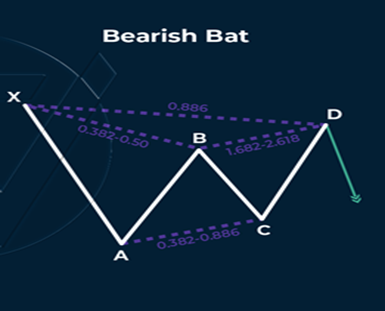
The bearish bat pattern looks like a stretched-out letter W. The ratios are the same, but the pattern starts with a price drop from X to A. The lines AB, BC, and CD represent an upward motion, a downward motion, and an upward wave, respectively. The area shown in Point D is where traders might look for a price decline. They can place a stop loss just above point D and go short there.
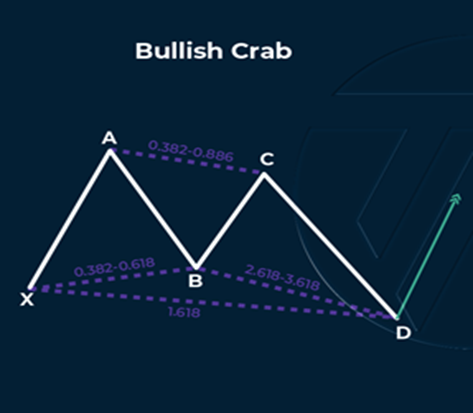
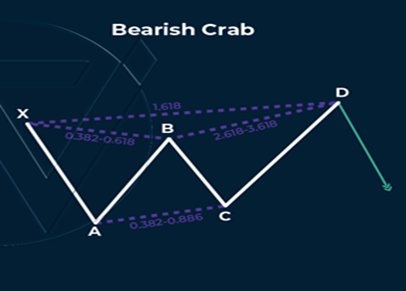
The Crab Pattern
Carney rates the crab pattern as one of the most accurate patterns because it offers reversals that occur very near to what the Fibonacci numbers suggest.
The crab pattern resembles the butterfly pattern but differs in measurement. It follows an X-A, B-C, and C-D formation, enabling traders to enter extreme lows or highs. The defining aspect of the crab pattern is the 1.618 extension of the XA leg to the CD leg.
In a bullish crab pattern, Point B will retract from Point XA by 0.382 to 0.618. BC will retrace from AB by 0.382 to 0.886. AB’s 2.618 to 3.618 are extended by the CD line. A 1.618 extension of XA is Point D. Invest in long positions near D with a stop loss just below.
A bearish pattern follows a price decline from point X to point A. A minor price gain follows with a tiny decline, and then a rapid increase to point D. Enter a short position near F and place a stop loss not far above.
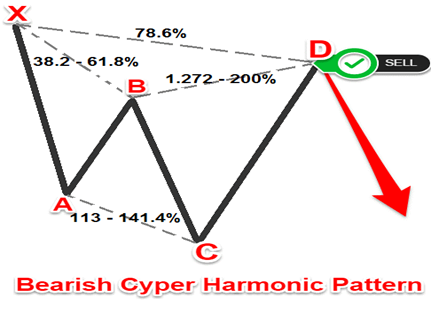
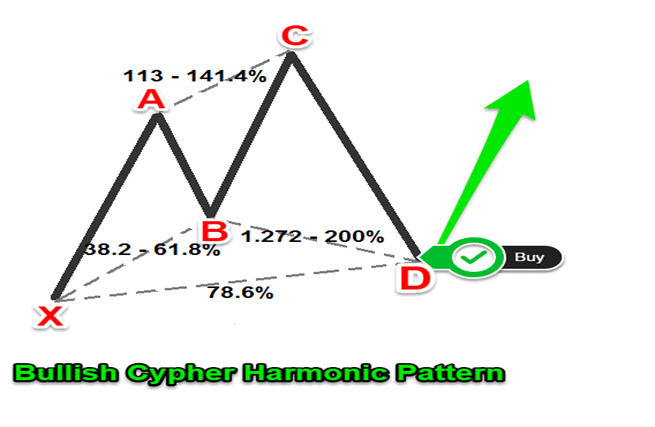
The Cypher Pattern
There are four waves or legs and five touchpoints in the cipher pattern. Each leg indicates a price action, while each touchpoint denotes reversal levels.
It employs more constrained Fibonacci ratios (often less than 1), giving a steeper visual appearance.
An impulse leg (XA) and a retracement leg (AB) that at least reaches the 38.2% Fibonacci retracement of the XA leg without going above 61.8% make up a qualified cipher pattern.
When traded properly, this complex harmonic trading pattern can attain a really impressive strike rate and a decent average reward-to-risk ratio.
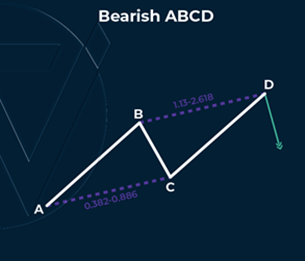
The ABCD Pattern
The ABCD pattern operates very differently from the other patterns. The AB leg drops when an ABCD pattern is bullish. BC retraces from 0.382 to 0.886 of AB. Point D is obtained by subtracting point C from point A once C has been determined. The higher reversal at point D should be the goal for traders.
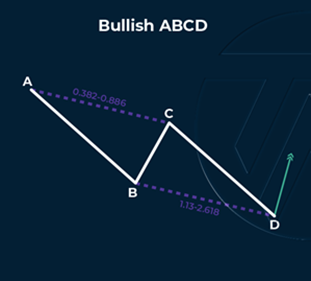
The ratios are the same for a bearish ABCD. If the price falls out of the zone as the price approaches D, traders can opt to go short. Above the most recent swing high is where a stop-loss order is placed.
You might think about placing your profit goals between points D and C because the trend can be rather strong, and you are trading a trend that will likely reverse. A Fibonacci retracement tool could be used with targets set at 0.50, 0.618, or 1.
Limitations of Harmonic Patterns
We all know that no technical indicator is 100 percent accurate, and anticipated reversals from harmonic patterns may go against you.
In actual trading charts, harmonic patterns that adhere to stringent aspect ratio requirements are extremely uncommon. This increases subjectivity in the judgment and raises the possibility of an erroneous prognosis.
Additionally, harmonic patterns have the possibility of human errors. Not that we’re disparaging your mathematical prowess, but they are extremely precise patterns that lose all of their meaning if the calculations are off. Be patient and hold off on making a trade until you are certain the pattern is behaving according to the rules.
Conclusion
Every trader aspires to achieve trading success. It’s not difficult to learn how to trade the market using harmonic patterns. If plotted properly, they are one of the most beneficial patterns.
But do not forget that harmonic trading has certain inherent drawbacks and is a discipline-demanding, rule-based approach.
The Gartley, Butterfly, bat, crab, cipher, and abcd are well-known patterns, which traders watch for.
Make sure to pay consideration to support and resistance levels to increase the reliability of harmonic patterns. To boost your confidence, pair harmonic patterns with price action reversal patterns like bullish or bearish engulfing.
Finally, remember to set your goal and stop loss levels at appropriate price levels.