
When it comes to studying the essence of the AB CD pattern, it’s necessary to understand that it is a harmonic form of pattern that comprises two identical legs- AB and CD.
This day trading pattern comes with two intraday swings with a smaller countertrend leg (in-between) i.e. BC.
However, this is not the only form available for the AB CD pattern- traders may come across multiple variations, particularly ABCD pattern interpretation, and extension.
These intraday chart pattern variations act more like a handle and cup pattern, which traders have to understand before using them in trading.
Introduction to the ABCD Pattern
Known for its geometric, visual chart patterns, the ABCD pattern says a lot about a trade happening on the price chart.
Primarily, the AB CD pattern consists of 3 consecutive swings that are responsible to give a diagonal lightning bolt shape to indicate upcoming profit opportunities.
At first glance, it seems like the swings have been created in a rhythmic style based on the market movement.
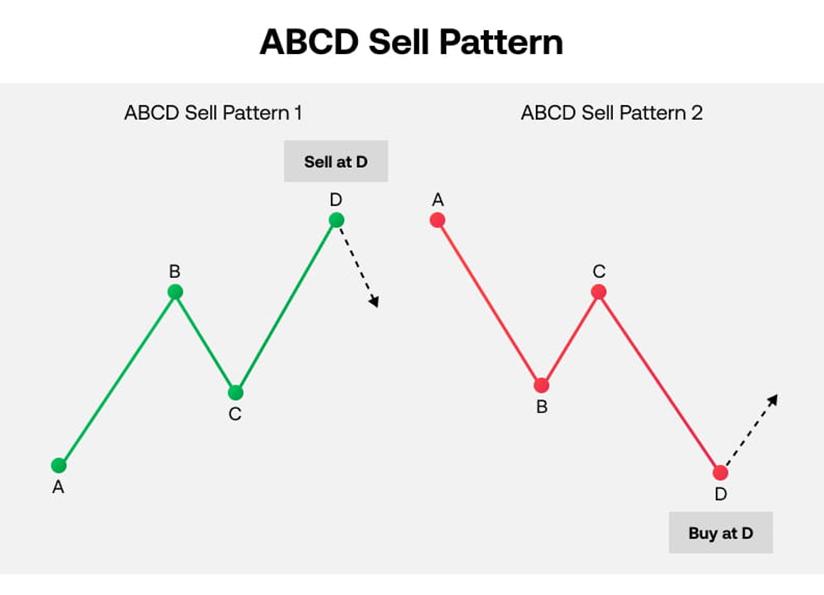
But in reality, its 4 highs and lows are behind its shape and style that have specific meanings on the price chart:
- Point A- a new trend begins/ form
- Point B- the market repeats
- Point C- initial trend resumes
- Point D- next correction can be traded
The best part about the ABCD pattern is its consistency for both the buy and sell forms for any market (stocks, forex, etc.) under any condition (uptrends, downtrends, rangebound, etc.) during any timeframe.
Method to Draw an ABCD Chart Pattern
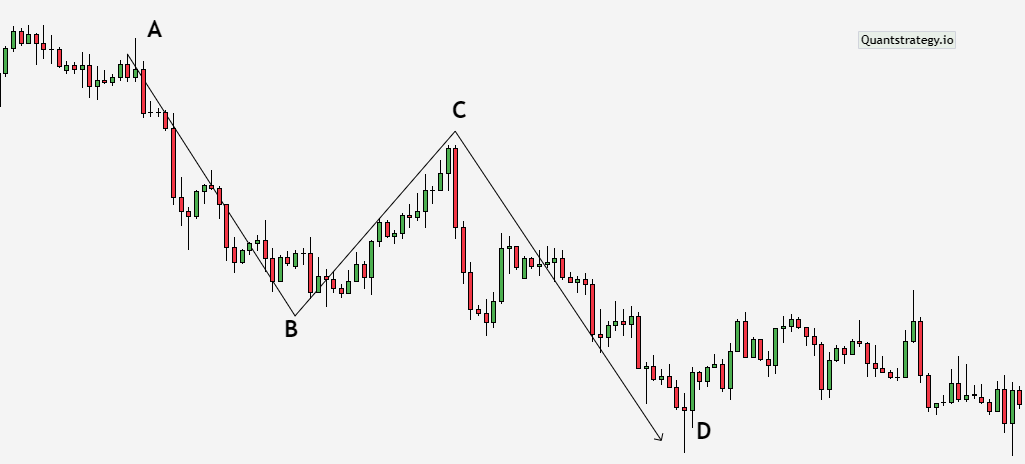
When it comes to drawing the ABCD patterns on the price chart, it’s important to identify the distance between A and B, which is referred to as its first leg. Its movement must be strong so that it would be easy for traders to anticipate the upcoming pullback from B to C.
For the correct formation, it’s crucial to wait until either of the ends forms on B to C pullback so that traders can easily connect the first leg to the line from the low of B or high of A.
Lastly, start the third trendline from C’s high to D’s low. The result should be like this:
Another school of thought states to attach from the trend’s center.
In the below image, it can be seen that the line joins B from the middle to C’s pullback- not the high and low. This approach gives a more symmetric ABCD trading pattern.
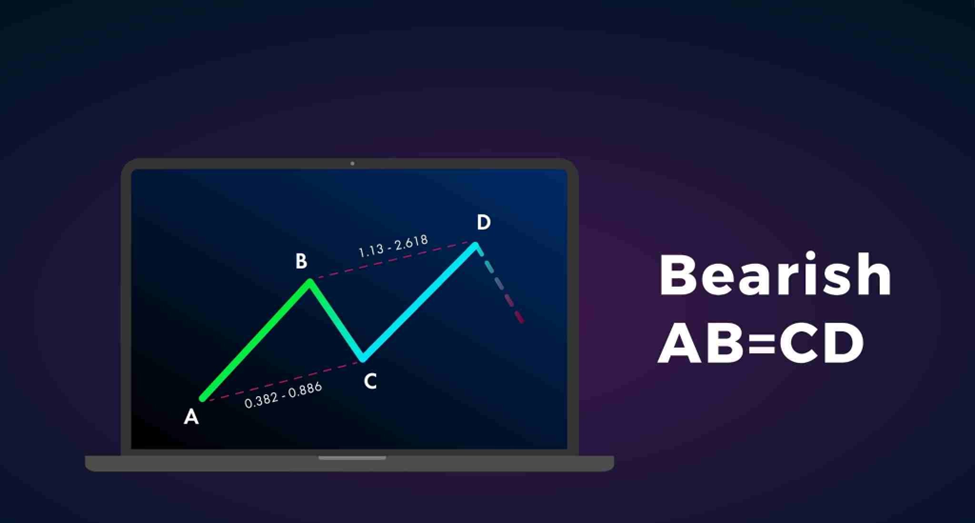
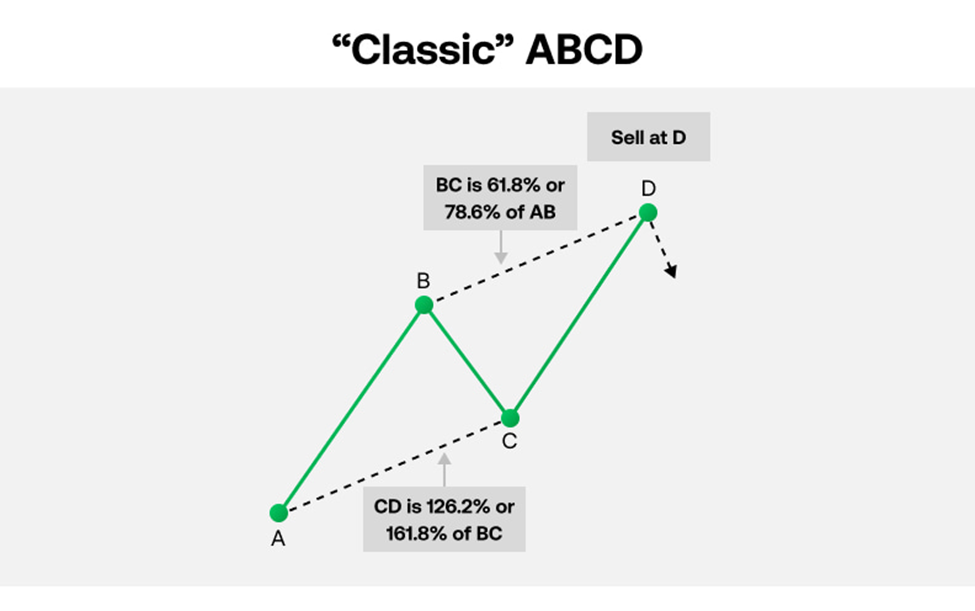
Another theory i.e. the classic harmonic pattern theory, emphasizes measuring the distance from AB to BC moves followed by from BC to CD moves to get closer or similar calculations:
- BC equals 78.6% or 61.8% of AB
- CD equals 161.8% or 127.2% of BC
Here, a formula can also be applied- AB = CD- where the lengths of AB and CD are equal or the time taken by AB to complete is equal to that for CD.
Find the ABCD Pattern
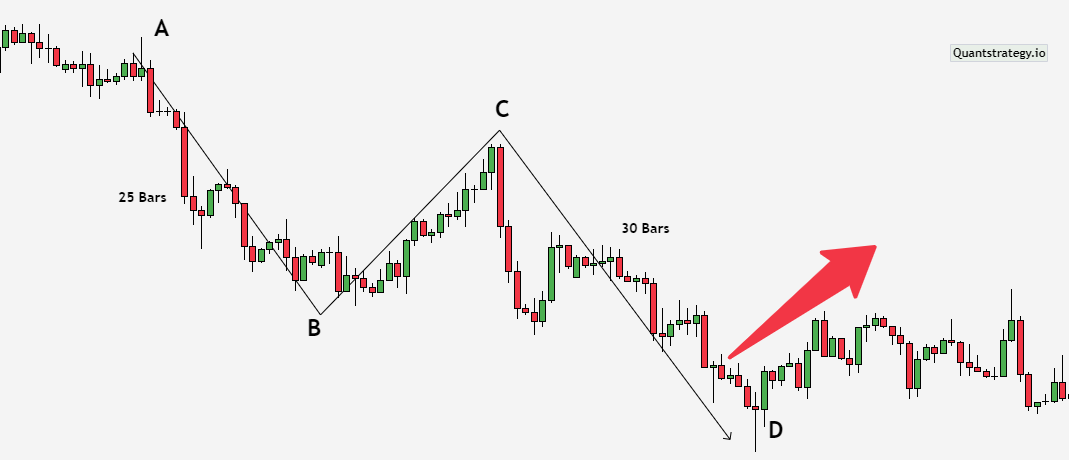
To begin with, traders have to find the moves or legs between points. CD and AB demonstrate movement in the direction of the trend whereas, BC shows retracement.
Practically, every leg lies between 3 and 13 bars, meaning that if an ABCD pattern lasts beyond 13 bars, traders must check the trend or Fibonacci convergence followed by moving a longer timeline.
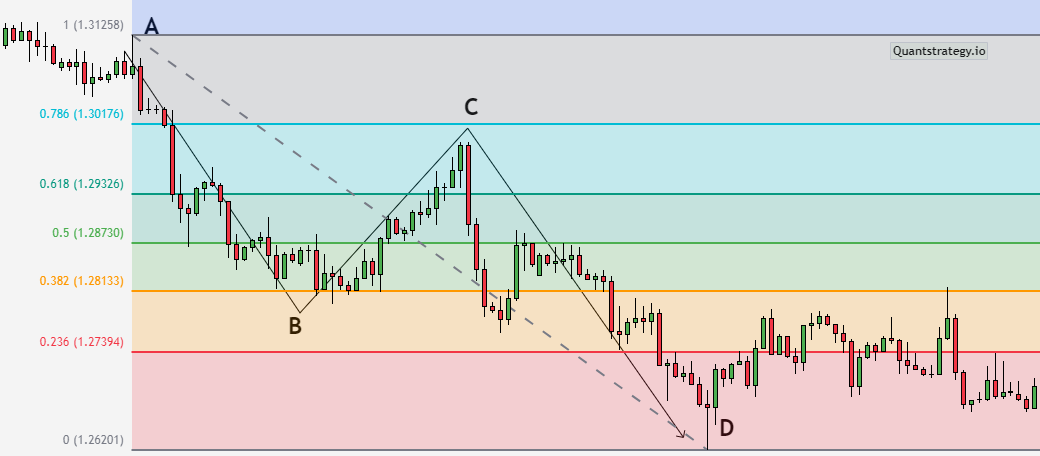
Once an ABCD trading pattern is identified, it’s time to apply the Fibonacci retracement tool for validation. This way, it would be helpful to figure out when the pattern will be complete and where to make an entry.
In the classic approach, traders must apply the Fibonacci retracement tool at the start of point A to point B move so that the BC line comes up with the calculations as 78.6% or 61.8% of AB.
Moreover, the CD line must be 161.8% or 127.2% of the BC, showing bearish trends.
For a bullish ABCD pattern, investors may opt to buy the market while in a bearish ABCD pattern, they may decide to open a sell position.
How to Trade with an ABCD Pattern?
Taking the example of the above SPY chart, it’s evident that the ABCD chart pattern takes some time to create the D extension and then redirects the trade in the opposite direction.
In other words, the chart pattern is emphasizing making a trade on point D during a downtrend or selling during an uptrend.
As can be seen clearly on the price chart, if taken a timely decision and bought at D, there would be a rally trade happening back on the C i.e. the congestion area.
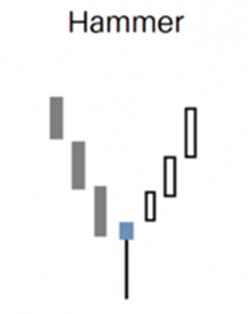
Here, the candlestick pattern at the reversal area D is also worth considering because of its impact on the trade.
The existence of a hammer candle confirms the perfect bullish price reversal.
Provided with a handle beneath and a mallet on top, a hammer candle can be found either at the end of an uptrend or a downtrend.
When used correctly, investors may enter the market as soon as the candle closes followed by creating a stop order below the handle.
Other than that, there is much more to the methods of using an ABCD pattern. Some of them are:
- ABCD Pullback Strategy
While looking for variations in the ABCD pattern, many traders prefer the BC pullback approach because it opens opportunities to deal in the AB/CD trend.
For instance, if an asset’s trend is going upward on the AB leg, intraday scalp traders can forecast the BCD section and may decide to buy the breakout.
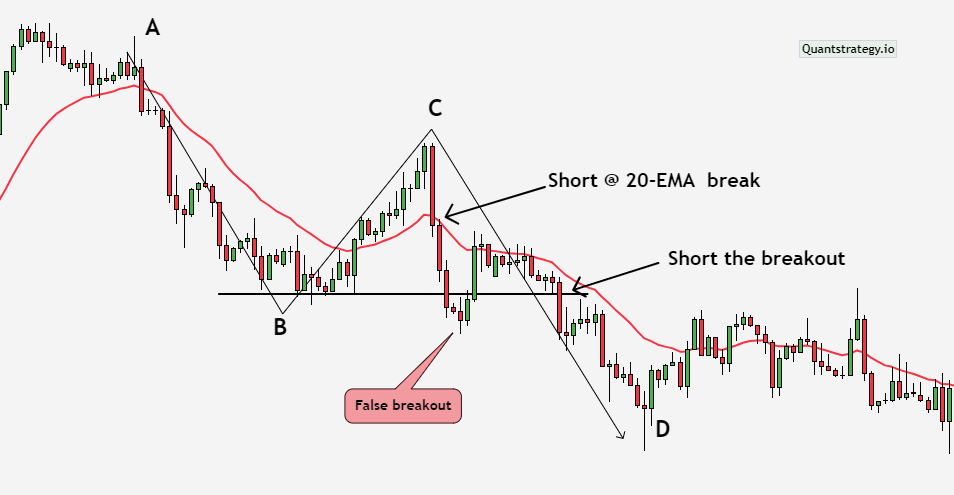
Apart from making a purchase, some traders also look for favorable moving averages such as the 20ema (exponential moving average).
To be precise, if an asset shows resistance in the BC leg at the 20 MA, they can think to make an entry. At this point, the breakout may work as an added entry point (as shown above).
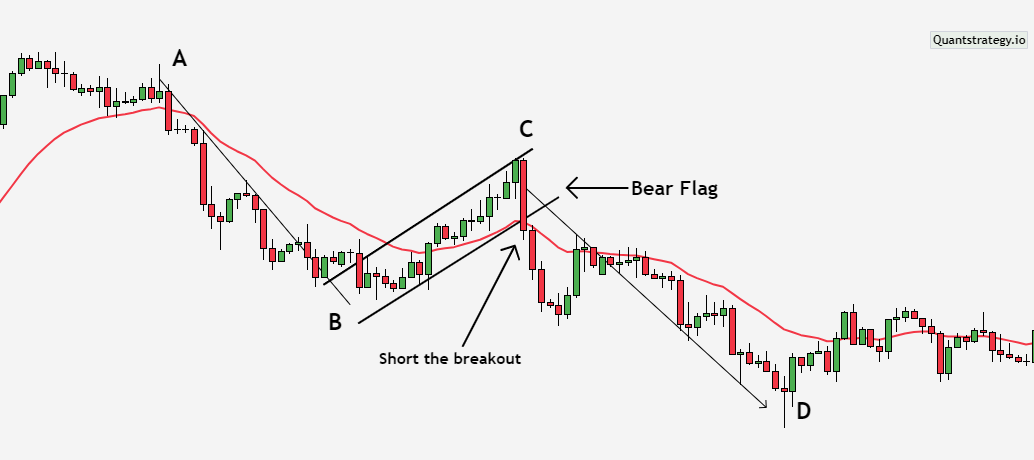
- ABCD Bear Flag and Bull Flag Strategy
In the ABCD patterns, the CD leg looks more like a bear flag or a bull flag based on the trend and prevailing market conditions.
Considering the above example, it looks similar to a bear flag. Such flags often look like pennants or wedges based on the pullback and its structure.
How to Interpret the ABCD Pattern?
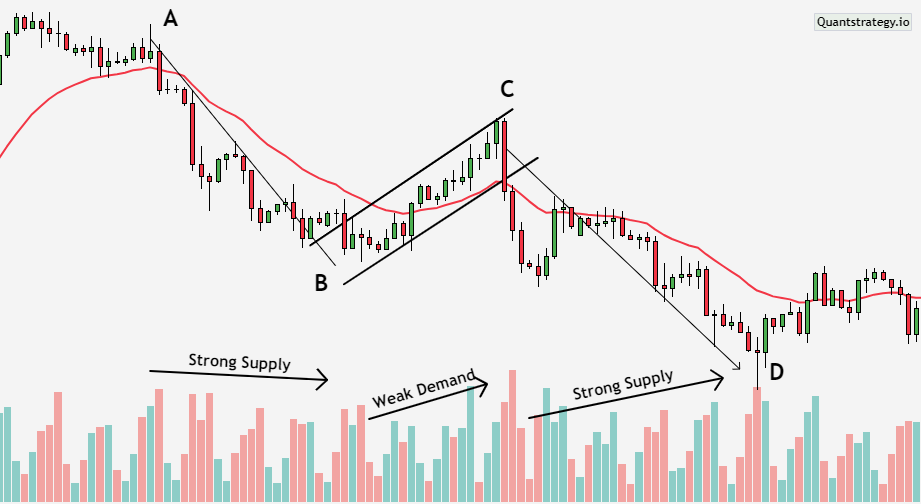
One of the key rules to read the ABCD pattern is to evaluate the volume signature accompanying it. This rule applies to the volume increase of the initial leg.
Traders have to figure out when the volume increase in during upward or downward movement followed by receding on BC consolidation and rising another time on the last leg.
Considering the trend, it’s evident that demand or supply is a stronger position to make an initial move.
Once it is completed, traders have to pay attention to the BC pullback. It must not be too strong or else, they would have a V-bottom trend reversal. Only after that, they can expect to see a rise in volume as the stock moves in its actual direction.
The conclusion of the chart pattern revolves around the strength of the trend. Volume also correlates with the tailwind of the ABCD pattern.
In case of an uptrend, there would be strong demand, weak supply, and eventually, strong demand. For a downtrend, it’s vice versa.
Conclusion
Every trader must know the significance of the ABCD pattern in trading strategies and trading chart patterns.
As soon as the pattern touches the D point, traders must think of making a counter-trend trade.
For instance, if it shows an uptrend, the strategy should be to go short, or in case of a downtrend, go long is ideal.
Though, no one can ignore the alternatives to trade with the ABCD trading pattern, particularly as a scalper in the primary trend’s direction.