


A stochastic trading strategy is one of the most effective ways traders analyze market momentum and identify potential reversals.
Based on the stochastic oscillator, this strategy helps pinpoint overbought and oversold conditions, making it easier to anticipate shifts in price direction.
Originally developed in the late 1950s by Dr. George Lane, the stochastic oscillator compares an asset’s closing price to its recent price range, revealing the strength and momentum behind each move.
While it’s often compared to the Relative Strength Index (RSI), the stochastic indicator offers unique insights into market behavior that can enhance any trader’s toolkit.
In this guide, we’ll explore what the stochastic oscillator is, how it works, and how to build an effective stochastic trading strategy step by step.
Stochastic Oscillator Explained
The stochastic oscillator, also known as a stochastic indicator, is a momentum indicator that was developed by a financial expert Dr. George Lane in the late 1950s. Like most other indicators, it was created for the security market, but traders also use it successfully for stock, forex, commodity, and cryptocurrency trading.
The stochastic oscillator compares a particular closing price of an asset with its high-low range over a given time period, generally the last 14 days. The time frames employed can be as brief as minutes or hours or as extensive as days, weeks, and months. Most trading platforms let you choose from a range of standard periods.
The indicator’s fundamental tenet is that momentum always moves ahead of price, so the stochastic indicator might predict a movement before it really occurs. In other words, prices may close near the high in a market trending upwards and may close near the low in a market trending downwards.
The stochastic oscillator displays overbought and oversold levels and offers traders possible buy/sell signals based on the price momentum. With its help, traders can determine if the price has entered an overbought or oversold region. Moreover, it is a range-bound oscillator that operates between 0-100 by default.
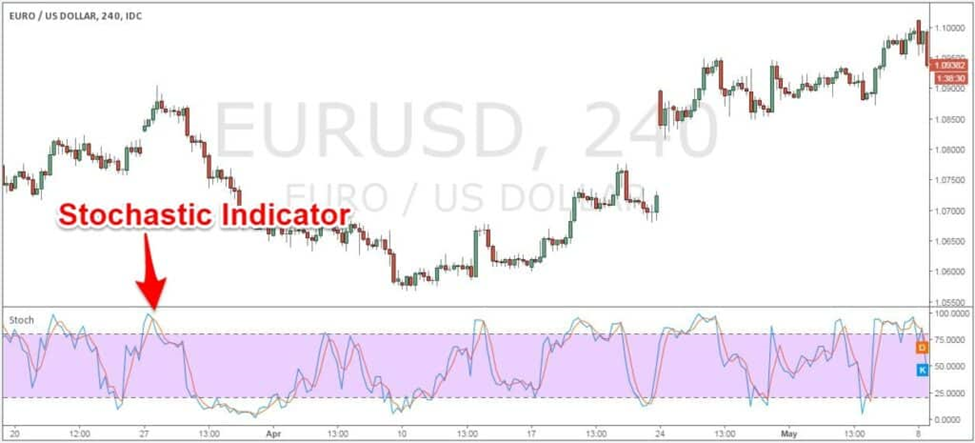
The lines travel up and down in a wave-like manner, always staying between the range of 0 and 100, which gives it the name stochastic oscillator.
The stochastic oscillator looks like this:
How the Stochastic Oscillator Works and How it is Calculated?
Traders use two types of stochastics – fast stochastic oscillator and slow stochastic oscillator.
The fast stochastic oscillator is represented by two lines – %K and %D.
%K is the main line and measure of price momentum.
%K Formula
%K = 100 x (Close – Low14) / (High14 – Low14)
In the formula above
- %K = the current market price of the asset being traded
- Close is most recent closing price
- Low14 = the lowest low price over the previous 14 trading periods
- High14 = the highest high price over the previous 14 trading periods
In simple words, the %K is determined by dividing the range between the current closing price and the lowest low by the market’s overall range (highest high minus lowest low), then multiplying this result by 100.
%D is the second line and represents the moving average of %K.
The %D line is typically regarded as more significant since it generates more precise trading signals. It is the %K line’s (usually three-unit period) simple moving average (SMA).
%D Formula
%D = SMA( %K, 3)
The fast stochastic oscillator reacts to market price by producing a lot of signals and is quite volatile. It won’t be able to filter out noise in a market that is strongly trending and will provide a lot of false signals, which will result in disastrous trades.
The Slow Stochastic Oscillator was created to regulate the signal more effectively. The Slow Stochastic Oscillator replaces the %K line with the %D line and the %D line with a %D 3-day moving average in order to reduce noise.
The slow stochastic differs from the fast stochastic oscillator in that it features a %K slowing period of 3 that regulates smoothness. The slow stochastic turns fast stochastic if the smoothing period is set to 1.
While the Slow Stochastic Oscillator was created to lessen volatility, it generates far more false signals than the Fast Stochastic in financial markets that are strongly trending.
Stochastic Trading Strategy: Buy and Sell Conditions
The stochastic indicator is a versatile technical analysis tool employed in many trading strategies. It oscillates between the 0-100 range.
How to Read Stochastic Oscillator?
- Low levels signify an oversold market, and high levels signify an overbought market.
- The market is oversold when the stochastic oscillator reading is 20 or lower. A value of 80 or greater indicates an overbought condition.
Remember that the price can frequently hang around in an oversold or overbought zone for an extended period. Although it is usual to treat reversals from oversold and overbought levels as buy/sell signals, we must keep in mind that these are simply assumptions and cannot be viewed as an indication for an entry.
You can utilize the stochastic oscillator in your trading in the following ways:
Trading Overbought and Oversold Levels
One of the popular stochastic oscillator strategy is to identify overbought and oversold levels. It is often used as an overbought/oversold indicator, although this is not the smartest way to generate entry signals. A Stochastic threshold of 80 or higher is frequently used by traders to indicate overbought conditions. A short-term correction may be in store once the stochastic rises above the 80 threshold, signaling that the price rose too quickly. A sell signal is produced once the stochastic declines below the 80 level.
- The Stochastic gives a buy signal when it crosses back above 20 after moving into an oversold region.
- The oscillator generates a sell signal when it goes below its threshold after moving over 80 into the overbought region.
This Stochastic indicator strategy only succeeds in non-trending conditions and will fall short when there is a significant trend.
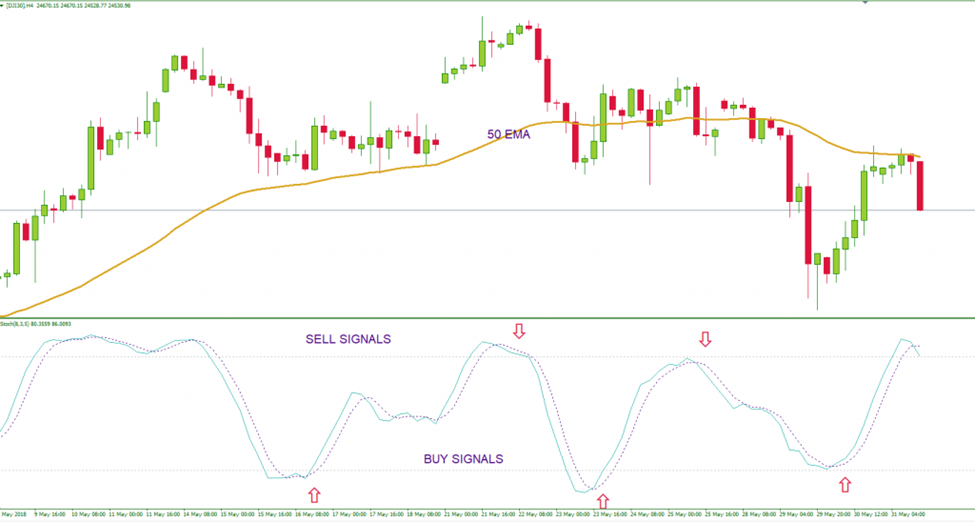
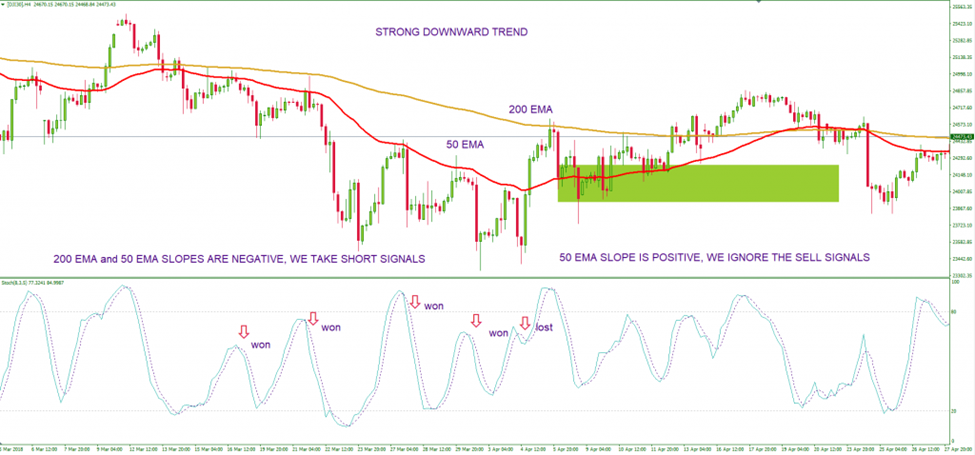
The aforementioned figure shows that the stochastic oscillator gives quite decent signals in non-trending markets, as shown by the slope of the 50-period exponential moving average.
The preceding chart’s stochastic settings were 8(%K period) – 3(%D period) -5(Slowing).
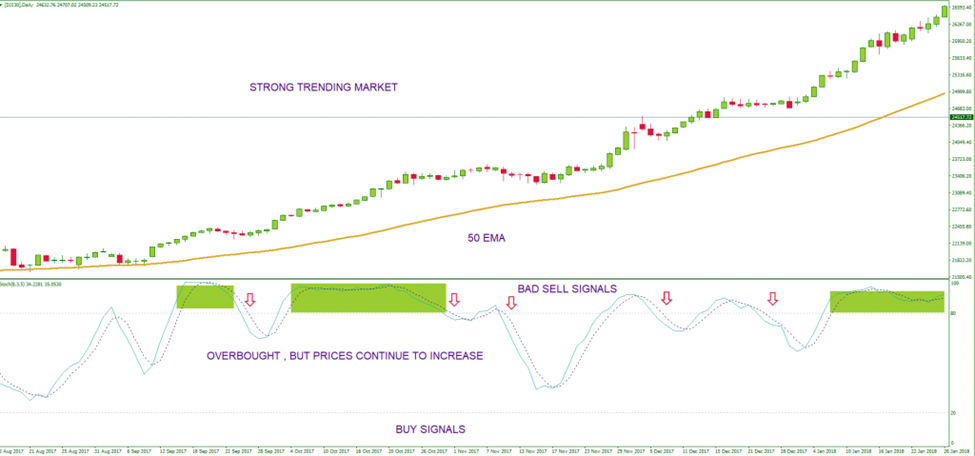
The Stochastic oscillator strategy produced a lot of erroneous sell signals in a trending market, which was supported by the positive slope of the 50-period exponential moving average. Furthermore, during that time, the price never returned to an oversold region, eliminating any chances for buying based on this method.
That is why Jake Bernstein, a popular futures analyst, and trader, provided an alternative approach for interpreting this momentum indicator. He noticed that, as seen in the chart above, when the price reaches an overbought region during a strong trend, it might stay there for a considerable amount of time. Therefore, a smarter entry would be on the long side, against traders who believe that the price is overbought and unable to increase.
Stochastic Indicator Divergences
Understanding stochastic indicator divergence is extremely crucial, as it can signal a trend reversal. George Lane, the inventor of the stochastic oscillator, believed that divergences were the most effective strategy for his momentum oscillator. He thought that price momentum frequently reversed before a real price turn, giving technical traders important information.
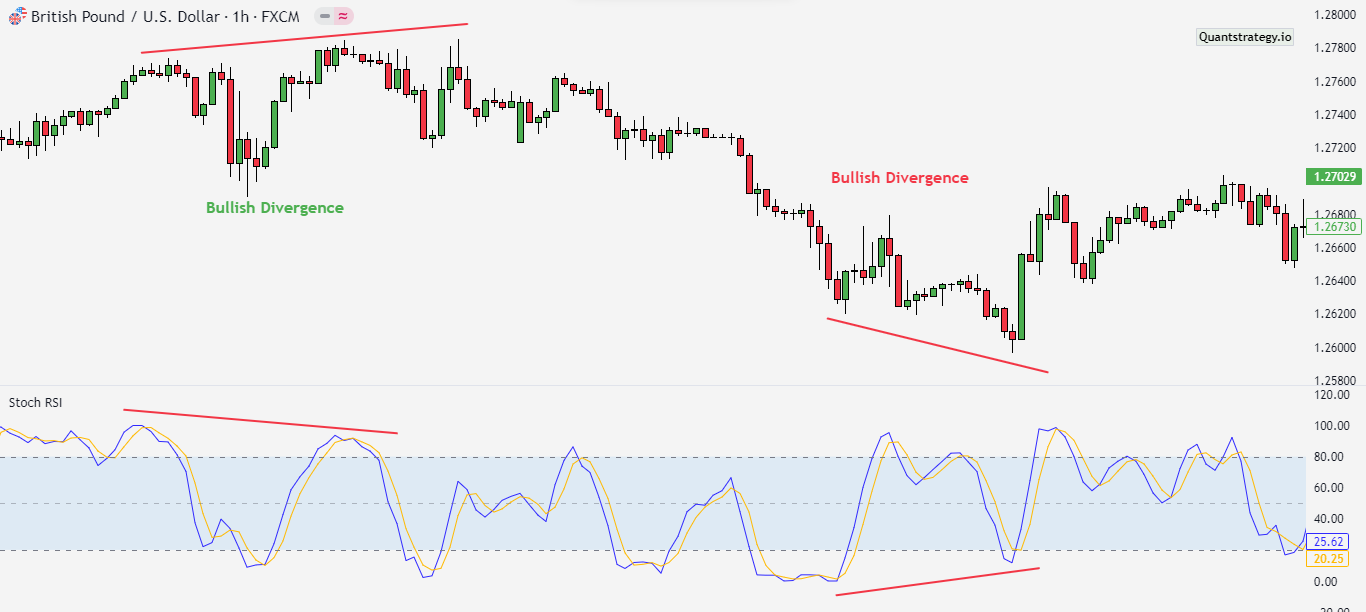
A bullish divergence occurs when the security’s price makes a lower low, and the stochastic oscillator makes a higher low, showing that downward price momentum is diminishing. This is a common sign of an impending upward market reversal.
Bearish divergence forms when an asset’s price makes a higher high and the stochastic indicator makes a lower high, showing that upward momentum is diminishing. This often acts as a precursor for downward price momentum.
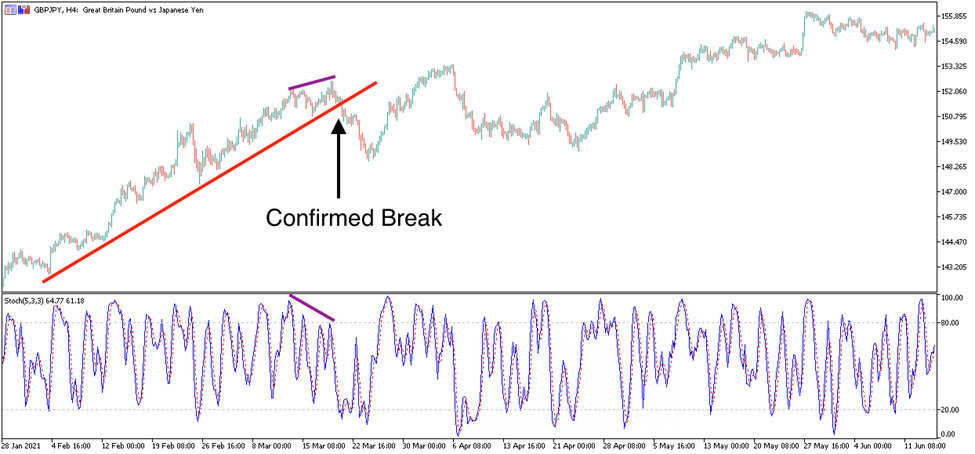
Divergence will almost always happen immediately following a sudden upward or downward price movement. Divergence is merely a hint that the price may reverse, and it is typically verified by a breach of the trend line. The below EURUSD H4 price chart shows a bullish divergence with a confirmed trend line breakthrough.
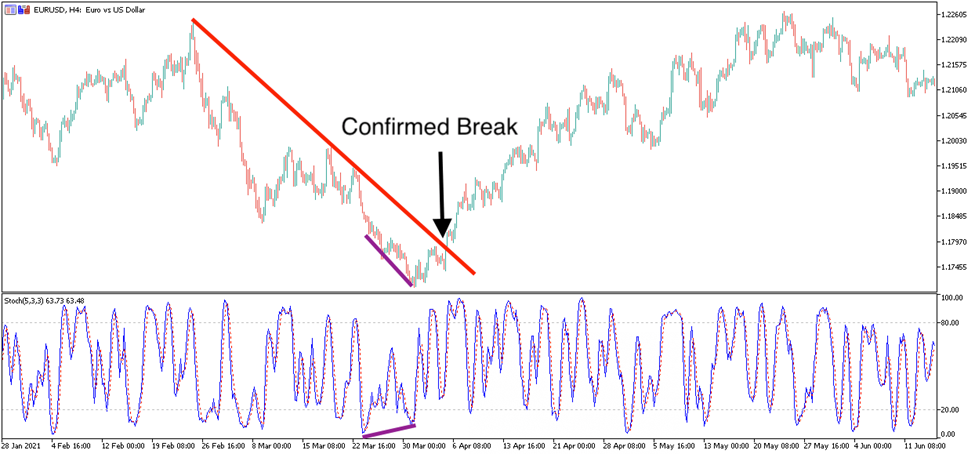
This is an illustration of bearish divergence with a breakout of the trend line:
The full slow stochastic oscillator (14,3,3) was used in the case of Walmart, and you can see how both bullish and bearish divergences on the indicator predicted price trend reversals.
Divergences, however, are caused by sluggish momentum and do not always portend a trend reversal, so it is important to keep this in mind. As a result, one should hold off on making additional verified entries until a trendline break on the price chart, as displayed above.
Stochastic Crossovers
The crossover of signal line (%D) and %K is another method for producing signals.
A long or short position forms when the stochastic oscillator crosses above or below the signal line. Since it will generate many false signals when used alone, this method is best employed in conjunction with other technical indicators.
Don’t forget that stochastic oscillator crosses are lagging and might cause a lot of whipsaws.
Trading stochastic indicator crossover involves determining the trend with two exponential moving averages (EMA) i.e. 200 and 500 EMA, and only taking trades in the direction of the market’s current trend.
- If the slopes of the EMA 200 and EMA 50 are positive, consider only long stochastic crosses.
- If the slopes of the EMA 200 and EMA 50 are negative, consider only short stochastic crosses.
What does the Stochastic Oscillator Measure?
The stochastic oscillator measures the momentum of price movements by comparing a security’s closing price to its price range over a specific period.
This technical indicator helps traders assess whether an asset is trading near its high or low for a given time period, typically 14 periods.
The stochastic oscillator generates values between 0 and 100, with readings above 80 suggesting overbought conditions and below 20 indicating oversold levels.
By focusing on the speed and direction of price changes rather than absolute price levels, it provides insight into potential trend reversals.
Traders use this tool to identify entry and exit points, especially in range-bound markets, making it a cornerstone of many momentum-based strategies.
Stochastic vs. RSI: Differences
The stochastic indicator and relative strength index have a lot in common. Both are momentum indicators that fluctuate between 0 and 100. They assess a price’s strength differently, though. The RSI compares a price’s strength during rising and falling price movements. The stochastics compares the current closing price with the highest and lowest prices recorded during a specific time period. Consequently, RSI is thought to be better suited in a trending market while stochastic is frequently utilized in a range-bound market.
Nevertheless, both indicators offer similar signals: they show overbought and oversold levels and let traders predict a price reversal with the divergence signal. The crossover signal is the only difference. Unlike the RSI, which has just one line, the stochastic has two lines that cross each other to indicate when to buy and when to sell.
Conclusion
The stochastic oscillator measures the momentum of a financial instrument, including stock, commodity, and currency pair, by comparing its current close price with the last closing price over a specific period of time. It is a popular and easy-to-interpret indicator used in technical analysis.
The stochastic oscillator is typically represented by two lines, one of which represents the most recent closing price and the other the average closing price for the period. The oscillator then oscillates between 0 and 100, with readings over 80 indicating an overbought security and values under 20 suggesting an oversold security.
This momentum indicator may be customized to fit different trading strategies, and traders should utilize its signals in conjunction with other indicators or fundamental analysis when making trading decisions.
The stochastic oscillator has been shown to assist savvy traders in understanding market trends and spotting prospective profit chances with careful application, competent information, and the advised conservative strategy.
Backtest Gallery
Stop Guessing. Start Validating. Don’t rely on hunches when you can have data-driven confidence.
Explore the real-world performance of the Stochastic Oscillator in our pre-built Backtest Gallery.
We’ve already run the numbers for you, with over 8M backtested strategies on US stocks and ETFs.
See how this powerful indicator performs by viewing the full Stochastic backtest results for SPY or the detailed Stochastic strategy report for GLD. Make your next trade with conviction.


