

The technical analysis indicator known as Stoch, or stochastic oscillator, is used to measure the momentum of a financial instrument like a stock, currency, or commodity. Traders use the stochastic oscillator to spot possible market turning points and decide when to buy and sell.
An unexpected or random process is called a stochastic process. The term is frequently used to describe processes in mathematics, physics, finance, and economics where future results cannot be known with confidence. The term is frequently used in the context of finance to refer to how stock values fluctuate. Stock prices are affected by a variety of unpredictable factors, including news events, market mood, and economic data.
The stochastic oscillator, what it is, and how it works, will be discussed in the following blog post. How to recognize chart indications, explain those data, and use the stochastic oscillator, as well as the advantages and disadvantages of this technical analysis tool, are also covered. Let’s get started.
What is a stochastic oscillator?
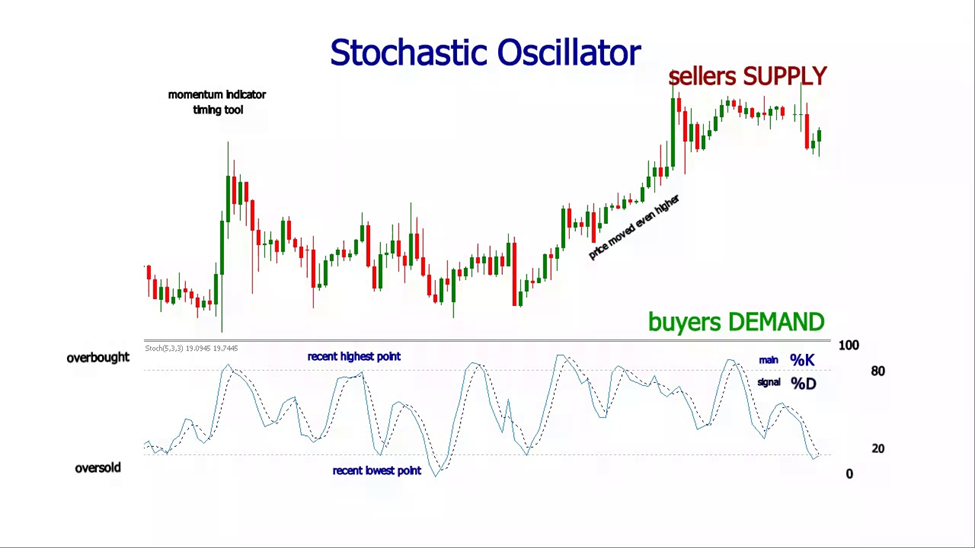
Technical analysts utilize the stochastic oscillator, a momentum indicator, to identify overbought and oversold levels in an asset’s price movement. The indicator determines where the price is now relative to the high and low range over a predetermined number of periods, usually 14.
The indicator’s value ranges from 0 to 100; readings above 80 signify an overbought market, while readings below 20 signify an oversold market. Traders can utilize this information to confirm trend strength and make accurate decisions about future trend reversals.
Understanding of stochastic oscillator
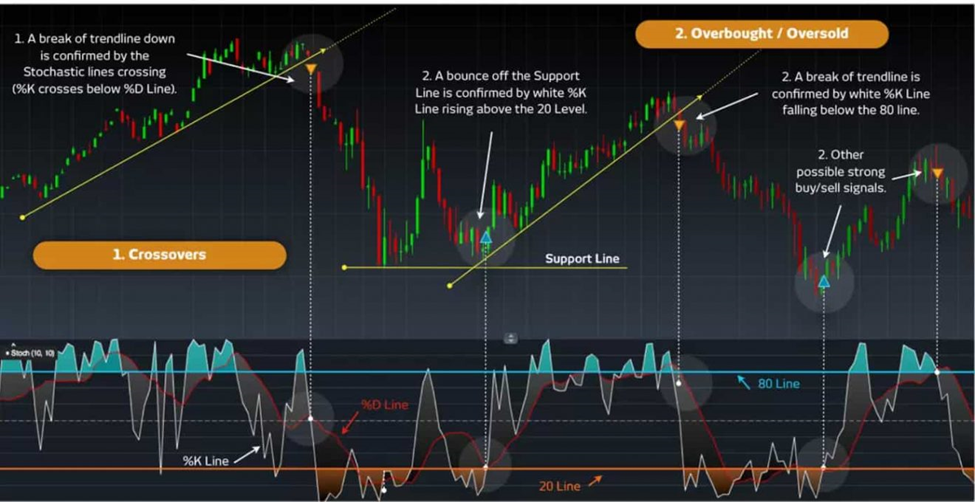
The stochastic oscillator is used by traders to spot possible trend reversals and validate trend strength. As an illustration, the crossing of the %K line over the %D line is regarded as a bullish sign and may signify the beginning of an uptrend.
On the other hand, the crossing of the %K line below the %D line is seen as a bearish indicator and may signify the beginning of a decline.
In order to make informed investment decisions, the stochastic oscillator should be utilized in conjunction with other indicators and chart analysis. It is crucial to keep in mind that this technical analysis tool is just one of several available. Furthermore, the indicator has flaws and generates false signals. To confirm signals produced by the stochastic oscillator, it is always a good idea to keep a watch on market movements and conditions.
Stochastic %K Line
An asset’s Stochastic %K line is calculated by dividing the difference between the asset’s current closing price and the lowest low over a specified period by the difference between the highest high and lowest low over that period.
%K measures the current price as a ratio to its price range over a given time period.
The stochastic %K line is frequently employed to spot potential overbought or oversold levels in a market.
Here is the formula for the %K line:
Stochastics %K = (Current Close – Lowest Low) / (Highest High – Lowest Low),
Where:
the Current Close is the closing price of the recent bar, the Highest High is the maximum closing price for the given period and the Lowest Low is the minimum closing price for the given period.
The calculation’s outcome is typically multiplied by 100 to produce a percentage value, making it simpler to understand. The resulting percentage number will range from 0 to 100. Readings close to 0 denote an oversold state, while readings close to 100 denote an overbought one.
Stochastic %D Line
The Stochastic’s %D line acts as a signal line by generating transaction signals when %K crosses it.
The %D line is calculated by smoothing %K using a simple moving average (SMA).
Here is the formula:
Stochastic %D = SMA of %K over a predetermined number of periods
The default value for the smoothing period is 3.
Two lines, %K and %D, that oscillate between 0 and 100 represent the stochastic oscillator on a chart. The market is seen as overbought, and a potential sell signal is issued when the %K line crosses 80.
On the other hand, the market is thought to be oversold, and a potential buy signal is produced when the %K line falls below 20. Bullish and bearish divergences between the price and the oscillator can also produce extra trade signals. The %D line is frequently utilized as a trigger for trading signals.
How Does the Stochastic Oscillator Work
The stochastic indicator is a technical analysis tool used in finance to determine if an instrument is overbought or oversold. It is calculated based on the closing price of the instrument and its high-low range over a given period, typically 14 periods.
When the indicator value is high, it signals that the price closed near the top of the range, and when it is low, it signals that the price closed near the bottom. It is used to predict trend reversals and identify overbought and oversold readings.
How to Read the Stochastic Oscillator
The stochastic oscillator can be used for indicating security overbought or oversold market conditions or indicating a security trend direction.
When the stochastic’s reading is above 80, the security is trading close to the high end of its high-low range, which means overbought market condition. If the reading falls below 20, the security is trading close to the low end of its high-low range, which means oversold market condition.
When the stochastic’s reading is greater than 50, a security price is in the uptrend. When the reading falls below 50, it indicates that security is in a downtrend.
A trend reversal can be predicted using overbought and oversold states. When the indicator indicates an overbought state, it is a sign of uptrend reversal. When the indicator indicates an oversold state, it is a sign of a downtrend reversal.
Traders search for divergence as well. When this occurs, the stochastic trendline and the price trendline diverge from one another. This could indicate that a pricing trend is weakening and is about to reverse.
How to use the Stochastic Oscillator in Trading Strategies
In a basic overbought/oversold strategy, buy signals are looked for when the stochastic oscillator has been below 20 and then rises above 20; sell signals are looked for when the stochastic oscillator has been above 80 and then declines below 80. However, overbought and oversold conditions can continue for some time and are not always predictive of a price change. It is crucial to consider other factors before making a trade decision.
Divergence strategy
By comparing the direction of the price and the stochastic indicator, traders using the stochastic divergence strategy can spot possible reversals in an instrument’s price trend.
When an asset’s price makes a lower low but the stochastic indicator produces a higher low, this is referred to as a “bullish divergence” and suggests that momentum may be shifting from downward to upward. Bullish divergence is also known as “positive divergence signals.”
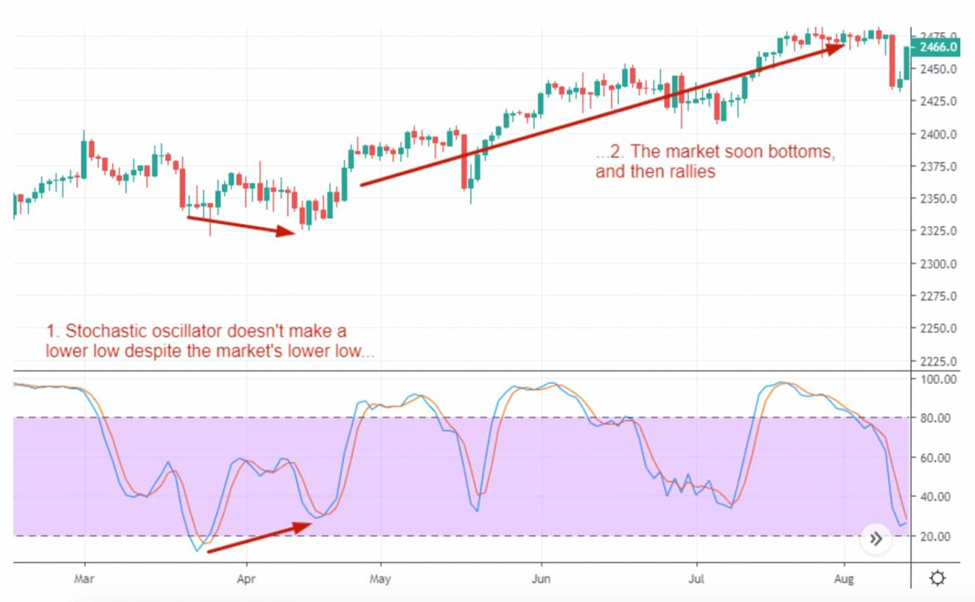
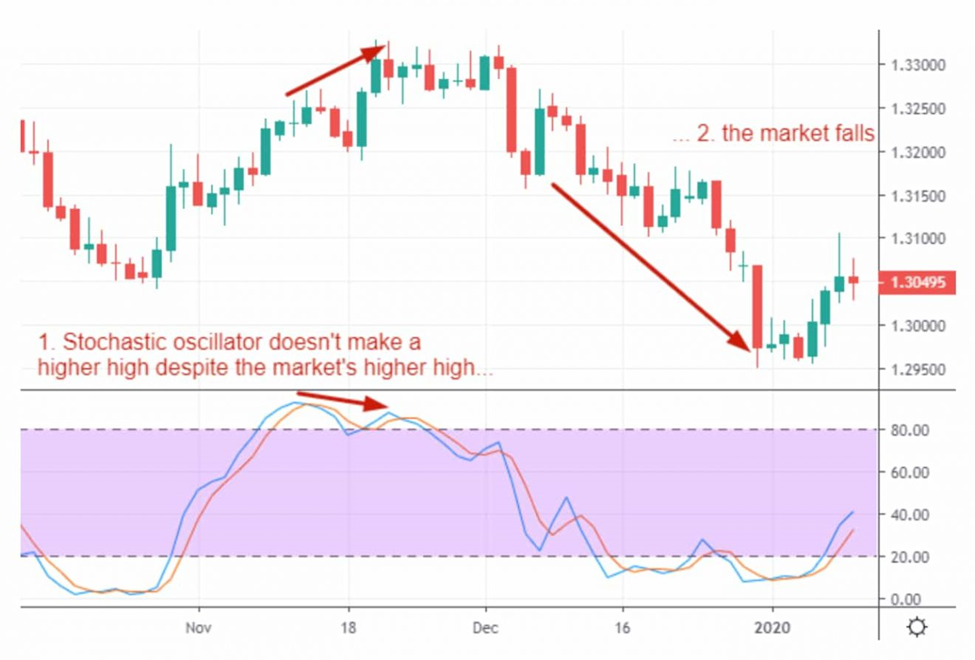
On the other side, a bearish divergence happens when an asset’s price reaches a higher high but the stochastic indicator reaches a lower high, perhaps signaling a change in momentum from upward to downward. Bearish divergence is also known as “negative divergence signals.”
It is crucial to remember that trades should not be executed until a price turnaround confirms the divergence. Divergence is a less reliable trading indicator since an asset’s price may still move in a particular direction while it is taking place.
Additionally, traders must be careful of false signals generated by the stochastic indicator, especially during choppy market conditions.
Stochastic crossover strategy
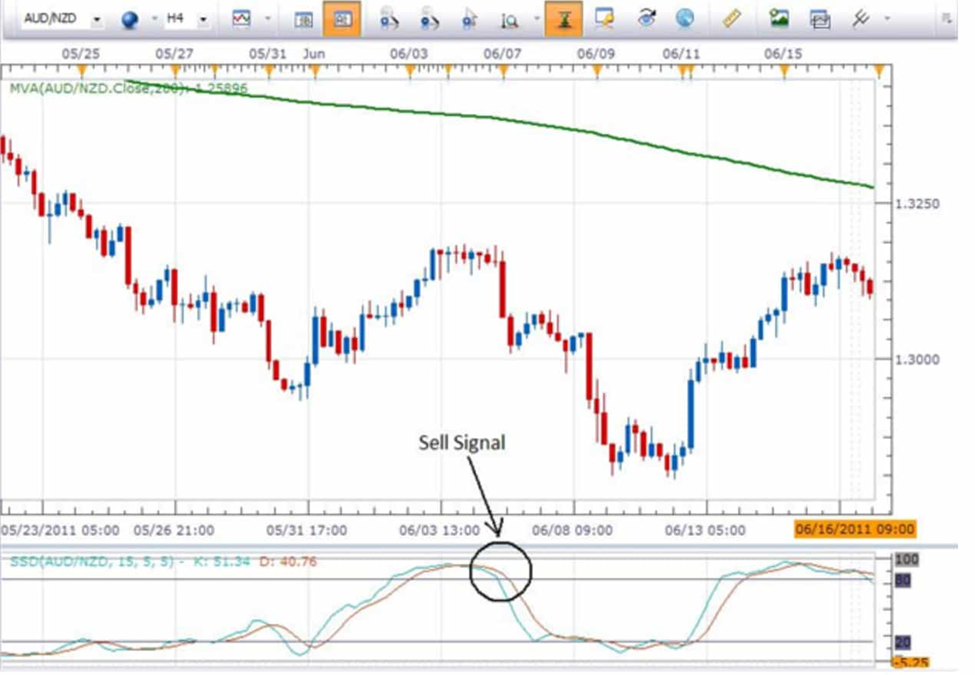
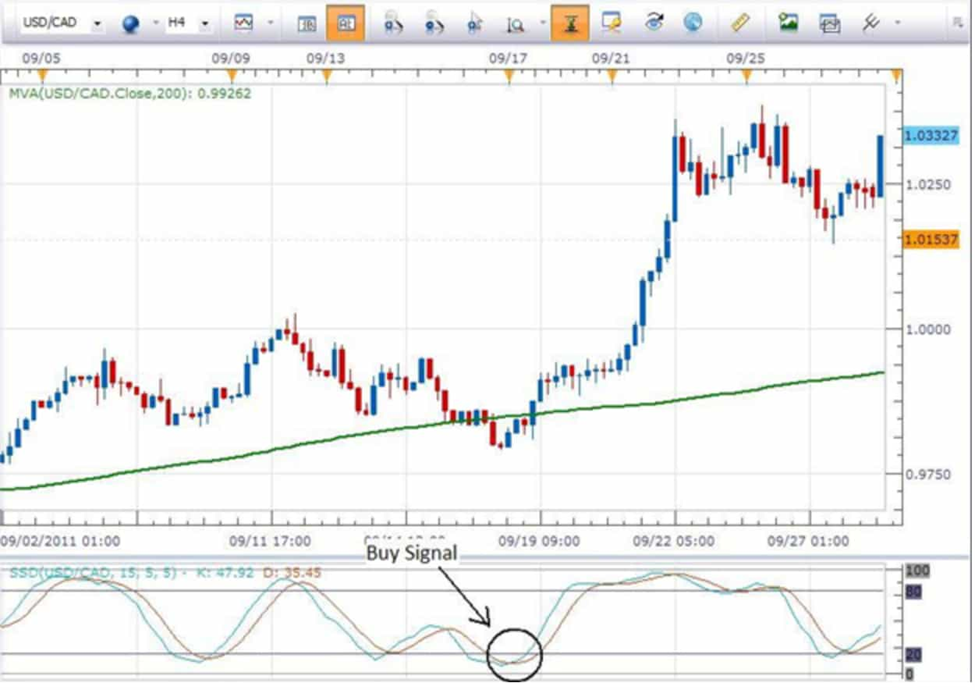
The strategy involves monitoring two lines, %K and %D, and generating buy and sell signals based on their crossover in overbought or oversold regions. A crossover of the increasing %K line above the %D line in an oversold region generates a buy signal, while a crossover of the decreasing %K line below the %D line in an overbought region generates a sell signal.
The signals are more reliable in a range-bound market and less reliable in a trending market. In a trend-following strategy, traders monitor the stochastic indicator to ensure it stays crossed in the same direction, indicating a valid trend.
Bull/bear Strategy
The stochastic bull/bear strategy uses the stochastic indicator to identify potential bullish or bearish trade setups. A bullish trade setup is indicated when the stochastic indicator makes a higher high while the price makes a lower high, indicating increasing momentum and a potential rise in price. Traders often look to buy after a pullback.
A bearish trading setup is indicated by the stochastic indicator making a lower low while the price makes a higher low, signaling increasing selling pressure and a potential drop in price. Traders often look to sell after a brief rebound in price. However, it is important to note that the stochastic indicator can generate false signals, particularly in choppy market conditions.
Advantages and disadvantages of the stochastic oscillator
Like most other technical analysis tools, the stochastic oscillator has its own unique combination of advantages and disadvantages. Understanding where this momentum indicator works and where it does not is essential for maximizing its potential.
Stochastic Oscillator advantages:
● simple to use and understand.
● can be used to determine overbought and oversold levels as well as possible trend reversals.
● can be used in a variety of markets and periods.
Stochastic Oscillator drawbacks:
● can generate false signals in a variety of marketplaces.
● can not be used to forecast absolute price levels.
● Its use is sensitive to subjective interpretation.
It is crucial to keep in mind that the stochastic oscillator, like any other technical indicator, should be utilized in conjunction with other tools and analyses to construct a full trading strategy.
Conclusion
In conclusion, the stochastic indicator is a widely used technical analysis tool in the financial markets. It helps traders identify overbought and oversold conditions, as well as potential entry and exit points. By combining the stochastic indicator with other technical analysis tools such as trendlines, price formations, and support and resistance levels, traders can gain a better understanding of market conditions and make informed trading decisions.
Traders should always use the stochastic indicator in conjunction with other analysis methods to make the most informed decisions.
Hopefully, you now have a fundamental understanding of what a stochastic oscillator is and how it functions.


