


Oscillator indicators are considered an essential component for analyzing a currency pair or any other asset class pertaining to trading and technical analysis. Oscillators, as their name implies, are technical indicators that oscillate between two extreme points in reference to the price of the actual asset. They are used by traders to determine both the direction and the strength or momentum of a movement.
If you’re curious about the best technical oscillator indicators on the market and which one would help spot trade entries and exits, keep reading.
What are the Technical Oscillators?
Technical oscillators are popular tools used in technical analysis to identify possible overbought or oversold conditions of an asset. They are calculated based on the price and/or volume data of an asset, and they generate signals that traders can use to make trading decisions.
Oscillators are based on mathematical formulas that analyze the relationship between the current price and previous prices, and they can provide valuable insights into market trends and potential future price movements.
In most cases, they’re used to identify overbought and oversold levels as well as to confirm trends.
Market analysts have created several popular oscillating indicators. However, not all indicators are made equally, and each serves a unique purpose to offer traders a range of information. A few indicators were created to analyze trending markets, while others were designed to spot trading opportunities in a range-bound market environment.
The difference between successful traders and the rest is in their ability to know which indicator to use and when.
Since markets follow trends, many traders rely on technical indicators to make more accurate price predictions for assets. Being able to time your trades and choose the optimal entry and exit positions demands this critical ability.
Stochastic Oscillator
The Stochastic Oscillator is a well-known indicator that was invented by George Lane. It allows investors and traders to predict price action easily. The reason behind this is it evaluates the closing price of an asset and the price during a certain time but often close to the high-low range during a trend, relying on the occurring trend.
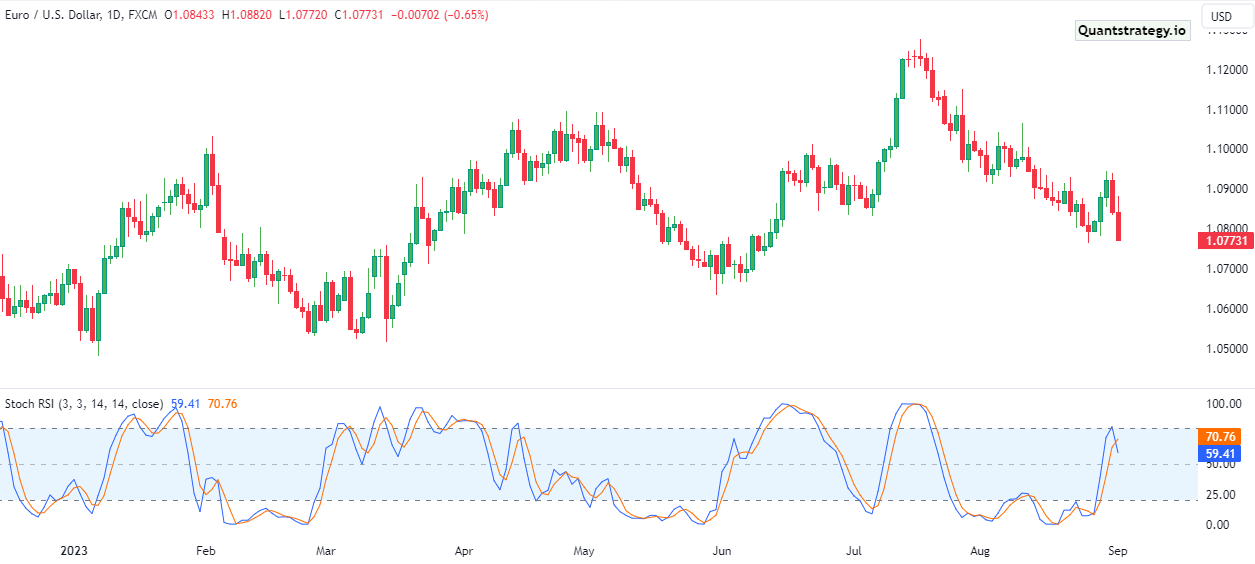
The oscillator indicatively foresees the calculation of whether an asset’s price has been losing momentum, trending, or just hardly trading. Hence, if you’re an experienced trader, you’ll easily read the price movements within the charts. But if you’re new to trading, that’ll take some time to understand as it demands technical analysis.
It has two flowing lines called %K and %D and oscillates between two fixed values i.e. 0 and 100. It has overbought and oversold levels at 80 and 20, respectively. When Stochastic lines are above 80, a strong downtrend possibly follows, and a strong uptrend follows when the lines are below 20.
When using the stochastics, try looking for long entries immediately following a bearish crossover in the oversold level (often below 20). To enter a short position, traders typically use a bullish crossing between %K and %D in the overbought region (typically above 80).
Besides, amid volatile market conditions, stochastics is vulnerable to false signals. To increase the signal’s accuracy, traders can combine this indicator with the moving average (which will be covered in greater detail later).
Relative Strength Index (RSI)
The Relative Strength Index is another popular technical oscillator in the market. It was invented by J. Welles Wilder, a famous expert who also created other indicators, such as the Average True Range (ATR) and the Average Directional Index (ADX).
Just like the Stochastic indicator, the Relative Strength Index oscillates between 0 and 100 fixed values. While both the indicators operate well when pursuing momentum oscillators, Relative Strength Index works well in trending markets when signals exhibit 50 in an overall uptrend.
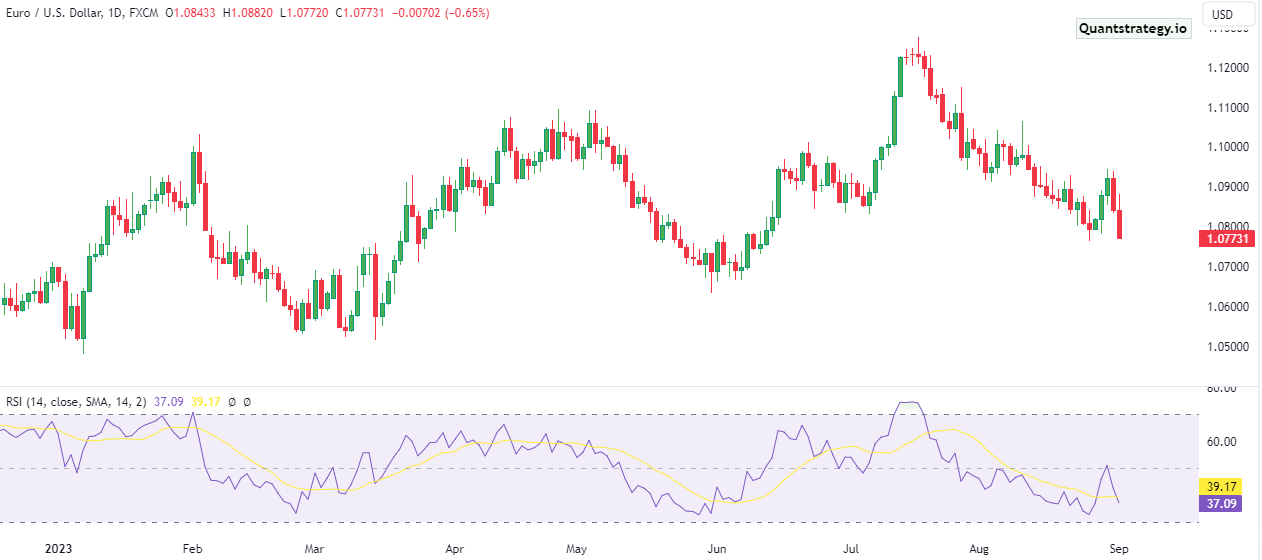
To avail of the RSI for better trading opportunities, try finding potential levels and then progress to enter the markets. Also, at some point, it could be more advantageous to draw two additional lines at 40 and 60 on the RSI screen rather than focusing on level 50, as overbought and oversold levels are usually at 70 in an uptrend and 30 in a downtrend.
Commodity Channel Index (CCI)
Invented by Donald Lambert during the 1970s, Commodity Channel Index (CCI) can be used for trading all forms of markets, including stocks and bonds. While it may appear and feel similar to RSI and Stochastics, the application and the underlying formula is totally different.
As mentioned earlier, RSI oscillates between 0-100, but the CCI does not have any upper or lower limit. Rather, it oscillates between -100 and +100 values. A strong trend possibly follows in an upward direction when it reads above +100, and a possible downtrend follows when its moves below -100.
The simplest way to use CCI for entry opportunities is merging it with price action on the basis of technical analysis, like trend line breakout.
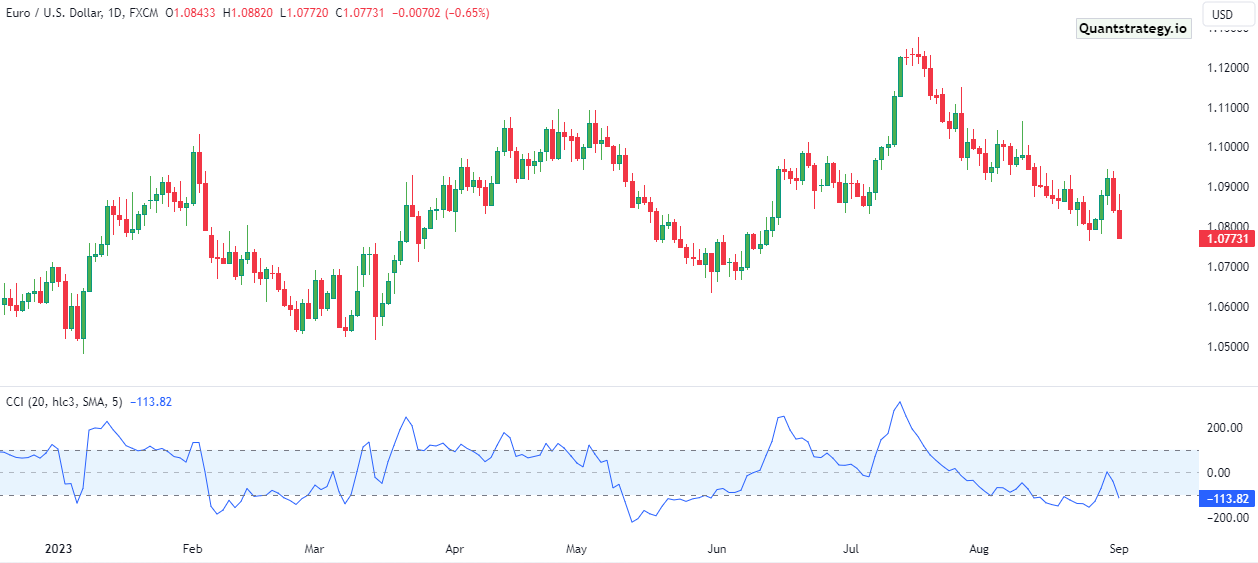
Moreover, you may add multiple time frame analysis, which will make you acquire early opportunities. Besides, it is noteworthy that when signals stay within the normal range, it indicates that there’ll be no strong movement within the market, and the asset’s price is probably not flowing anywhere.
Moving Average Convergence Divergence (MACD)
If the above three oscillators relied on your skill to read line charts, MACD is the complete opposite as it uses the combination of two Moving Average Crossover with a Histogram to measure the strength of the momentum.
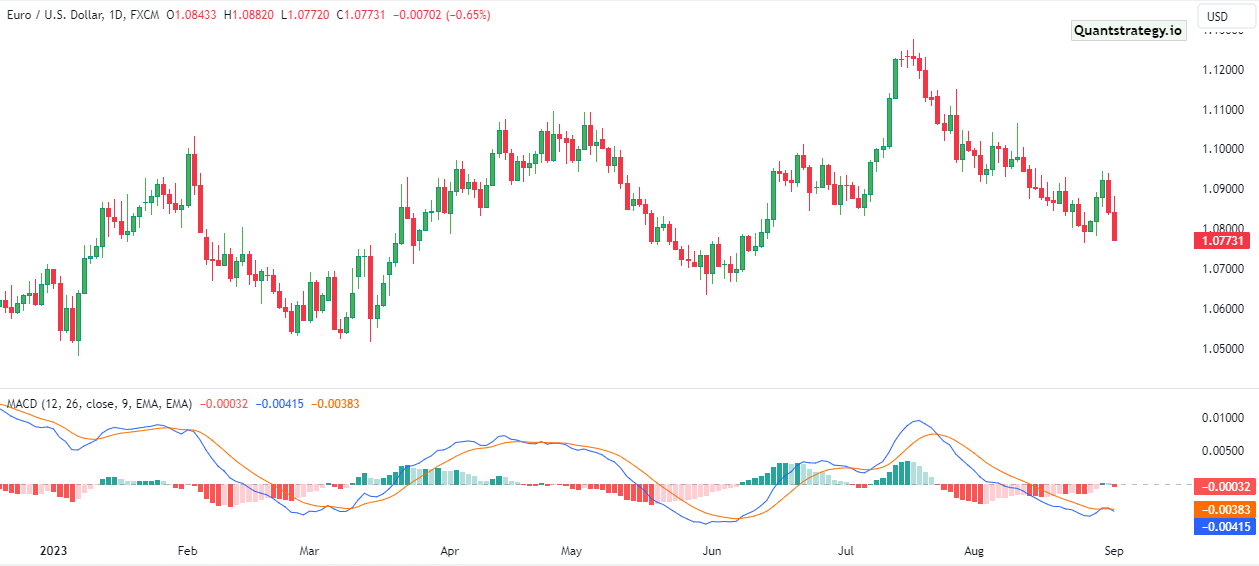
One standard MACD strategy is to look at which size of zero the MACD lines lie in the Histogram below the chart. When the MACD lines are above 0 for a sustained period, the stock is possibly trending upwards. On the other hand, when the MACD lines are below 0 for a sustained period, the trend is possibly downward. Using this strategy, there occur potential buy signals when the MACD trades above 0, and potential sell signals when it moves below 0.
Moreover, signal line crossovers offer additional buy and sell signals as well. MACD consists of two lines i.e. a fast line and a slow line. When the fast line cross and comes above the slow line, a buy signal happens. When the fast line crosses and comes below the slow line, a sell signal happens.
Awesome Oscillator (AO)
Developed by a well-known trader Bill Williams, Awesome Oscillator (AO) was made to gauge the difference between 34 periods Simple Moving Average (SMA) and the latest 5 periods SMA. It is a little similar to MACD as it deploys histograms as well. If the histogram is above 0 and continues moving upward, it indicates that bulls are taking in momentum. But if the histogram is below the zero line and continues moving lower, it indicates that the bearish momentum is overtaking the market. Remember that this isn’t always the scenario, as Awesome Oscillator can still give false signals.
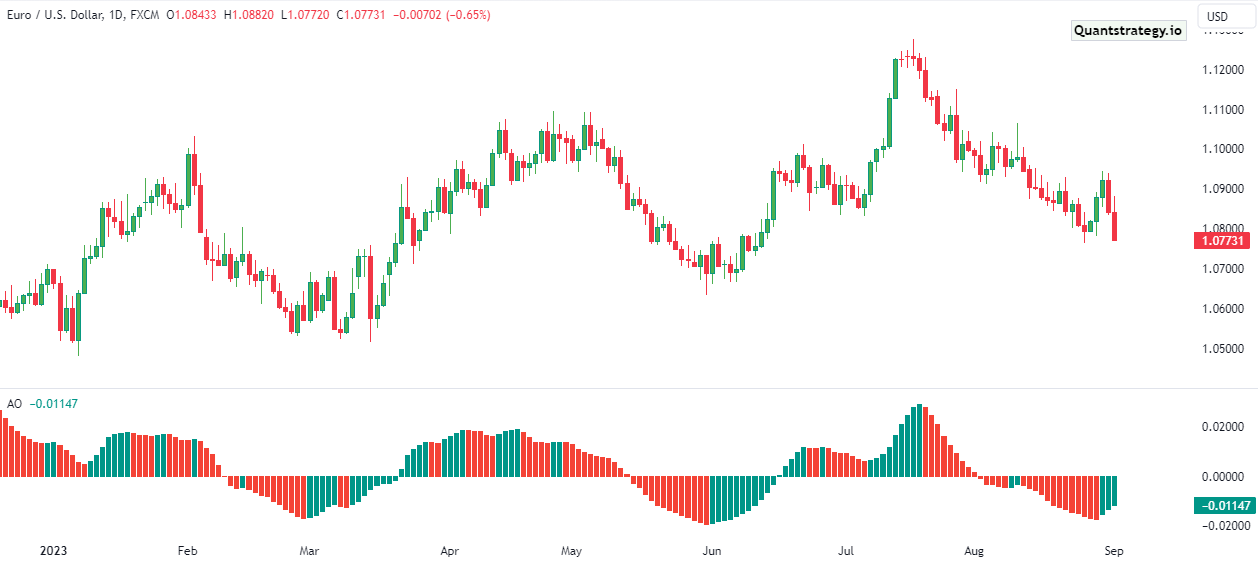
If you want to utilize AO for trading, try operating it by employing the comparison between two tops of the oscillator and the price. It will exhibit divergence signals for identifying entry chances when the price alters.
Additionally, wait till AO’s histogram goes below or above 0 in order to confirm signals. For example, after a bearish divergence where the double top of the price reveals higher highs while the indicator forms lower highs, it is better to wait till the histogram goes below zero before placing a sell order.
Williams %R
Williams %R is a popular technical oscillator that measures the current closing price of an asset relative to its high-low range over a specified period of time, typically 14 days.
This oscillator is a momentum indicator that oscillates between 0 and -100, with readings above -20 indicating an overbought condition, and readings below -80 indicating an oversold condition.
Traders can use Williams %R to identify potential trend reversals and overbought/oversold conditions.
Williams %R oscillator generates buy and sell signals based on the overbought and oversold conditions it detects. When the oscillator reading crosses above the -80 level, it indicates that the asset is oversold and a potential buying opportunity may be present.
Conversely, when the oscillator reading crosses below the -20 level, it indicates that the asset is overbought and a potential selling opportunity may be present.
Traders may look for divergences between the oscillator readings and the price action, or use multiple time frames to confirm the signals. They may also use other technical indicators and chart patterns to support the Williams %R signal, such as trendlines, moving averages, or candlestick patterns.
Average Directional Index (ADX)
The Average Directional Index (ADX) is a popular technical oscillator used to measure the strength of a trend in an asset’s price movement. It is a non-directional indicator, meaning it does not indicate the direction of the trend, but rather the strength of the trend.
The ADX is calculated by taking the difference between two directional indicators, the positive directional indicator (+DI) and the negative directional indicator (-DI), and dividing by the sum of the two. The resulting value oscillates between 0 and 100, with higher values indicating a stronger trend.
Traders use the ADX to identify whether a trend is strong or weak, and to help determine when to enter or exit a position.
Generally, a reading above 25 indicates a strong trend, while a reading below 20 indicates a weak trend. Traders may also look for crossovers between the +DI and -DI indicators, which may indicate a change in the trend direction.
In addition to using the ADX to identify trends, traders may also use it in conjunction with other technical indicators and chart patterns to confirm their trading signals.
Momentum Oscillator
The Momentum Oscillator is a popular technical indicator used to measure the rate of change in an asset’s price movement over a specified period of time.
It is calculated by subtracting the closing price from the closing price n periods ago, and plotting the result as a line on a chart. The oscillator value can range from positive to negative, with positive values indicating upward momentum and negative values indicating downward momentum.
Traders use the Momentum Oscillator to identify potential trend reversals, overbought or oversold conditions, and to confirm other technical indicators. For example, if the oscillator reading is increasing while the price is also increasing, it may indicate that the trend is likely to continue.
However, if the oscillator reading is decreasing while the price is still increasing, it may indicate that the trend is weakening and a reversal may be imminent.
On-Balance Volume
On-Balance Volume (OBV) is a popular technical indicator used to measure the cumulative buying and selling pressure in an asset’s price movement over time.
It is calculated by adding the volume of a given period to a running total if the asset’s price closes higher than the previous period’s close, or subtracting the volume from the running total if the asset’s price closes lower than the previous period’s close. The resulting line oscillates around a zero line, and traders use it to identify trends in buying and selling pressure.
Traders use the OBV to confirm trends and identify potential trend reversals. For example, if the price of an asset is trending upwards, and the OBV line is also trending upwards, it may indicate that there is a strong buying pressure and the trend is likely to continue.
However, if the price is trending downwards, and the OBV line is trending upwards, it may indicate that there is a potential trend reversal.
In addition to using the OBV to identify trends, traders may also use it in conjunction with other technical indicators and chart patterns to confirm their trading signals. For example, they may use moving averages, trendlines, or support and resistance levels to confirm the OBV signal before entering or exiting a position.
Conclusion
The direction and momentum of the directional movement of an asset’s price are easily determined by oscillator indicators. However, even the most seasoned technical traders would find it excessively risky to use a single oscillator to spot market entries and exits. Instead, before placing any trades, it is recommended to combine one of the 5 best technical oscillators we covered above with price movements, such as candlestick patterns or breakouts, to confirm and improve your investing experience.


