

In the simplest form, trend lines are responsible to show connection among multiple prices or explain data in the best possible way. The resultants so received are then used to land on a decision as to whether traders have to proceed with a particular trade or not.
In other words, trend lines are capable of providing a direction to traders for investment purposes. Traders have to draw trend lines below pivot lows or above pivot highs to demonstrate prevailing price action. These recognizable lines show the speed and direction of prices and explain patterns during price contractions.
What Do Trend Lines Tell?
Trend lines have been one of the crucial tools in technical analysis. Analysts use trend lines to identify the prevailing trend in a market and potential areas of support and resistance. Instead of working on past business data, analysts prefer to look at the trend lines to know the price action.
Moreover, these lines are responsible to demonstrate current price movements and let analysts figure out whether the trend is showing favorable conditions or not.
How Do Trend Lines Work?
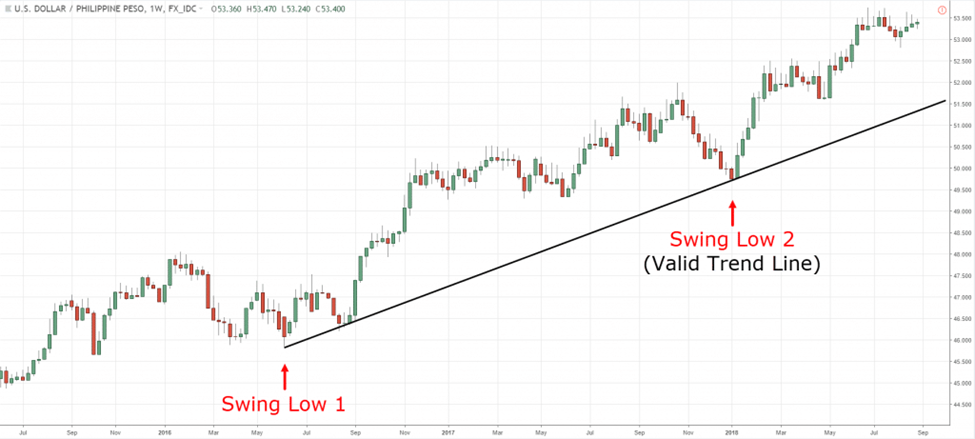
Traditionally, trend lines are the straight lines that are drawn among a series of swing lows or swing highs.
To create an uptrend line, a straight line is drawn on swing lows while for downtrend lines, swing highs are used. The resultant of these lines show either resistance to the downtrend or support for an uptrend.
Analysts have given a new name to these trend lines- Dynamic Support & Resistance- that show price trends and their movement within a specified time period.
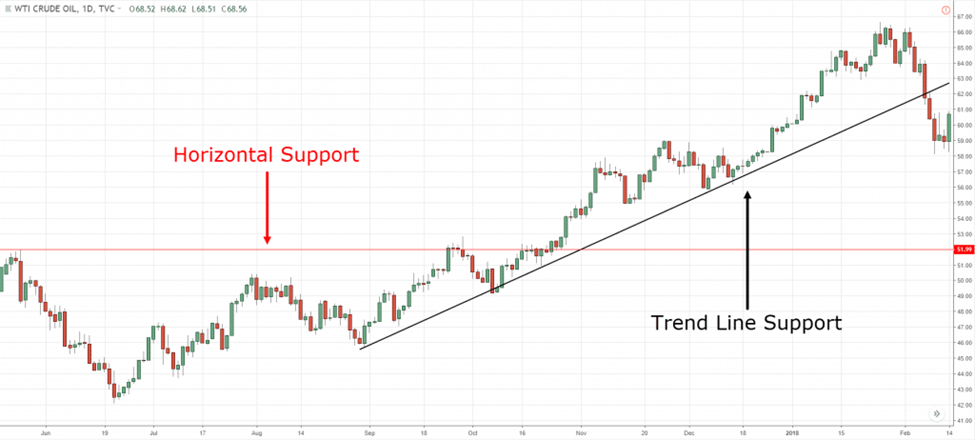
Even though a trend line is similar to support and resistance in terms of explaining potential trade, there is still one major difference that no trader can ignore- support and resistance lines are horizontal while trend lines are sloping.
The following image may make the fact clearer:
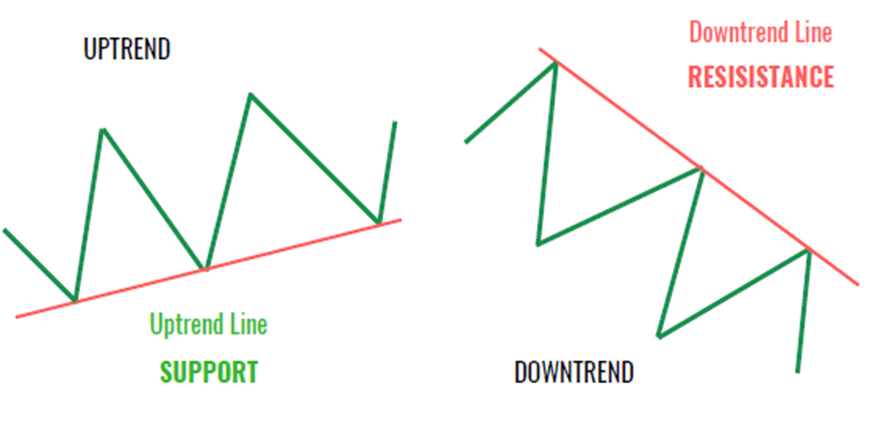
With that being said, upward and downward trend lines can be defined as:
-
Upward Trend line: A straight line with a positive slope on the price chart showing an upward buying trend.
-
Downward Trend line: A straight line with a negative slope the chart showing a downward buying trend.
How to Draw a Trend Line?
To create a trend line, there must be at least 2 points on the trading chart with certain time frames- that may either be on minutes, daily or weekly basis.
However, some technical analysts prefer to analyze data without these time frames. They usually go for trends based on tick intervals instead of time intervals. The best part about these trend lines is their usability irrespective of the time frame, time period or interval. They are always helpful to identify trading trends.
Tips to Draw A Trend Line Correctly
While a trend line is an easy technical tool, some beginner traders still don’t know how to draw trend lines properly on the trading chart. For those, below are some pro tips to follow:
-
Work on the main swing points and stay focused. Ignore the rest.
-
Must connect at least 2 points with a straight line.
-
Make adjustments to make the most touches (be it wick or body).
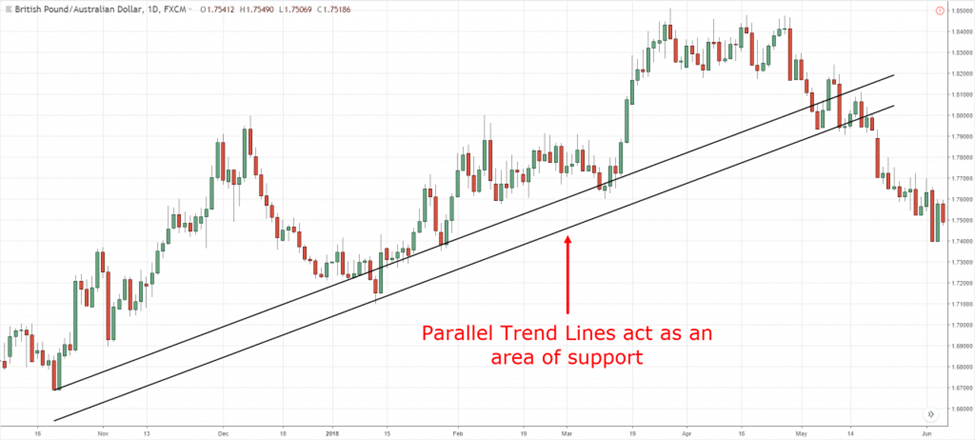
Advice:
Traders can use two trend lines to analyze the area on the price charts. The lines should be parallel.
Trend lines always need ‘adjustments,’ unlike support and resistance levels. The reason behind this is price change or price break that recovers afterward and requires adjustments to work as per the current price action.
How to Use a Trend Line in Trading?
Trend lines have always been the best tool to judge price points. They help to land on a point where the price:
-
Shows support for reactions
-
Meets resistance on rallies
-
Demonstrate overbought and oversold levels in the trend channel
Trend lines are also capable of forecasting the possibilities of trend change before it occurs. The violation of trend lines often signifies exhaustion in the force of supply or demand. This means either the price action is changing its progress rate or there is a potential trend reversal.
Whatever the strategy, a trend line is interpreted as:
-
When the trend is up and the price lies above the uptrend line, it is a bullish condition.
-
When the trend is down and the price lies below the downtrend line, it is a bearish condition.
Trend Line Trading Strategy
A market with stable performance and a steady trend shouldn’t be the only factor for traders to make an entry. Rather, they have to evaluate the trend, its performance over a couple of months, and conditions behind its break and stride changes followed by the market’s penetration ability for the respective trend.
Trend Lines Trading Strategies
Trend Following
A strategy that directs traders to invest when the price increases and exit when it starts to decrease. One of the finest trading methods to determine the overall price trend is to look at the uptrend line. Similarly, to examine a downtrend, it’s crucial to look at the downtrend line.
Steps to Follow:
-
Identify a trend by connecting highs and lows- either with tools/indicators or manually.
-
Connect at least 2 points on the trading chart.
-
Check if the price forms higher lows and higher highs, showing an uptrend or vice versa.
-
Observe price movement and see where the breakout happen i.e. limitation on price from the upside or downside.
-
Create a trading plan accordingly.
Countertrend Trading
Countertrend trading is a strategy that involves taking trades that go against the prevailing trend in the market. Trading countertrends can be risky, but it can also be rewarding if executed correctly.
Steps to Follow:
-
Identify the trend: The first step is to identify the prevailing trend in the market. This can be done by drawing a trend line connecting the lows or highs of the price movement over some time.
-
Identify the countertrend move: Once you have identified the trend, you can look for a countertrend move. A countertrend move is a move in the opposite direction of the prevailing trend.
-
Draw a trend line: Once you have identified the countertrend move, you can draw a trend line to identify potential areas of support or resistance. If the countertrend move is down, you can draw an uptrend line connecting the lows of the price movement. If the countertrend move is up, you can draw a downtrend line connecting the highs of the price movement.
-
Wait for the bounce: Once you have drawn the trend line, you can wait for the price to bounce off the trend line. This means that the price touches the trend line and then reverses direction, moving back in the opposite direction of the prevailing trend.
-
Enter the trade: Once the price has bounced off the trend line, you can enter a trade in countertrend direction.
-
Set your stop loss and take profit levels: It’s essential to set your stop loss and take profit levels to manage your risk and maximize your profits. Your stop loss should be placed below the support level (for long trades) or above the resistance level (for short trades), while your take profit level should be set at a level that provides a favorable risk-reward ratio.
A countertrend strategy is beneficial for short-term traders who want to earn returns within a short time period.
Trend Line Bounce
This strategy focuses on proceeding with a trend that works on trend lines. Traders can decide to buy at the uptrend or sell close to the downtrend.
Steps to Follow:
-
Create a price trend- sideways, up, or down.
-
Connect at least 3 swing points to draw a trend line.
-
Expand the trend line to future forecasts.
-
Wait until the price reaches the trend line on different conditions.
-
Adjust price and limit orders on the trend line.
-
As soon as the price touches the trend line, make an entry and trade in direction of the trend.
-
Identify the previous swing low and put a stop-loss order on an uptrend or vice versa.
-
Set profit at a 2:1 ratio (minimum) as the stop loss’s size.
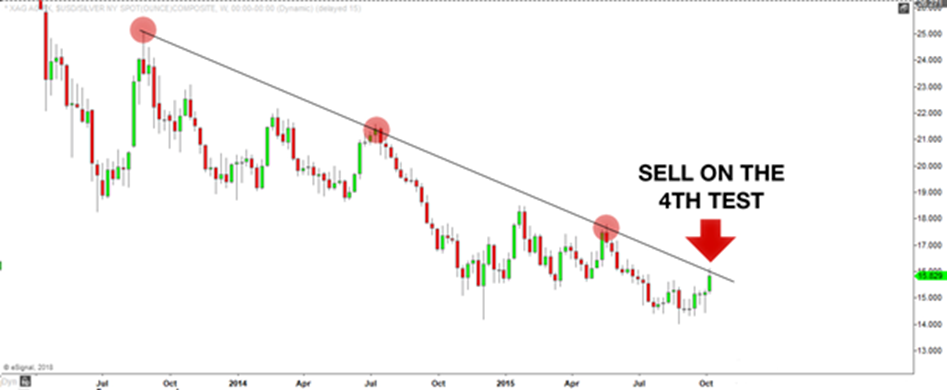
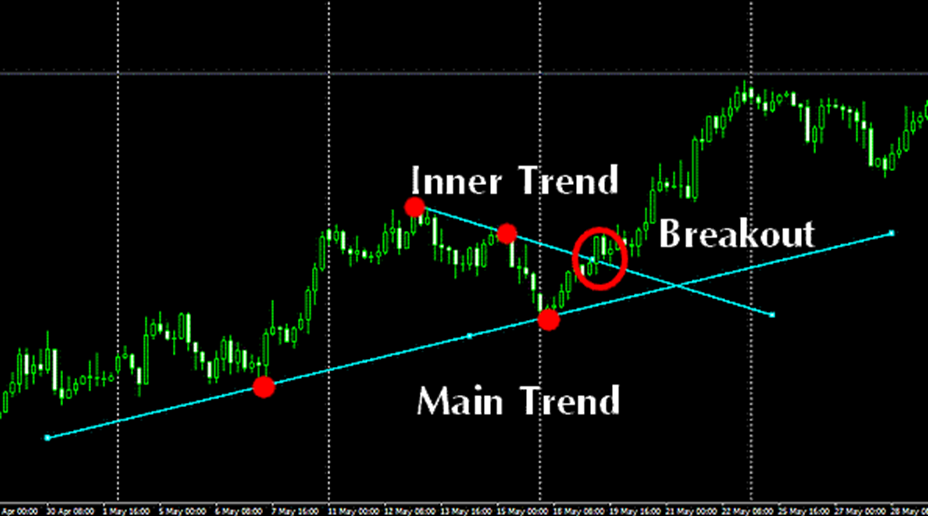
Trend Line Breakout
Referred to as a type of countertrend trading, the trend line breakout can play a significant role in trade decisions. Traders have to figure out how a trend line breaks and how it would work as a trend-following strategy.
To do so, they have to follow these steps:
-
Create a long-term trend.
-
Check and respond as soon as the price goes against the trend or corrects itself.
-
Create a trend line to show the short-term correction.
-
See when the price breaks out after it crosses the trend line.
-
Decide to sell at the uptrend break or buy at the downtrend break.
-
Place a stop order after the trend line for a breakout.
-
Create a take profit order at a 2:1 ratio (at least) as the size of stop loss.
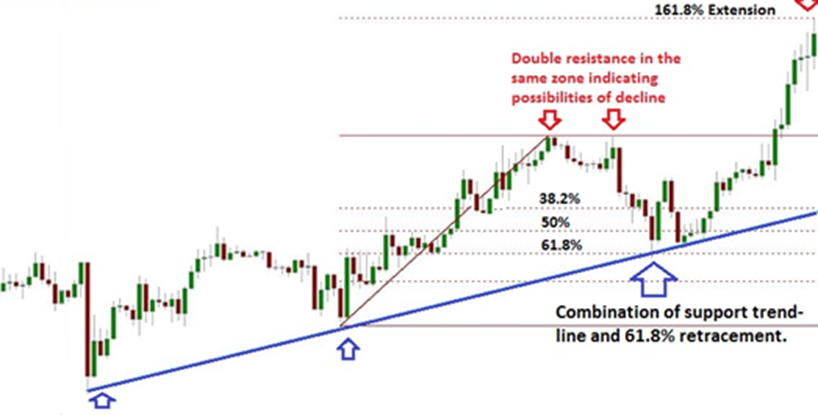
Trend Line with Confluence
Even though trend lines have emerged as one of the most reliable technical tools, none could claim to be 100% accurate when it comes to making predictions for future trading trends. Traders can always rely upon these technical indicators to increase their success probability but, there is another side of the matter as well!
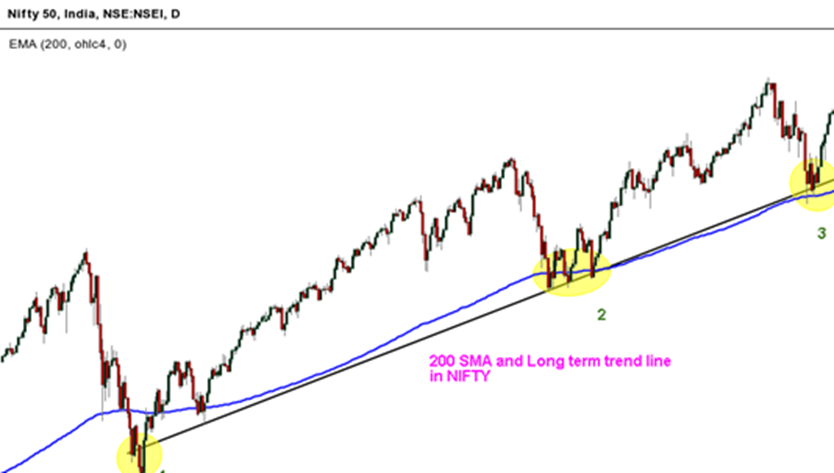
However, experts suggest combining two or more technical tools to identify better opportunities in trading. Some of such analysis techniques are:
-
Trend lines and Fibonacci Retracement: Traders may decide to buy an asset at rising trend lines, which the 61.8% Fibonacci Level also approves.
-
Trend lines and Moving Averages (MA): In the below chart, the rising trend line corresponds with the 200-day moving average.
-
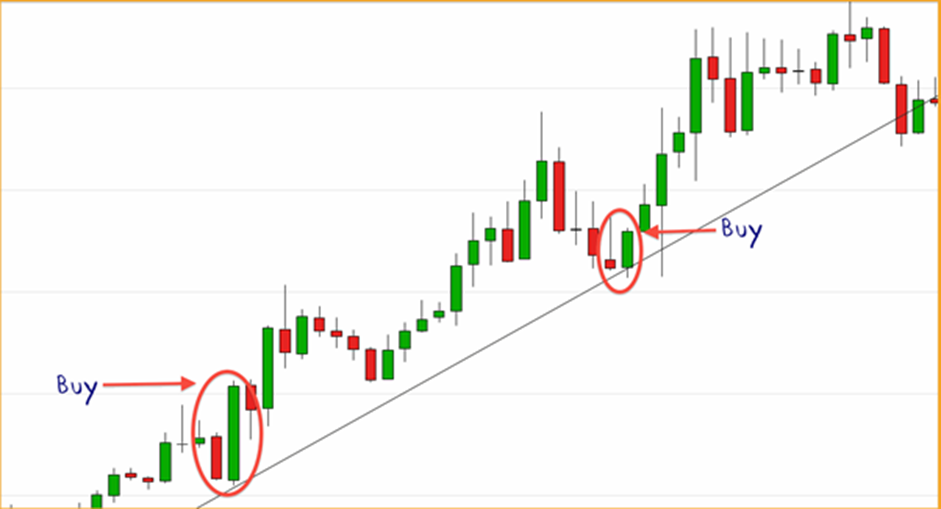
Trend lines and Japanese Candlesticks: Bullish candle patterns confirm trends followed by the trend line bounce.
Conclusion
In summation, it can be said that trend lines have changed how traders can examine the prevailing trading situations and make their decisions. They brought a huge improvement in trading analysis that none of the other technical indicators can do.


