

One of the essentials to understanding price movement in day trading is researching volume trends. This is where the role of the Ease of Movement Indicator comes in.
Since volatility and volume go together, traders require sufficient volatility to lock in big profits. However, in volatile markets, price and volume sometimes become unconnected, which can generate opportunities for trading.
While many volume-based indicators attempt to gauge the relationship between price and volume, such as VWAP (volume weighted average price), accumulation and distribution, and money flow index, ease of movement is a lesser-known volume-based indicator that strives to compress the price and volume volatility into one number with defined buy and sell signals.
What is the Ease of Movement Indicator?
The ease of Movement (EOM) Indicator, also called the Ease of Movement Value (EMV) Indicator, was developed by an American mathematician named Richard Arms. It aims to demonstrate the relationship between the price and volume of an asset. These are generally the most useful features of the financial market.
Moreover, as the name implies, the larger the indicator’s magnitude, the easier the price action and the more strong the trend is considered to be.
Large positive value signals price rising upward at disproportionately low volume. On the other hand, a large negative value signals price going downward at a disproportionately low volume. Hence, the EMV indicator is used to get information about how much volume is required to trigger price movement.
The Ease of Movement indicator value of more than zero signifies that the asset is getting purchased or ‘accumulated’ in the technical analysis language. A value below zero usually signifies that the asset is getting sold or ‘distributed’.
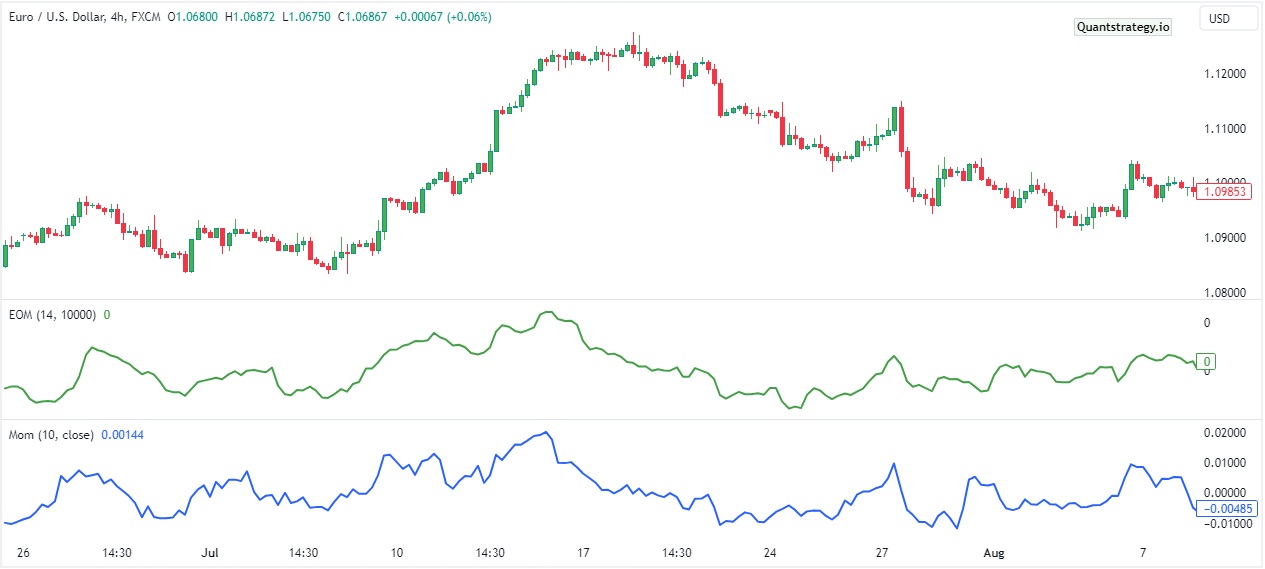
The illustration below depicts two indicators applied to the EUR/USD pair. The momentum is colored blue and EOM in green, and it can be seen that both look very similar.
While the Ease of Movement is a highly effective indicator, by default, it isn’t provided in the some trading terminals. It can always be downloaded for free from any authentic online source.
Moreover, like all other indicators, this indicator is calculated by combining various mathematical concepts, which we will cover next.
Calculating the Ease of Movement
The calculation of ease of movement comprises three parts.
- First step involves calculating the distance of the asset price movement.Distance is calculated by comparing the current midpoint of the period with the midpoint of prior period.
Distance moved = (High + Low)/ 2 – (Previous High + Previous Low)/ 2
- The next step involves calculating the box ratio.Box Ratio = (Volume / X) / (High – Low)
Where X is some integer used to generate a ‘relevant’ number for a ratio that is neither too big nor too small. Arms recommended using a volume of 100 million with other numbers.
- A single period EOM is calculated by dividing the distance computed in the first step with the box ratio.Single-Period Ease of Movement = Distance / Box Ratio
When the EOM indicator generates output values above zero and increasing, this recommends that the price is rising on low volume, while declining negative values recommend that the price is decreasing on low volume.
Some Special Considerations
Some traders prefer adding a moving average to the ease of movement line and deploying it as a trigger line for producing trading signals. They may also find areas of convergence and divergence between the Ease of Movement and price and use it as an indicator for forthcoming reversals.
Since the calculation of EOM results in a line that closely resembles a rate of change indicator or momentum, the EMV indicator and volume-weighted momentum line can be considered alike. Comparing the Momentum Indicator and EOM can provide useful insight into the effect of volume over price.
The majority of traders use the Ease of Movement Indicator conjointly with other forms of technical analysis, which include both chart patterns and technical indicators, to increase their probability of success. For instance, a trader may buy the stock following its break out from a particular price point when he notices a bullish reversal chart pattern and sees that EOM is improving instead of depending solely on the indicator.
Reading the Ease of Movement Indicator
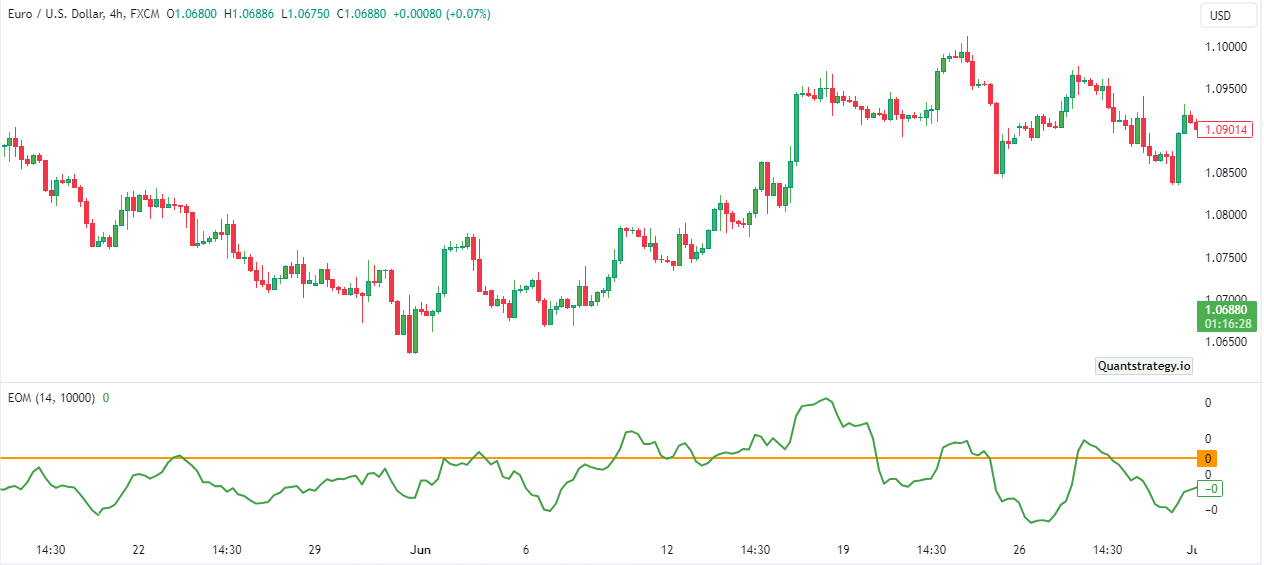
The EOM indicator fluctuates around a neutral line. A good way to use it is by drawing a horizontal line, as shown in the chart below.
When the ease of movement is above the neutral line, the price asset is advancing with ease – the higher the value, the greater the ease.
Conversely, when the ease of movement is below the neutral line, the price asset declines with ease.
Trading with the Ease of Movement Indicator
Although the steps for calculating the EMV indicator are relatively long and complex, using it is relatively simple. It is quite similar to the way other indicators are employed.
Opening a Position
The reality is that the EOM indicator isn’t a self-supporting trading tool. It is commonly combined with volume. As the EOM is obtained from a volume activity, the volume’s a useful tool for validating trading signals.
The picture below is a 5-minute Twitter chart from 28-29 October 2015 that demonstrates the way to confirm a setup before trade entry.
EOM Trading Signal
in the above chart, we can notice a gap that leads to huge downward pressure on the ease of movement below the line. This bearish move acts as a warning for investors finding an entry in long positions. In spite of this negative price movement, after around 15 periods, the EOM crosses above the line.
The noteworthy thing here is as the price breaks out, the volume starts increasing as well. This bullish price movement, together with powerful trading volume, presents a superb opportunity to set up a long position.
As the bullish move comes to an end, the EOM starts creating lower highs with every subsequent rally and becomes closer to the zero line. Besides, volumes continue to decline with every trading period.
Luckily for traders, once there’s a bearish cross of the ease of movement below the zero line with risen volume, they can use this chance to exit the long position and become short.
They open their short position and can go back down for one more round of profitable gains.
Exit Signal
Now we know when a trader can enter a trade with the ease of movement indicator, however, does the indicator offer correct exit signals as well?
As mentioned earlier, the EOM isn’t a self-supporting trading indicator, and the volume indicator is only useful to confirm signals but not for informing when to enter or exit a trade.
So this brings us to two options:
- Keeping it simple:
The option of doing nothing can always be considered in any decision-making process. This option recommends the traders exit positions whenever the EOM indicator breaks the line against the primary trend.
- Adding a Moving Average:
Using moving averages is a classic way to exit trades. Once the price asset closes opposite to the moving average, the position must be closed.
More importantly, a trader’s risk appetite will control the number of the period they use while configuring the moving average (which are 5, 10, and 20).
The below image of a 15-minute Facebook chart from October 8 to 14, 2015, shows the trading example for this option.

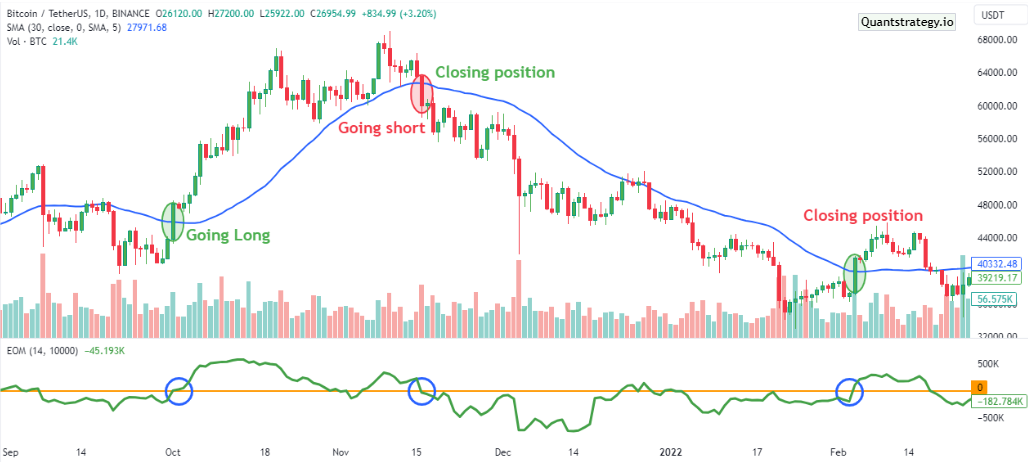
EOM with SMA
The red circle in the chart above denotes when a trader exits the market, and the green circle denotes the exits.
The first trade signal occurred following the confirmation of the price closing above the SMA, double bottom, the EOM moving above zero, and increased volume. This presents four confirmed points and depicts market harmony.
Traders go long on this trading signal and experience a nice run-up on several trading periods. Facebook has a considerable gap below the SMA when markets open on 13 October 2015. As a result, the traders stuck to their strategy exit on their long position.
Let’s consider another example of a short trade.
EOM Short Trade
We have a 5-minute Microsoft chart above from 21-22 October 2015.
The first position is short and is determined by a close below the SMA and a decline of the EOM below zero.
At this time, the volumes are relatively low. Still, the traders decide to go short as they receive a bearish confirmation from the asset’s price closing below 30-SMA.
Besides, the price movement commences a sharp bearish drop with a small test of the 30-SMA before resuming the downward trend.
It isn’t till the market sharply shoots higher with volume do the traders exit their position and go long.
Both these examples, demonstrating the ease of movement formula combined with a simple moving average and volume, can provide traders greater clarity regarding the health of a price trend.
Conclusion
The Ease of Movement (EOM) Indicator combines price with volume to form a momentum indicator based on volume. It is frequently useful among day traders who buy and hold assets for longer time frames.
Like any other indicator, it should not be employed alone. It ought to be used in conjunction with other indicator tools or as part of a bigger system where several indicators coincide.


