


The MFI (Money Flow Index) and RSI (Relative Strength Index) are technical indicators used in stock market analysis to measure market conditions and help traders make informed investment decisions.
The MFI was developed by Gene Quong and Avrum Soudack, and measures buying and selling pressure in the market, while the RSI was created by J. Welles Wilder Jr., and is used to measure the strength of an asset’s price action. Both MFI and RSI can provide important information for traders, but they should be used in conjunction with other indicators and a thorough understanding of market conditions to form a complete trading strategy.

What Is MFI?
MFI (Money Flow Index) is a momentum indicator that measures the flow of money into and out of a security. It is based on both price and volume, which helps to identify the intensity of buying or selling pressure. The MFI oscillates between 0 and 100 and is usually presented in a chart form, providing a visual display of the money flow.
The MFI is particularly useful for analyzing market sentiment and identifying when there has been an influx of buyers or sellers. It can be used for identifying market overbought and oversold conditions. In addition, it can be used in conjunction with other indicators such as RSI (Relative Strength Index) vs MFI to help form a more complete trading strategy. Additionally, you can use the Money Flow Index chart to look for possible crossovers – when the MFI 14 crosses 20 or when it crosses 50. These crossovers often indicate a change in trend direction.

How to Use MFI?
The Money Flow Index (MFI) can be used as a standalone indicator or in conjunction with other technical indicators to generate trading signals. Here are some guidelines for using the MFI:
-
Overbought/Oversold Signals: MFI ranges from 0 to 100, with readings above 80 indicating an overbought market and readings below 20 indicating an oversold market.
-
Divergences: A divergence between the MFI and the underlying asset’s price can be a strong signal of a potential trend reversal.
-
Trend Strength: The MFI can also be used to assess the strength of a trend. A strong uptrend will have the MFI consistently above 50, while a strong downtrend will have the MFI consistently below 50.
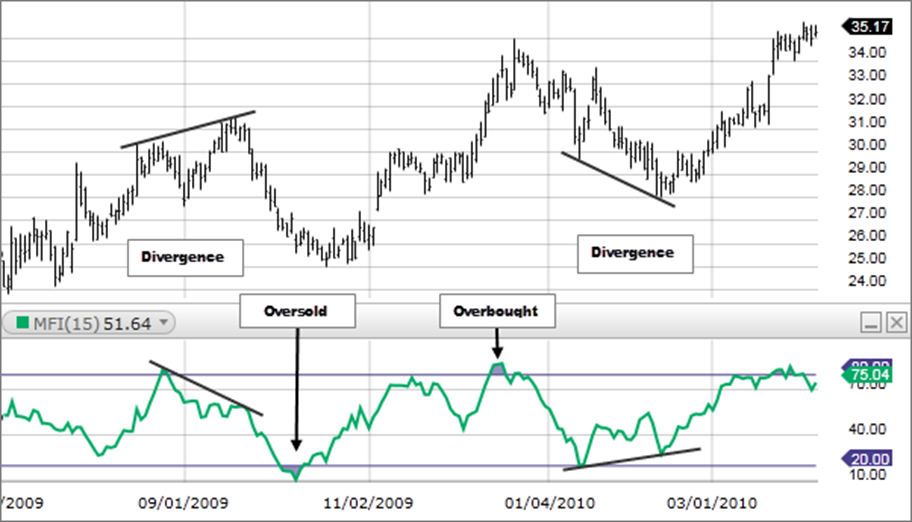
Image by Fidelity Investments
How to interpret MFI readings?
The MFI is a momentum oscillator that ranges between 0 and 100, with high values signaling strong buying pressure and low values signaling strong selling pressure.
The most common signals generated by the MFI are divergences and crossovers. Divergences occur when prices make higher highs or lower lows while the MFI moves in the opposite direction. For example, if the stock price makes a new high but the MFI is making a lower high, it could signal a trend reversal. A crossover occurs when the MFI crosses above or below key levels, such as 20 or 80. A cross above 20 indicates that buying pressure is increasing and could result in an upward price trend.
Conversely, a cross below 80 suggests that selling pressure is increasing and could result in a downward trend.
How to calculate MFI?
The Money Flow Index (MFI) formula consists of the following steps:
-
Calculate typical price (TP): TP = (High + Low + Close) / 3
The typical price is an average of the high, low, and close prices for a given period, typically a single day. This calculation is used to obtain a single representative price for the period being considered.
-
Calculate money flow:
-
Money flow = TP * Volume.
The positive and negative money flows are calculated based on whether the current typical price is higher or lower than the previous period’s typical price. Positive money flow is calculated when the typical price is higher, and negative money flow is when it is lower. Both values are multiplied by the volume of the security being analyzed.
-
Calculate the money flow ratio (MF ratio):
-
MF ratio = 14 day Positive money flow
14 day Negative money flow,
The money flow ratio is calculated by dividing the positive money flow by negative money flow. This ratio is used in the next step of the calculation.
-
Calculate the MFI:
-
MFI = 100 – (100 / (1 + MF ratio))
The Money Flow Index is calculated as the difference between 100 and 100 divided by 1 plus the money flow ratio. The MFI is an oscillator that ranges from 0 to 100, with higher values indicating higher buying pressure and lower values indicating higher selling pressure. The MFI is typically used with a 14-day period, but other periods can also be used.
Formula for MFI
The Money Flow Index formulas are:
-
Typical price (TP): TP = (High + Low + Close) / 3
-
Positive and negative money flow:
-
Positive money flow = Positive money flow for previous period + TP * Volume if TP is greater than the previous period’s TP
-
Negative money flow = Negative money flow for previous period + TP * Volume if TP is less than the previous period’s TP
-
The money flow ratio (MF ratio):
-
MF ratio = (Positive money flow) / Negative money flow
-
MFI:
-
MFI = 100 – (100 / (1 + MF ratio))
The MFI can be used with a 14-day period, although other time periods may be used as well. It is important to note that the MFI is an oscillator and is most often used in combination with other indicators for a more comprehensive market analysis.
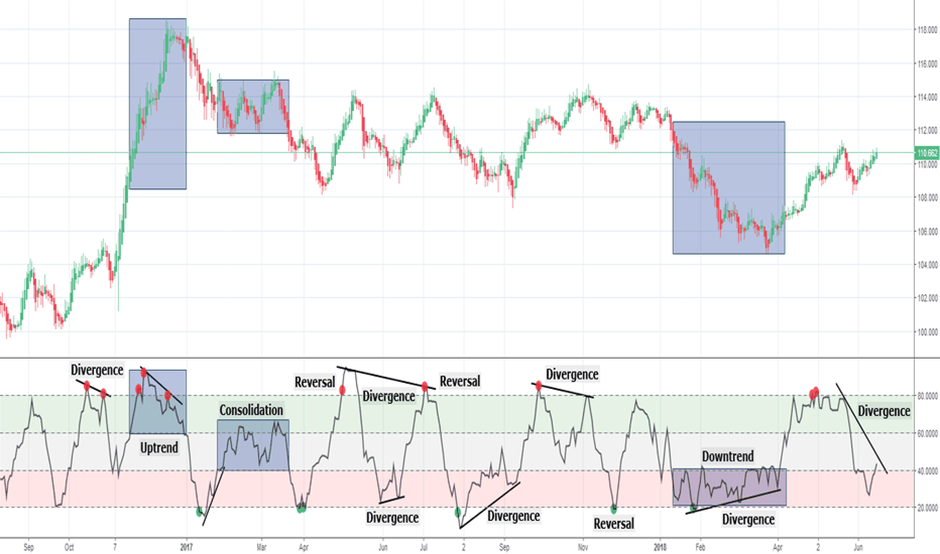
Image by TradingView
Money Flow vs Chaikin Money Flow
There are other money flow indicators which uses price and volume multiplication in their calculations. Some examples of commonly used money flow indicators are:
-
MFI (Money Flow Index)
-
Chaikin Money Flow (CMF)
Each of these indicators provides information on market buying and selling pressure, but their calculation and interpretation differ. The MFI, for example, is an oscillator with a range of 0 to 100 that is used to determine overbought and oversold conditions, whereas the CMF uses both price and volume information to calculate money flow.
Finally, the best money flow indicator is one that caters to a trader’s specific requirements while also providing useful information to support their trading strategy. To form a comprehensive analysis and make informed trading decisions, it is recommended to use a combination of indicators and tools.
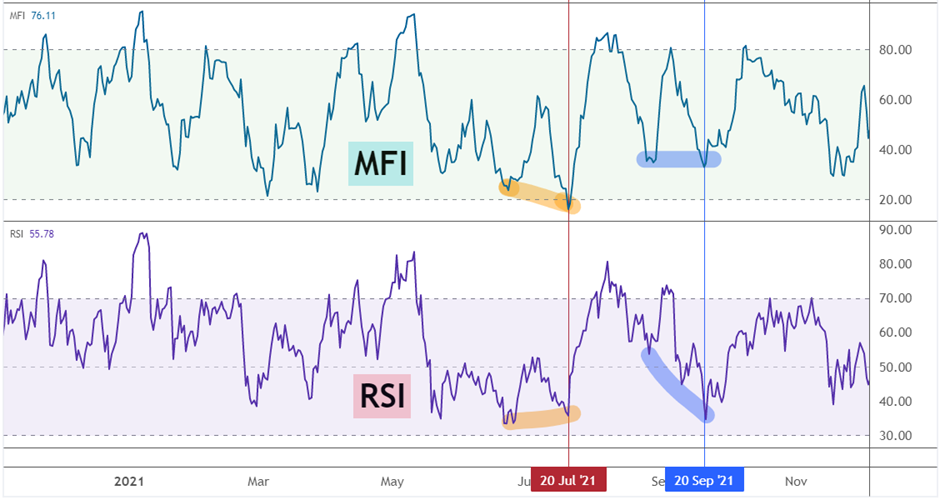
Image by Bybit Learn
Money Flow Index vs RSI?
The Relative Strength Index (RSI) and Money Flow Index (MFI) are two of the most prominent and often utilized indicators. Both indicators have their own set of strengths and shortcomings that make them perfect for particular trading methods.
When the two indicators are compared, it is clear that the RSI provides a stronger signal of price movement in the short term, while the MFI is better for determining trend strength in the long run. The MFI also provides more detailed information regarding market activity than the RSI. For example, when the MFI 14 crosses above 20, it indicates a likely bullish trend. The optimal money flow indicator is determined by your trading approach.
Depending on the demands of the trader, both indicators can be used to construct powerful trading strategies. To acquire a more complete picture of market conditions, like with all technical indicators, they should be utilized in conjunction with other analysis tools such as chart patterns and support/resistance levels.
Using MFI in Trading Strategies
The MFI is predicated on the premise that the quantity of money moving into and out of an asset can be used to determine its strength or weakness. When the MFI is high, there is buying pressure, and when it is low, there is selling pressure.
A frequent trading approach is to keep an eye on the MFI as it crosses above or below overbought or oversold levels. When it exceeds 20, it indicates that money is coming into the security and that it may be a good time to buy.
When it falls below 80, it may indicate that money is leaving the market, and it may be a good opportunity to sell. Another popular trading method is to wait for the MFI 14 to pass the MFI 20. When this occurs, it usually indicates a trend reversal.
Limitations of MFI
Despite its popularity, MFI is not without its limitations. Some of the key limitations of MFI include:
-
Lagging Indicator: MFI is a lagging indicator, which means that it tends to provide signals after price changes have already occurred. This can be problematic for traders looking to enter or exit positions in real time.
-
Volume Dependence: MFI is heavily dependent on volume data, which can be difficult to obtain in some markets, particularly those with low trading activity.
-
Subjectivity: MFI readings can be subject to interpretation, which means that different traders may have different opinions about the signals generated by the indicator.
Conclusion
The Money Flow Index (MFI) is a powerful technical indicator that combines both price and volume data to measure the buying and selling pressure of an asset. When used in conjunction with other technical indicators and fundamental analysis, MFI can be a valuable tool for traders and investors looking to make informed investment decisions.
However, it’s important to remember that MFI is not without its limitations, and should not be relied upon as the sole basis for making investment decisions. Traders should always use MFI as one component of a comprehensive trading strategy, and should always be mindful of its limitations and subjectivity.
In conclusion, MFI trading is a great way to identify potential buying and selling opportunities in the stock market. By keeping an eye on how money is flowing in and out of a security, traders can gain valuable insight into when it might be a good time to enter or exit a position.


