

Every day trader knows two key elements of trading – Price action and volume. Approximately every strategy, indicator, drawing tool, and charting system employs one or both of these elements. Profitable traders recognize the significance of comprehending volume and price behavior and more crucially, how they are linked together.
Volume is crucial for verifying trends and patterns in technical analysis. It is used by stock market traders to analyze how many stocks are being bought or sold in the market at a certain price and in a specific period.
While it is not difficult to identify volume with the unaided eye, it is challenging to understand it. Making snap judgments based solely on volume and price movement is quite difficult; this is where indicators come into play.
Volume indicators are perceivable depictions of the interaction between price action and volume. For most traders, as price action and volume account for 80% or more of their trading tactics, a powerful volume indicator or two is an important part of their trading success. It helps to identify if the volume of certain currency pairs is high or low, giving market continuation and reversal signals.
Volume RSI indicator is one such indicator that combines elements of volume analysis with the classic RSI and offers valuable insights into market dynamics and potential trade setups.
Before discussing the intricacies of Volume RSI and trading strategies, let us understand the significance of high and low volume and volume indicators in the stock market.
What is Volume?
Volume refers to the total amount of an asset or security traded over time, usually over a trading day. For example, trading volume refers to the number of shares exchanged between a daily open and close of a stock. Technical traders require important information such as trading volume and variations in volume over time.
Significance of High Volume
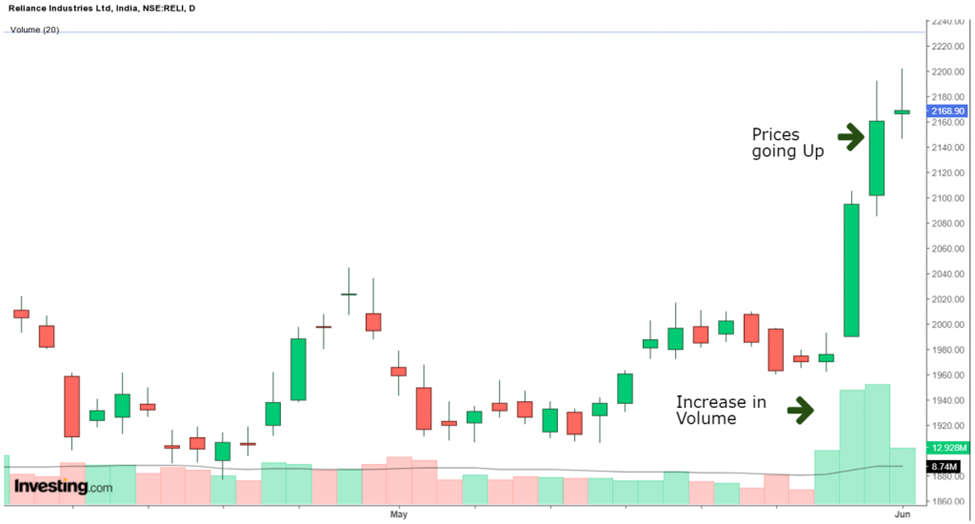
A high volume suggests more demand for the stock and the existence of buyers and sellers for that stock. When the stock is in an uptrend, and the volume increases together with the continuing trend, the stock will continue to increase.
It implies that a greater number of buyers are interested in purchasing that stock. In the same way, stocks will continue to decline if they are in a downtrend and there is a rise in volume together with the continuing trend.
High volume is, therefore, crucial since it indicates a substantial number of buyers and sellers who are interested in a specific security.
We can observe how rising volume is driving up stock prices from Reliance Ltd.’s daily chart:
Significance of Low Volume
A low volume suggests that there isn’t much interest in that specific stock.
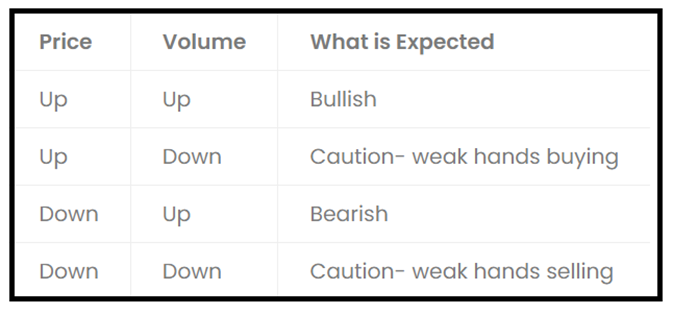
When the stock is rising and volume is declining, then it suggests a reduction in the demand for the stock amongst the buyers, and the uptrend will reverse.
Similarly, if the stock price is moving downwards and volume is dropping, then it implies a reduction of interest in the stock amongst the sellers, and the downward trend is going to reverse.
The table below summarizes the above.
What are Volume Indicators?
A volume indicator is a technical analysis parameter that determines the buying (demand) and selling (supply) pressure of a currency pair and, in turn, helps understand which perspective controls the price movement.
When volume indicators suggest high volume for a currency pair, it indicates a high buying pressure, alerting traders to the high demand for the pair and advising them to go long or place a trade.
When volume indicators suggest low volume for a currency pair, it indicates a high selling pressure, alerting traders to a large supply level for the pair and giving them a price level at which to short or close out of the trade.
A currency pair indicates a continuation of the trend in the same direction when it trades in an upward or downward direction with increasing volume. On the other hand, a market reversal owing to a weak trend is indicated when a trend is supported by declining currency pair volumes.
Traders can make more profitable, fast, and objective buy and sell choices with the help of these indicators. The On-Balance Volume (OBV), Volume Price Trend Indicator (VPTI), Money Flow Index (MFI), Volume-Weighted Average Price (VWAP), and Volume RSI (Relative Strength Index) are some of the common types of volume indicators used in day trading.
Now that we understand the significance of a volume indicator, let us discuss Volume RSI along with its trading strategies in detail.
Volume RSI – Explained
Volume RSI indicator is a volume-based technical indicator that uses variations in up and down volume to gauge price trend changes. While the Relative Strength Index (RSI) and the Volume RSI are similar, the former uses the bullish and bearish volume in its calculation formula. It is a momentum indicator, which predicts market pattern changes by examining fluctuations using bullish and bearish volume data.
Volume RSI oscillates around 50% middle line in the 0-100% range. A Volume RSI reading of below 50% suggests a bearish trend, and above 50% suggests a bullish trend.
The Volume RSI measures the ratio of up and down volume over a particular period, similar to how the traditional RSI determines price momentum, indicating overbought or oversold conditions. By analyzing both volume and price data, traders can identify possible trend reversals, divergences, and confirmations more effectively.
It is calculated as follows:
VoRSI = 100 – 100 / (1 + VoRS)
VoRS is the ratio between average up volume and average down volume.
Volume RSI Trading Strategies
One way of trading Volume RSI is to trade on signals generated by the indicator’s crossovers and the 50% middle line, around which it moves.
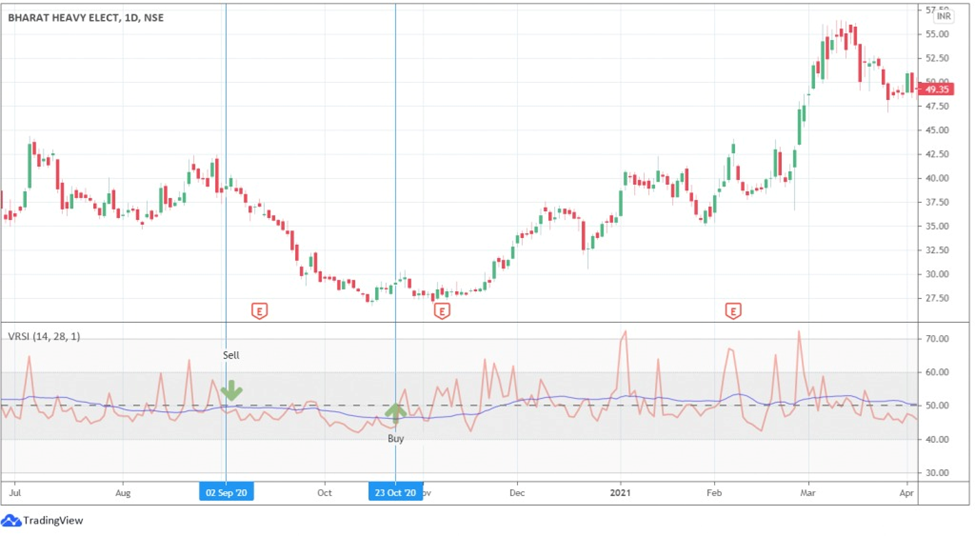
A reading of the Volume RSI above 50% is seen as positive, suggesting that bullish volume outweighs bearish volume.
A reading of Volume RSI less than is seen as bearish, suggesting that bearish volume outweighs bullish volume.
As a result, traders can buy when the indicator moves above the 50% line from below and sell when the indicator drops beneath the 50% line from above. This can be observed in the Bharat Heavy Electronics Ltd.’s daily chart below.
Conclusion
While no single indicator is perfect all the time, the best volume indicator is the one that consistently helps you identify good entry and exit points.
Most (if not all) successful day traders have a system they are comfortable with, and almost all of those systems include some kind of volume indicator.
Volume RSI is one such powerful volume-based indicator that effectively combines volume analysis with classic RSI. It enables traders to get deeper insights into price trends, reversals, and divergences, as well as enhance their decision-making process.
However, like any technical indicator, Volume RSI should be used in combination with other tools and through analysis for optimal outcomes.


