

Intuition can be valuable, but successful traders often rely on a combination of technical indicators to get a more comprehensive view of the market. Indicators like the ADX and Stochastic Oscillator, for example, can work together to provide stronger confirmation of trading signals. By using a combination of indicators, you can improve your ability to identify high-probability trading opportunities and make more informed decisions.
Deep Dive into the ADX Indicator
This technical indicator measures trend strength rather than direction, called the Average Directional Movement Index (ADX).
The ADX is an indicator that was developed by Waldes Wilder. When the numbers are higher, this usually means the market trends are strong, and if they’re lower, the trends are not that strong.
How is ADX Calculated?
The ADX is derived from three directional movement indicators:
- Positive Directional Indicator (+DI): Captures the strength of recent upward price movements.
- Negative Directional Indicator (-DI): Reflects the strength of recent downward price movements.
- Directional Movement Index. It tells you the difference between how much prices have moved up versus down, in percentage terms.
You calculate the ADX by averaging the DX numbers over a certain number of days, often 14.
Interpreting ADX Values: What do the Numbers Mean?
Here’s a breakdown of what ADX values generally indicate:
- ADX below 25 : Suggests a weak or choppy trend, potentially signaling a period of consolidation.
- ADX between 25 and 50 : May indicate a trend of moderate strength, but further confirmation from other indicators might be helpful.
- ADX above 50 : Signifies a strong trend, either upwards or downwards.
ADX doesn’t measure the direction of the trend but it measures only strength.
When the ADX increases as prices do, then it indicates that the bullish trend is developing in a market; however if it went up while prices were dropping, it indicates that bearish movement is getting stronger.
This point can further be validated with price action (new highs/lows) as shown below: That said, the ADX could lead to price and it doesn’t provide explicit signals to go long or short. How can you make your strategy much more robust? Let’s combine ADX with another wonderful tool of all time!
Demystifying the Stochastic Oscillator
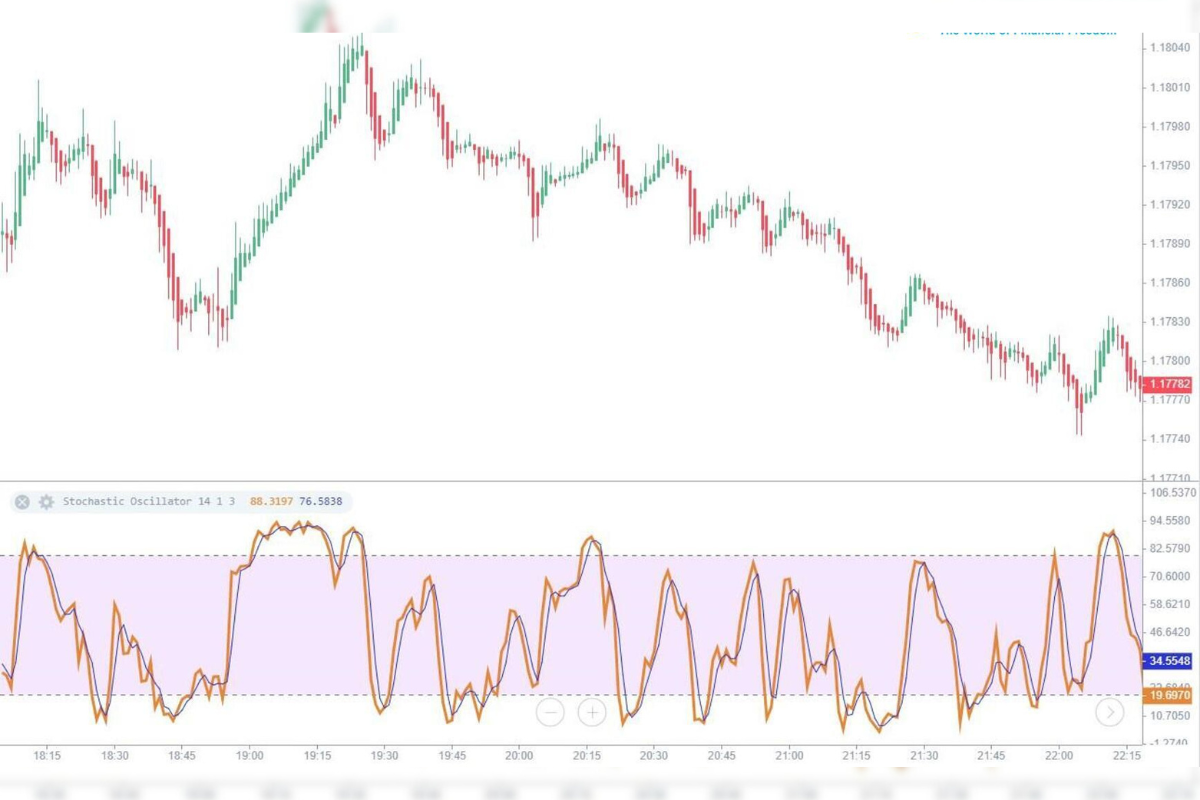
The stochastic oscillator is one of the best tools for identifying market entry points. The indicator measures market momentum based on past performance, determining the degree to which the market is overbought and oversold.
Trading strategies based on stochastics are easy to learn and therefore suitable for beginner traders. Professionals prefer using stochastics to other indicators due to their versatility, compatibility with other technical analysis tools, and relatively high accuracy.
Interpreting Stochastic Oscillator Values
Classically, stochastics are depicted as two moving curves that move between two levels. Usually this is 80% and 20%. Here’s a general interpretation of Stochastic Oscillator values:
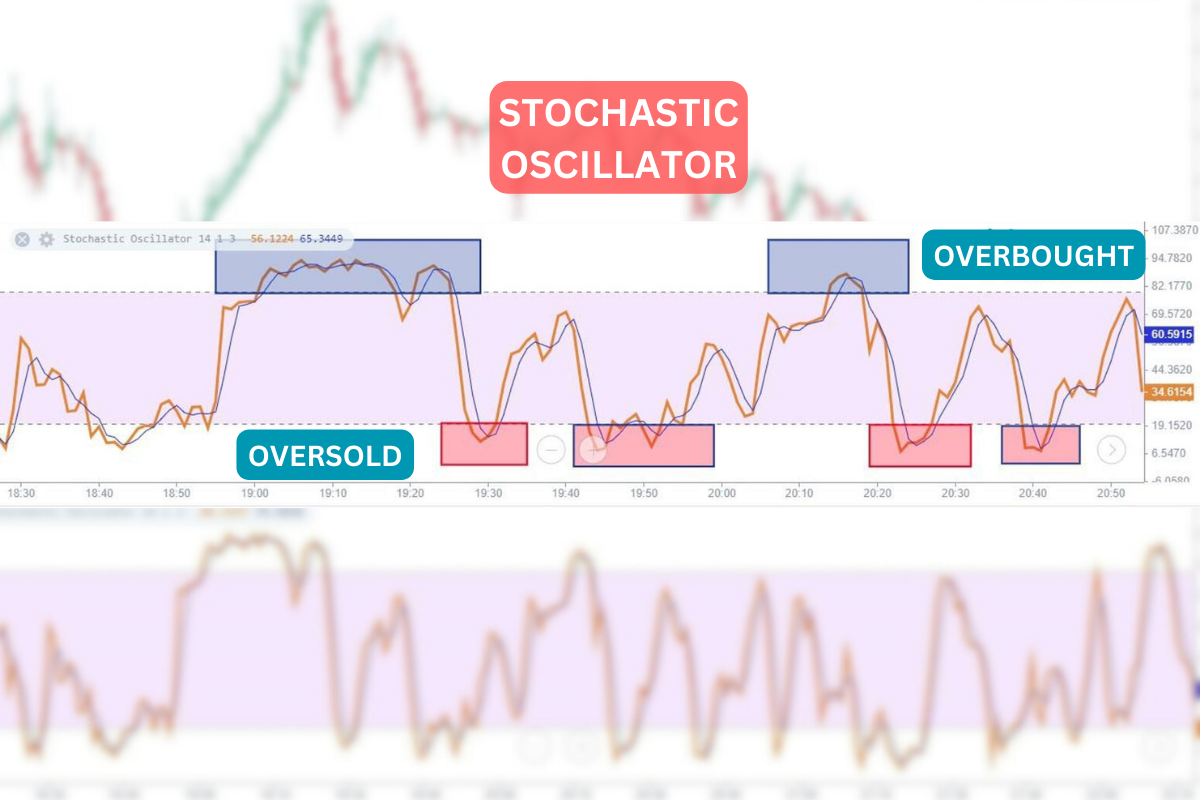
- %K and %D above 80: Indicate potentially overbought conditions, suggesting the price may be due for a correction (downturn).
- %K and %D below 20: Signal potentially oversold conditions, implying the price may be ready for a rebound (upturn).
An instrument is considered overbought when the two moving lines are above the upper 80% level (marked by the blue areas at the top) and oversold when they break below the lower horizontal 20% line (red areas at the bottom).
The intersection of lines is of particular importance. If it occurs in the overbought zone, then this event should be considered as a signal to open a short position. If it is in the oversold zone, then you should open a long position.
Combining ADX with the Stochastic Oscillator
Since we’ve looked at what both ADX and Stochastic Oscillator are good at, now we must see the spectacular phenomena that happen when we mix them the right way. One clearly can envision the somewhat amazing moves you can pull off when you understand how to use them together.
ADX + Stochastic = Powerful Trading Combo:
- Better Market View: Combined, they analyze trend strength (ADX) and momentum/entry points (Stochastic).
- Stronger Signals: Together they filter out false signals from each other.
- Precise Timing: ADX spots trends and stochastic times entries/exits within them.
Setting Up ADX and Stochastic Oscillator on Your Trading Platform
A significant quotient of trading websites lets you put special tools on your charts to help you make decisions. You should look for tools named ADX and Stochastic Oscillator in your website’s collection of tools.
Usually, they’re set up to use 14 periods for the ADX and %K, and 3 periods for %D, which is a pretty decent location to begin; that said, don’t be shy about trying different settings to see what fits best with the way you trade and the amount of time you want to spend on it.
Trading Strategy with ADX and Stochastic Oscillator
This really sets you up well if you want to make a trading plan that uses ADX and Stochastic Oscillator but we shall add Moving average (MA) too to showcase how this works.
The indicator settings are as follows:
- ADX with a standard period of 14 and a level of 20.
- Stochastic with standard settings and an additional level of 50.
- 3 exponential moving averages with periods of 5, 15, and 30.
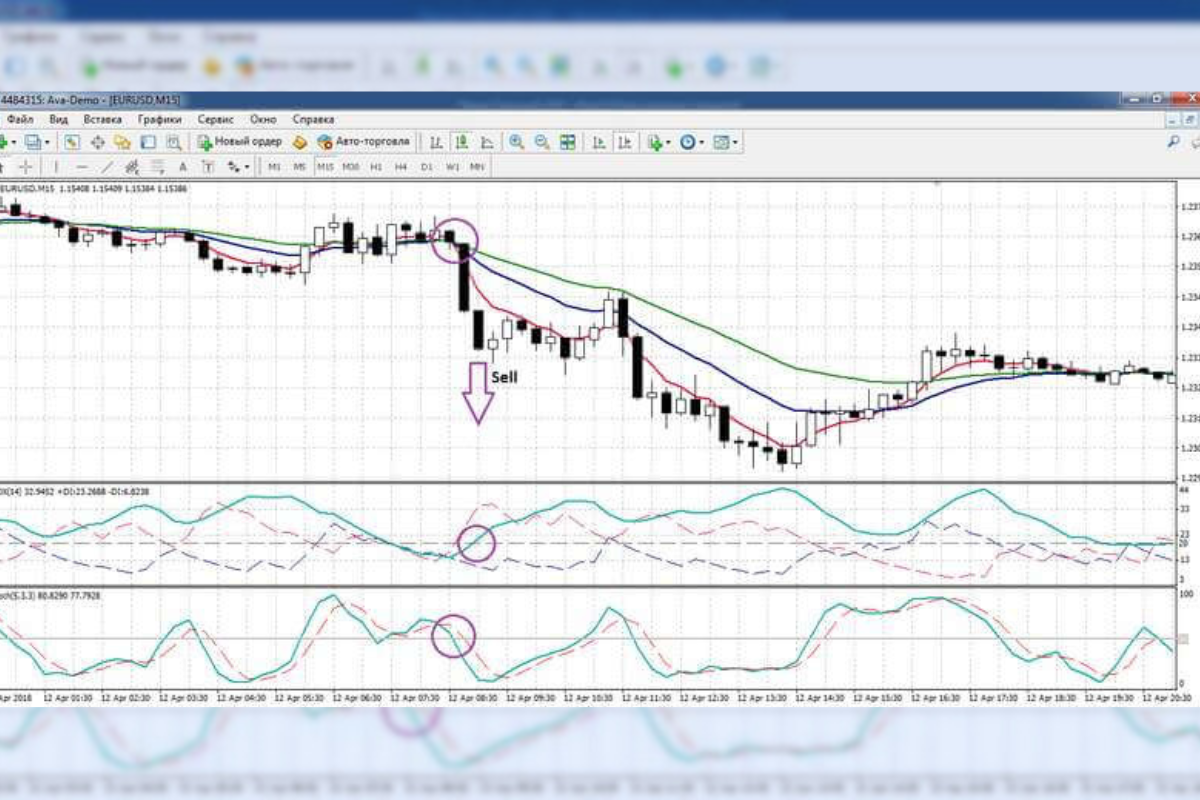
Sell transactions using this strategy are opened subject to the following conditions:
After intertwining, the moving averages diverge and line up in the order EMA (5), EMA (15), and EMA (30) from bottom to top.
The stochastic oscillator crosses the 50 level from top to bottom.
The main ADX line crosses level 20 from bottom to top.
Buy trades are opened under mirror conditions for EMA and Stochastic Oscillator; ADX must also cross level 20 from bottom to top.
You can exit the trade by the reverse intersection of the moving averages, or using a trailing stop. It is not recommended to set a hard take profit, since the trend can be long, and it is better not to limit the potential profit to a fixed value. Stop loss is set at a local extreme.
As practice shows, the ADX indicator is most effective as a filtering tool in a comprehensive trading strategy. It is great for trading in a trend, helps to determine its presence, and avoids losses from entries based on false signals.
Conclusion
Starting your trading journey, you must get equipped with solid knowledge. One clearly can envision using the ADX to figure out how strong the trend is, and then, tossing in the Stochastic Oscillator helps tell you focused on momentum and when phenomena are significantly too bought or sold. When you mix these two up, one mustn’t deny that traders get, inherently, in substance similar to a very advantage–but knowing when to join in and out is key, and wouldn’t, this combo lays it all out. Note, to really make it in the long run, staying sharp on what’s happening in the market and managing your risks smartly is very important.


