


Being one of the most common and ideal trading indicators, moving averages have remained in predominant usage for several decades. They have different versions, but the exponential moving average is one of the most used types.
The exponential moving average (EMA) is a weighted moving average of close prices over a certain period, where recent data points are considered more significant than distant data points.
As a result, the exponential moving average is more responsive and adaptive than many other forms of average, which has obvious advantages in many scenarios.
It’s a preferred technical indicator among thousands of traders because it applies to various financial markets, including forex, stocks, and commodities.
It is often deployed in combination with other technical analysis indicators and tools like Bollinger Bands, MACD, and Relative Strength Index to deliver optimal results.
In this article, we’ll explain the Exponential Moving Average (EMA) in detail along with its formula and some of the common trading strategies involving the indicator.
Let’s begin to learn what is EMA in trading!
What is Exponential Moving Average
The EMA indicator responds more quickly to fluctuations in price action when used in trading, which gives it an edge over the simple moving average. Since more weight is given to recent price data and less to price data that occurred earlier in the trading day, it becomes more sensitive to any fluctuation in price data and, presumably, better at predicting where the price will go next.
The EMA indicator thus helps to affect the decisions of traders in the precise instant that they execute a trade according to the exact price changes rather than what was occurring on trading charts earlier.
This greater weight of recent price data is important when analyzing volatile markets with sudden price fluctuations. It is especially effective for recognizing price trends and recent swings on price charts to reveal trading patterns.
It also indicates that there is less of a lag because Exponential Moving Averages react swiftly to price changes. As a result, constructing an Exponential Moving Average trading strategy is ideal for traders who prefer short-term tactics, such as day trading in volatile markets.
Are EMA and EWMA the Same?
Yes, the Exponential Moving Average (EMA) and Exponentially Weighted Moving Average (EWMA) are the same indicator. The EMA is also known as the EWMA because it lends more weight to recent price data points than the Simple Moving Average (SMA), which assigns equal weight to all price data points in a period.
Who Invented the Exponential Moving Averages?
Exponential Moving Averages have been around since 1963, making them one of the oldest trading indicators. Robert Goodell and Charles Holt made significant contributions to the research of exponential smoothening.
Robert Goodell was a mathematician and author who specialized in exponential smoothing. Smoothening, Forecasting, and Prediction of Discrete Time, a book series he published in 1963, served as the basis for the EMA indicator.
Charles Colt, a business professor at the University of Texas in Austin, also made contributions to the field of exponential smoothing.
Exponential Moving Average trading is most widely employed in stocks and commodity trading, but it has recently become popular among cryptocurrency traders. Traders manually calculated it before the advent of digital trading software.
The difference between EMA and SMA Indicators
Exponential Moving Averages and Simple Moving Averages are similar indicators in that they are employed to measure trends. Another similarity is that they are deployed to smooth price changes in trading and operate on the same principles. However, there are some distinctions between the two indicators.
- EMA indicator gives more emphasis to recent prices during a trading period, whereas SMA gives equal weight to all values.
- The exponential moving average differs from the simple moving average in that the current day’s EMA calculation depends on the EMA calculations for all days preceding that day. To compute a relatively accurate 10-day EMA, you need significantly more than 10 days of data.
- Since EMA indicator places more emphasis on recent data than old data, it is considerably more sensitive to the most recent price fluctuations than the SMA. The high sensitivity of EMA allows traders to recognize a trend faster. This explains why some traders prefer it.
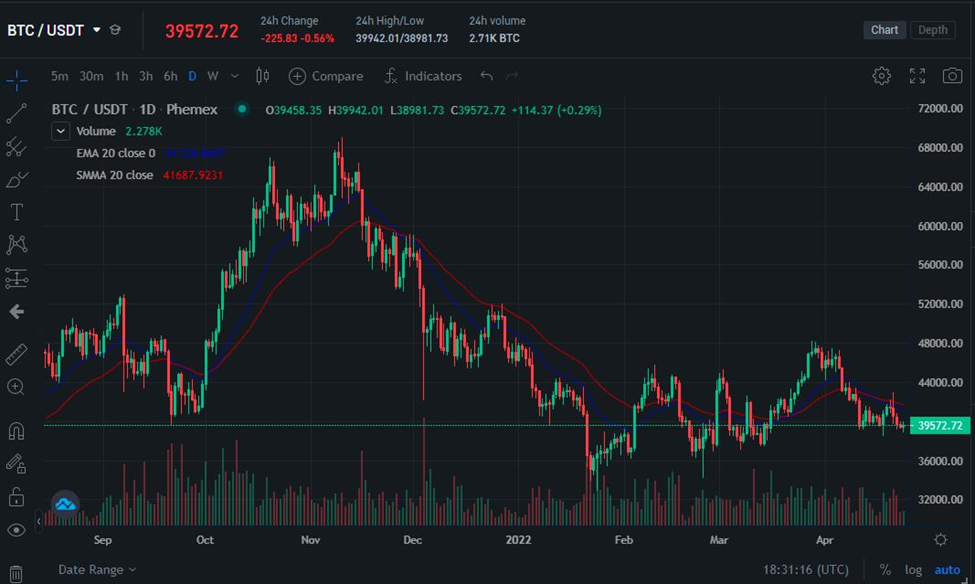
As can be seen in the chart above, the blue moving average is 20-day EMA, and the red moving average is 20-day SMA. The Exponential Moving Average is closer to price action, while the Simple Moving Average is slightly separated and slower to respond to the same price fluctuations. Day traders usually prefer Exponential Moving Average strategies for their quickness.
The 8- and 20-day EMAs are the most popular timeframes for day traders, although the 50- and 200-day EMAs are better suited for long-term investors.
Calculating the Exponential Moving Average and EMA Formula
Almost all charting packages conduct this computation on their platforms and apply Exponential Moving Average formula to the chart. The methodology will be shared with the numbers folks below, but the main thing to understand is that Exponential Moving Averages will react to price changes faster than SMA.
There are three key steps in EMA calculation to trade any instrument. They are as follows:
- First, you have to calculate the Simple Moving Average (SMA) to get the initial EMA value. To calculate it, take the average of the previous data points, which are frequently past closing prices. If you were looking for a security’s 10-day SMA, you would add the closing prices from the past 10 days and divide by 10.
SMA = (N – period sum) ÷ N
Where
N = the number of days in the given time period
Period sum = the sum of closing prices in that time period.
- Next, you have to calculate the weighting multiplier for the number of periods we wish to measure for the Exponential Moving Average. This is calculated by the formula:
Weighting Multiplier (Smoothing Constant) = (2 / Time Periods + 1)
As we are using 10 days in the example, the weighting multiplier would be:
(2 / (Time Periods + 1) = (2 / (10 + 1) = 0.1818 (18.1%)
- Lastly, you can calculate the EMA for each day between the initial EMA value and the present day using the previous period’s EMA value, price, and multiplier.
EMA Formula
EMA = (closing price – previous day’s EMA) x weighting multiplier + previous day’s EMA
Don’t worry if this appears complex. As previously said, you do not need to learn how to compute the Exponential Moving Average (EMA).
Instead, you only need to understand how to apply it to the chart and comprehend it.
What does the Exponential Moving Average (EMA) tell Traders?
Traders can learn a few things from the Exponential Moving Average. For instance, when the price trades at the same rate as the EMA, it indicates that there isn’t any volatility in the market. Other indicators, such as the Bollinger Bands and the Average True Range (ATR), can be used to validate the absence of volatility.
Secondly, the EMA may determine whether an asset is costly or inexpensive. For example, if a stock trades at $50 and the 25-day moving average is $30, it indicates that the stock is somewhat pricey. This is usually due to something huge, such as breaking news or a major event.
The chart below demonstrates that Nvidia’s stock price is expensive because it is substantially above the 100-day moving average.
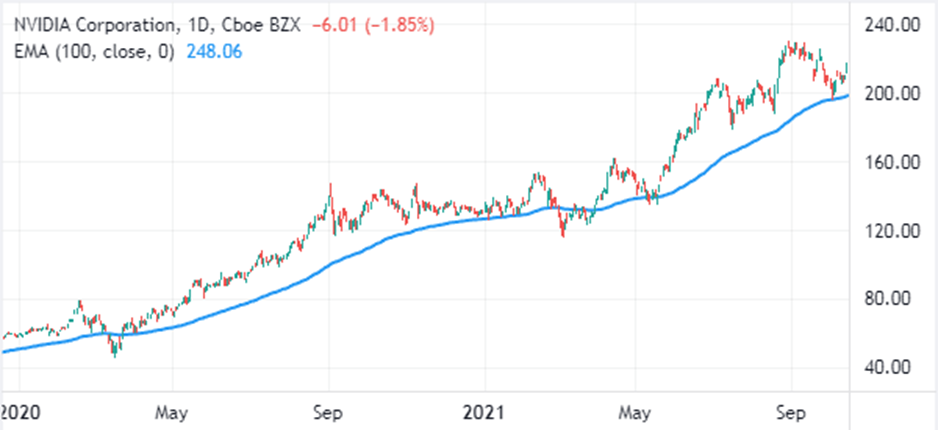
Thirdly, the Exponential Moving Average can predict whether a trend will continue to rise or reverse. If a stock continues above the EMA during an upward trend, it indicates that the bullish trend will persist. If, on the other hand, a stock crosses the average, it indicates that a reversal is about to begin.
How to Use EMA in Trading Strategies
The versatility of Exponential Moving Average offers a variety of innovative applications in trading, depending on the trader’s preferences. The following are some of the most common applications for the EMA indicator.
Using EMA Indicator for Trend Analysis
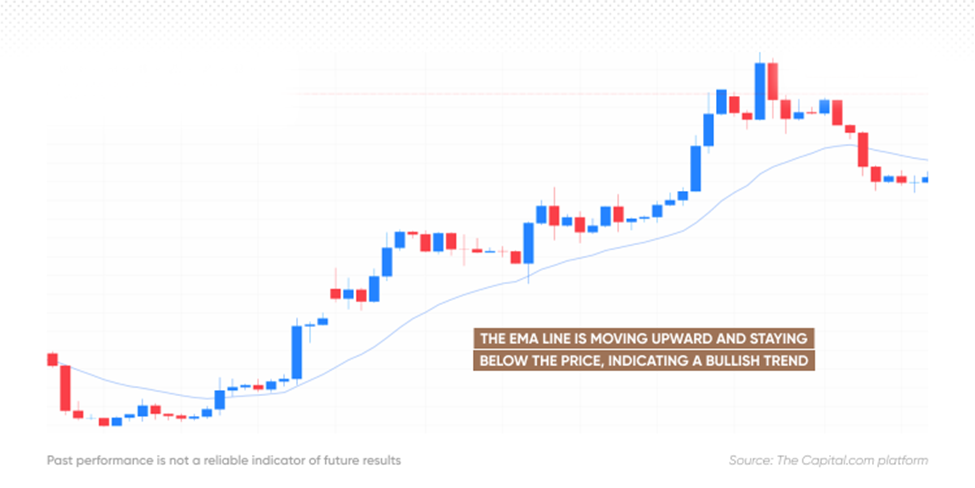
Traders can determine the trend by observing the direction of the EMA line and its location relative to the price chart.
If the EMA slopes upward and is lower than the price, it often implies bullish momentum. When the EMA is above the price and trending upward, it generally indicates bullish momentum but with greater resistance.
If the EMA is trending downward and above the price, it may indicate a bearish trend. If the EMA slopes downward and below the price, it indicates that a downtrend may encounter some resistance.
It is necessary to examine the direction of the Exponential Moving Average in combination with the price position to measure the trend effectively.
The indicator can also serve as dynamic support and resistance levels, giving traders crucial information about prospective market reversals or continuations. Traders can measure the strength of the current trend by observing the relationship between the price and EMA line. For instance, when the EMA crosses below the price in a downtrend, it may indicate that a bullish reversal is imminent. In contrast, if the EMA rises above the price during an uptrend, it may imply that a bearish reversal is imminent.
EMA Price Crossover Strategy
EMA trading includes using two EMA indicator crossovers for generating buy and sell signals.
An EMA crossover method involves tracking two or more EMAs with various time frames to discover trade signals. When a shorter-period EMA passes over a longer-period EMA, it provides a bullish signal, indicating the possibility of an uptrend. When a shorter-period EMA passes below a longer-period EMA, it produces a bearish signal and indicates a probable downward trend.
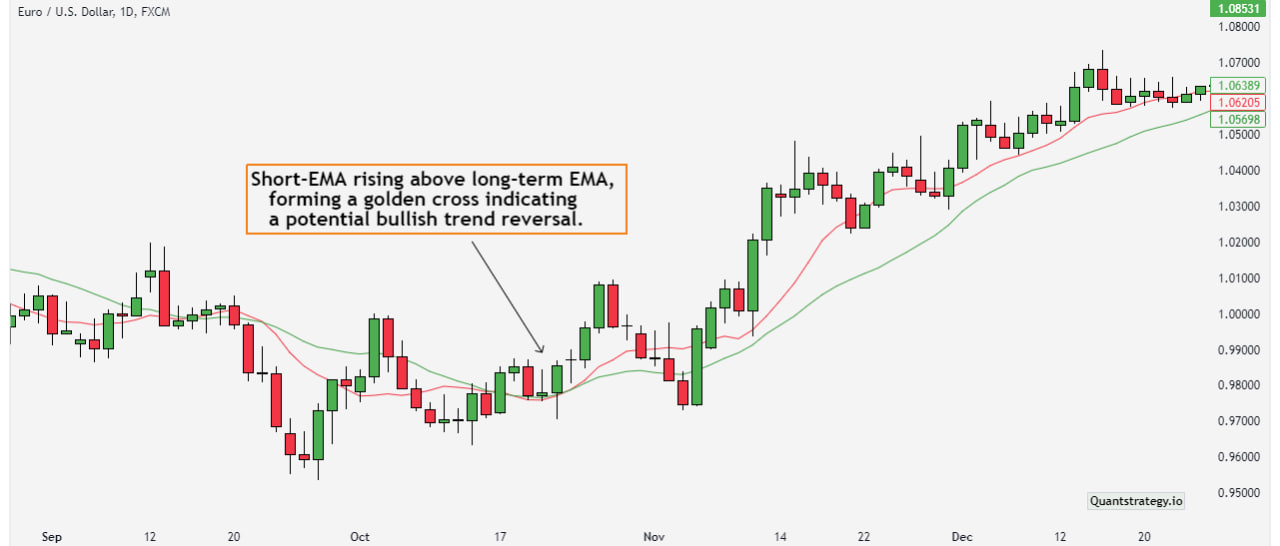
EMA crossovers are classified into two types: golden cross and death cross. When a short-term EMA passes above a long-term EMA, it indicates a likely upward price movement. This is referred to as the golden cross. A death cross occurs when a short-term EMA passes below a long-term EMA, indicating a likely price drop.
To trade with this EMA trading strategy, traders should pay particular attention to the EMAs’ intersection points and the price movement that follows, as well as other technical indicators and market context to ensure trustworthy signals.
EMA in Day Trading
Day trading with the Exponential Moving Average should be carried out on short-term charts such as 4H (hourly) and modified for shorter n-periods. Avoid utilizing the indicator alone and instead employ trend oscillators like the Relative Strength Index (RSI) to highlight “Overbought” and “Oversold” levels.
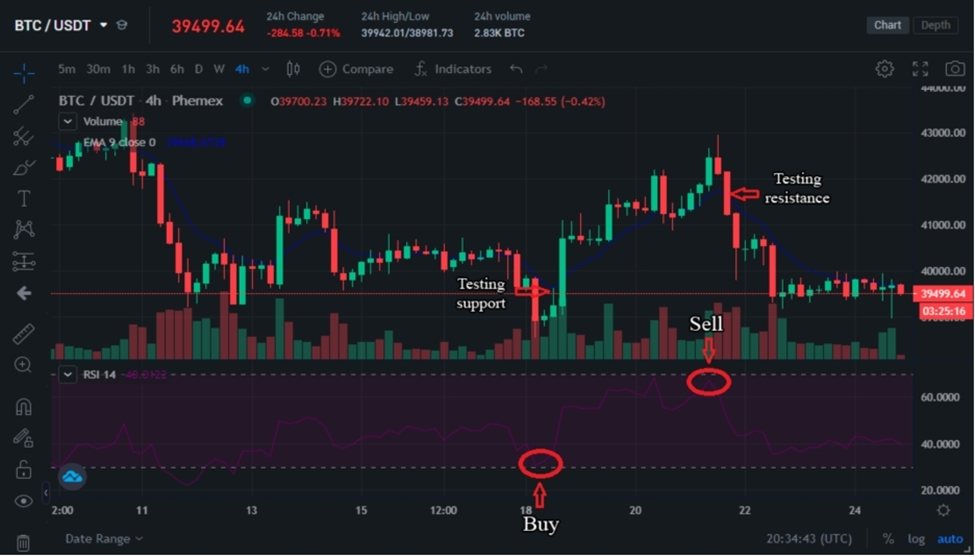
Trading opportunities emerge when the RSI oscillator hits severe overbought or oversold levels. We can see that the price has dropped below the EMA, presenting a fantastic long opportunity, which is matched by an oversold reading on the RSI indicator. The price then surpassed the EMA indicator, indicating an overbought condition.
In the earlier case, the price increased from $39,000 to $43,000, but in the second case, the price decreased from $43,000 to $39,000. In simple terms, go long when the price goes below the EMA and go short when it rises over the EMA. Make sure that the signal matches the RSI oscillator’s extreme readouts.
Potential Limitations of Exponential Moving Average
While the EMA indicator is extremely beneficial in giving a near-instantaneous reaction to market conditions, enabling quick and educated trading decisions, it does have certain disadvantages. Because the EMA gives greater weight to recent data points, it frequently lags behind more established trends. Furthermore, when more data points are added to the computation process, each point becomes insignificant, which means that small market fluctuations can radically alter the estimated EMAs and result in incorrect conclusions. While it suggests the current trend of the stock, it cannot perfectly predict its future trend. Finally, while other indicators may provide information about overall market behavior, they might become invalid when combined with EMAs.
Conclusion
The Exponential Moving Average is a useful tool for traders to determine trends in a financial asset over time. Traders can consider a greater degree of complexity within the price movement by assigning more weight to the most recent price movements instead of equal averages like in the Simple Moving Average. However, because it is based on past data, it is not a reliable source for future predictions, and erroneous signals may mislead traders. As a result, it should be utilized in conjunction with other types of fundamental and technical analysis when developing an effective trading strategy.
FAQ
Q. What is EMA in trading
A. EMA stands for Exponential Moving Average. It is a popular technical analysis tool used by traders to identify trends, gauge momentum, and make informed decisions about when to buy or sell an asset.
Unlike a Simple Moving Average (SMA) that gives equal weight to all prices, the EMA gives more importance to recent price data. This makes it more responsive and faster to react to new information.
Pre-Built Backtests
Forget guessing how an indicator might perform; our instant backtesting data gives you the answers.
We’ve done the heavy computational lifting so you can focus on making informed decisions.
Quickly learn technical indicator use cases and trading methods by exploring our indicators library.
Master the practical application of any technical indicator, like EMA, by diving into our comprehensive Indicators Library.


