

Moving Averages (MAs) are technical indicators that enable traders to identify trends and changes in the market. They aid in determining prospective price movements by suggesting both upward and downward tendencies and marking probable points of reversal or stabilization. The Weighted Moving Average (WMA) is a type of moving average indicator that is particularly useful since it pays special attention to recent prices and does not regard all prices as the same. This assists traders to understand market trends better and make more informed buying or selling decisions.
In the following post, we shall take a deeper look at the Weighted Moving Average, discuss its calculation, and how it can be used in today’s more volatile markets.
Let’s start!
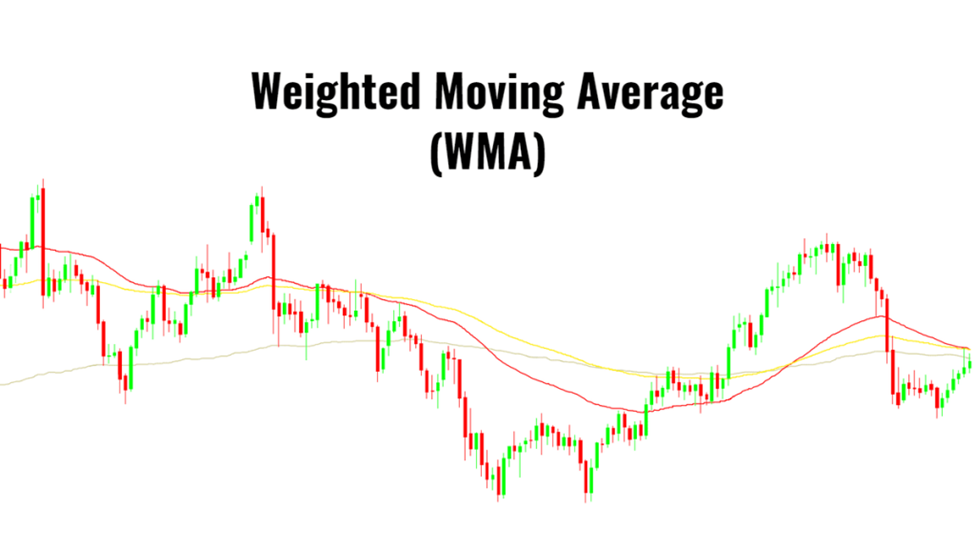
What is the Weighted Moving Average (WMA)?
The Weighted Moving Average is one of the preferred technical analysis tools used by traders to determine trend direction and discover probable locations of price support and upward rallies or to spot occasions where prices are possibly elevated and going downward. It computes the average of a set of numbers. It is employed in trading to calculate the average of a set of market prices.
The weighted average tool is used by traders to generate trade signals. When the price action advances towards or above the WMA, for example, the signal might be used to exit a trade. On the other hand, if the prices dip near or just below the WMA, it can be a sign to enter a trade.
WMA is a part of the larger umbrella of moving averages, which are among the most prominent tools used by crypto traders to evaluate market patterns and probable price reversals. You may already know about the Simple Moving Average and Exponential Moving Average. The WMA is another form of moving average. Unlike the Simple Moving Average, which gives equal weighting to data points in a particular time frame, WMA allocates different weights to past data points.
The most recent data points in a Weighted Moving Average are given a higher weighting factor, whereas older data points are given progressively lowering weights. This implies that the most recent prices have a greater impact on the average’s calculation, representing the current market sentiment more precisely.
Weighted Moving Average is adaptable and can be used on any crypto chart and within any time frame. Most traders use the moving average to identify trend direction on hourly, daily, or weekly charts. Irrespective of the time frame, this weighting factor enables a WMA to react more effectively to recent prices, making it a handy tool for traders looking for early trend reversals.
Weighted Moving Averages are a leading indicator because of the rapidity with which they calculate trends, making them perfect for projecting how price action will unfold over the coming days. The “weight” factor represents the weight of each bar during a specified period. The WMA algorithm smoothens out data, making it easier for traders to trade proactively.
Who Created the Weighted Moving Average (WMA)?
John J. Murphy, a financial analyst in New York, devised Weighted Moving Averages. While moving averages have been employed in the stock market for over a century, the WMA indicator was first proposed in 1999 in J. Murphy’s thesis “Technical Analysis of the Financial Markets”, which was later published in the Journal of the New York Institute of Finance.
Murphy contended that the financial markets lacked a moving average that emphasized current data. The existing MA indicators provided lagging data, whereas this indicator could predict trends as they were happening at the moment. It is currently one of the most used moving average indicators.
Weighted Moving Average Calculation
All main trading platforms, including TradingView, MetaTrader, and Ninja Trader, offer the Weighted Moving Average for free. As a result, most traders are comfortable deploying it without the necessity for computations.
However, those who want to learn its calculation should know that calculating it is a multi-step procedure that allocates a weighting factor to different data points according to their chronological order. The sum of the weight must be equal to 100% or 1. This procedure permits the weighted average to give more weight to recent prices while still taking into account the past data set.
The calculation of WMA comprises the following steps:
- Choose a Certain Time Period for the Moving Average:
Determining the certain period for your moving average is the first step in WMA calculation. This can be any time period, such as 10 bars, 15 bars, or any other period that matches your trading strategy. An ideal time period begins at 5 bars.
- Determine Weights:
After identifying the time frame for the moving average, assign weights to each data point within the selected time frame. As you go further back in time, the equivalent weighting factor normally drops, and the weighting technique is to count the number of periods and put them together. The overall weight for a 5-period WMA is 15 (i.e., 5 + 4 + 3 + 2 + 1). We give more weight to the most recent data point (5/15), followed by the second most recent data point, which has a weight of 4/15. Weights are gradually reduced for subsequent data points.
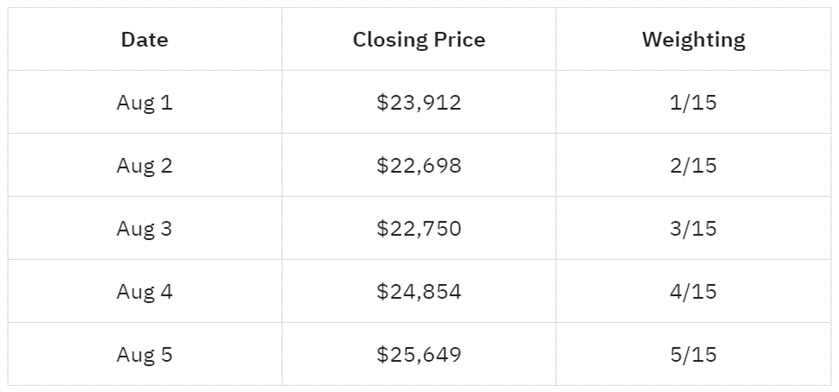
- Multiply Each Data Point by the Weighting Factor
After calculating the weight for each data point, multiply them from 1 to 5 by the corresponding weighting factors and then add the resulting values. For example, if you are computing a 5-day Weighted Moving Average for Bitcoin that had the following closing prices, here is how its weighting is measured:
The formula for WMA is

Where N denotes the time period.
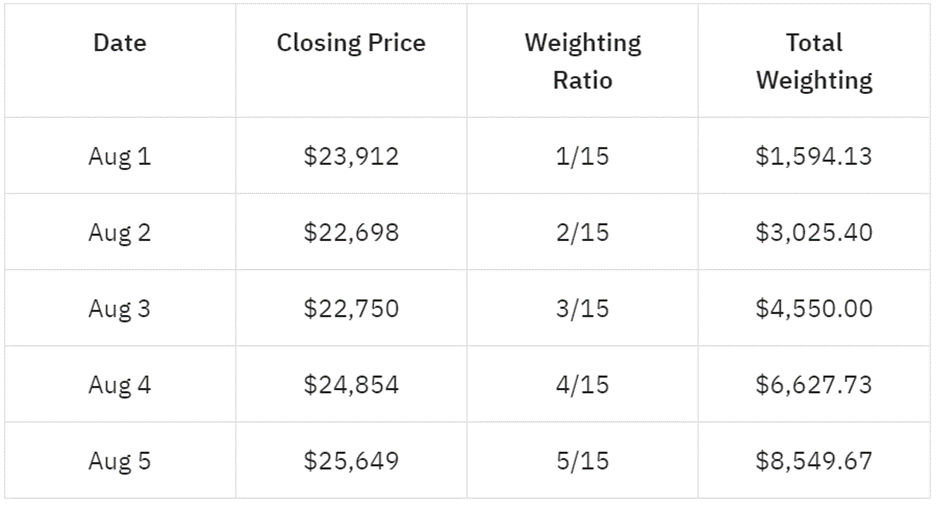
- Add up the Weighted Values to Obtain the Weighted Average
The final step is adding up the total weighted values computed in the previous step to get the weighted values that comprise the WMA.
WMA = $1,594.13 + $3,025.40 + $4,550.00 + $6,627.73 + $8,549.67
WMA = $24,346.93
Repeat the aforementioned processes for the new data set to compute the WMA for the following period as new data becomes available. The weighted values and their sum should then be updated correspondingly.
How to Interpret the Weighted Moving Averages?
The WMA can be interpreted in a variety of ways by traders. For instance, determining trend direction and intensity or the possibility of a trend reversal.
Identifying Trends
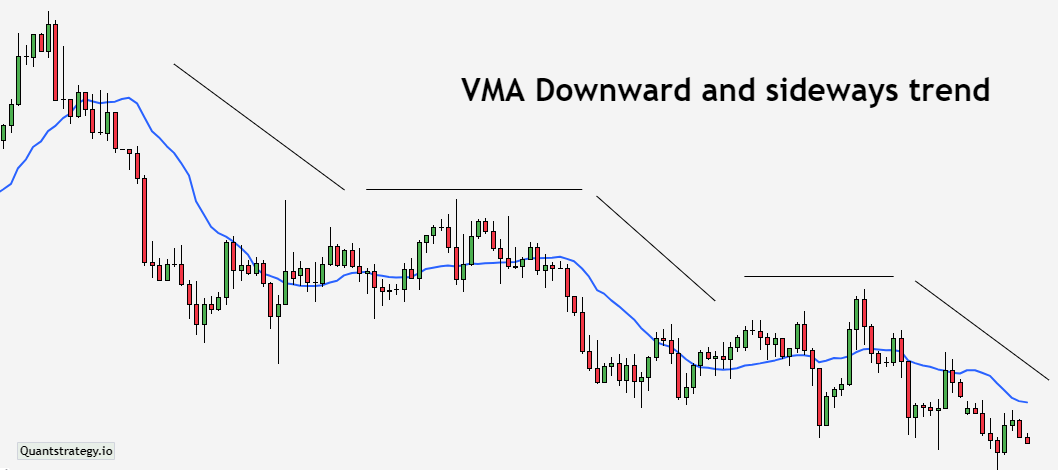
When the Weighted Moving Average (WMA) line on the chart points higher, it signals an upward trend. A downward-pointing WMA line implies a downward trend. If the WMA line remains flat, it indicates a sideways trend.
Trend Strength
If an asset’s current price rises above a rising WMA, it depicts the upward trend is currently stronger than average. Similarly, if the current price is lower than a rising Weighted MA, it indicates that the price strength is weaker than average.
Downtrends can be interpreted similarly, but since they are more volatile, a longer time setting on the WMA indicator could help to capture a price movement better. In a downtrend, for example, traders can employ a 50-period WMA rather than a 20-period WMA.
Trend Reversals
The price crossing above the Weighted Moving Average is the first indication that a trend may be reversing.
This is proved when the price stays above the WMA while the WMA begins to slope in a new direction, for instance, from up to down or from down to sideways.
How to Use Weighted Moving Average in Trading
Weighted Moving Averages can be used to assist traders in determining whether to buy or sell stocks depending on how they respond to changing market conditions. It can be used to spot trend reversals as well as support and resistance areas.
In addition, two or more WMAs of varying lengths can be combined to create a more comprehensive Weighted Moving Average forecasting approach.
Crossover Signals
When more than one WMA is applied, the two lines can provide crossover signals, indicating a possible shift in trend. To employ the WMA crossover approach, two WMAs of varying lengths must be picked.
The chart below illustrates the 50-WMA crossing over the 100-WMA.
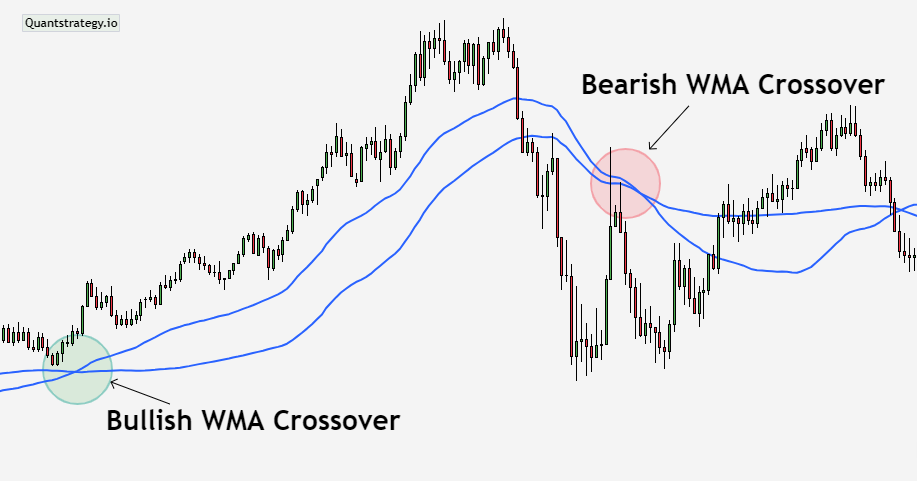
Traders might look for cross-overs of the short-term WMA over the long-term WMA as a sign that the trend has altered. The crossover itself occurs after the trend has altered, providing a late verification of what has occurred with the price action.
Support and Resistance
During an uptrend, the WMA indicator, like an uptrend line, can be employed as a dynamic support level. During a downtrend, the WMA, like a downtrend line, can be utilized as a moving level of resistance.
WMAs don’t generally function as reliably as the WMA forecasting example below when the 100-day WMA supported a months-long uptrend, although the price bounced off it multiple times.
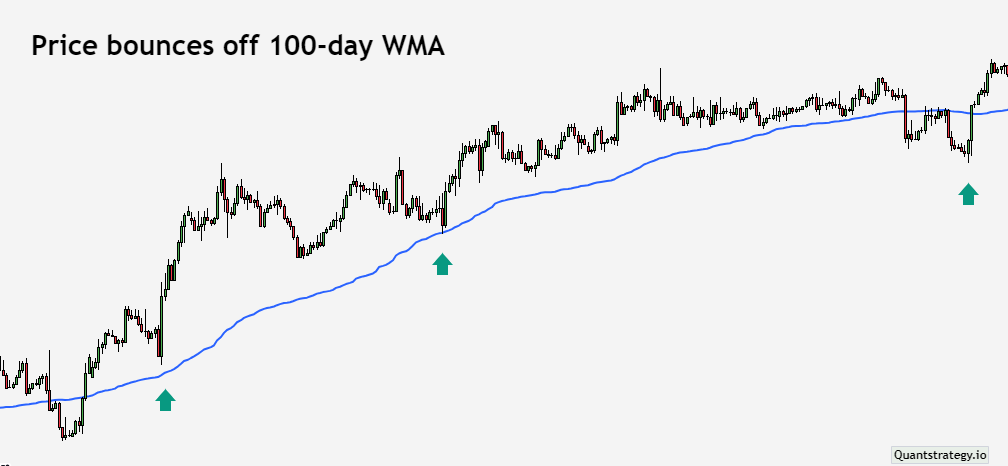
This WMA strategy can be used by traders to take buy signals near a rising WMA line or sell signals on a falling WMA line. Place a limit order at the Weighted Moving Average or wait for the price to hit the WMA and close on the right side of it for added confirmation.
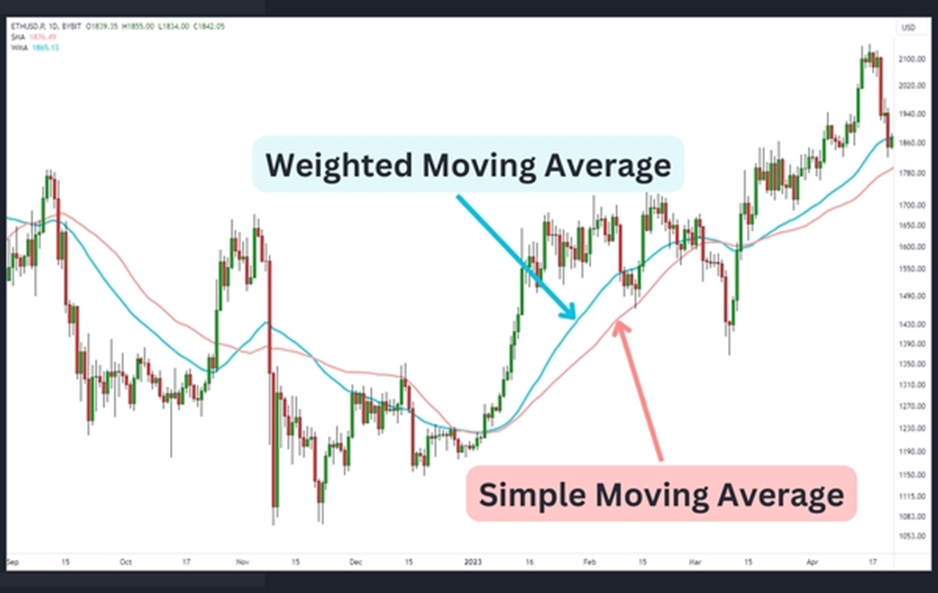
Simple Moving Average vs. Weighted Moving Average
Weighted Moving Average and Simple Moving Average are two commonly employed technical indicators in chart analysis and trading, each with its peculiar traits and applications.
The main difference between the two lies in their weighting techniques, where WMA assigns different weights to data points with the most recent prices given more weight than those in the distant past, and SMA considers all data points equal.
While the WMA is more responsive to recent price moves, the SMA lags. As a result, SMA provides a smoother depiction of longer trends and is generally chosen for longer-term examination.
Limitations of WMA
The WMA is a valuable technical analysis tool for spotting trends, crossovers, and support and resistance levels. However, the usefulness of this technical indicator is limited. One drawback is the requirement to select the appropriate period for computing the moving average. A shorter time will be more responsive to price swings, whilst a longer duration will smooth out price movements. Another limitation is the likelihood of a false trade signal in volatile markets. During instances of excessive volatility, WMA might generate false signals, leading to poor trading decisions. As a result, it is critical to utilize WMA in conjunction with other indicators to verify signals and limit the possibility of false signals.
Conclusion
The Weighted Moving Average (WMA) is a common technical analysis tool that traders use to detect market trends, possible support and resistance levels, and trade entry and exit points. When compared to Simple Moving Average or Exponential Moving Average, the WMA gives greater weight to recent price data, making it receptive to current market conditions and suitable for short-term trading strategies. The formula is based on recent price points, providing it an edge over other indicators by sifting out historical price patterns. However, traders should be mindful of WMA’s limitations, such as the requirement to select the appropriate time period and the likelihood of misleading signals in volatile markets. Overall, WMA is a powerful technical analysis technique that can assist traders in making better-informed trading decisions.


