

Technical traders frequently start the price analysis (Technical Analysis) process with moving averages. It frequently serves as one of the primary indications traders add to their graphics and charts and may be used both independently of other indicators (technical indicators) and in comparison with them.

What is the Moving Average?
“Generally, a moving average is a TA (technical indicator) that professional investors utilize to foresee the direction of a trend. The term “moving” is used in its name because it keeps oscillating and changing depending upon the current/latest data”
The standard value of a futures contract or stock over a predetermined period is known as a moving average. One moving average can be added by traders, or many time frames can be displayed on a single chart.
For instance, the mean closing price of the CL trade over the previous 14 days would be the 2-Weeks moving average of CL WTI futures.
Understanding the Basics of Moving Averages
A stock’s trend direction can be found by calculating a moving average, as well as a stock’s resistance levels and support. Because it is reliant on previous prices, it is a lagging indicator or trend-following.
The latency increases with an increasing moving average period. Since a 200-day MA adds prices for the previous 200 days, it will lag significantly more than a 20-day MA. Long Term Investors and traders frequently monitor the 50-day and 200-day MA values, which are regarded as crucial trading signals.

Depending on their trading objectives, investors can select several periods of differing lengths to compute moving averages. A relatively long moving average is more suitable for long-term investors, whereas shorter MAs are often utilized for short-term trading.
While it is difficult to predict how a particular stock will move in the future, using technical research and technical analysis can help with forecasts.
The securities are in an upswing if their moving average is increasing, whereas a downtrend is indicated by a moving average that is decreasing.
A bullish crossing, which happens when a short-term moving average crosses above long-term moving average, confirms upward momentum. In contrast, a bearish crossover—which happens when a short-term MA crosses below a long-term MA—confirms downward momentum.
Major Types of Moving Averages that Every Trader Must Know
The six different types of moving averages that stock market traders utilize are listed below:
Simple Moving Average – SMA
Exponential Moving Average – EMA
Weighted Moving Average – WMA
Double Exponential Moving Average – DEMA
Triple Exponential Moving Average – TEMA
Least Square Moving Average – LSMA
Simple Moving Average – SMA
“Simply put, Simple moving average represents the average price throughout the given time frame.”
Simple Moving Averages is a set of moving averages that may be computed by adding the most current data points to a collection and then averaging the results.

Traders use the SMA indicator to produce signals for when to buy or sell a stock.
An SMA is a (technical indicator) lagging indicator since it is dependent on historical price data for a specific time that may be calculated for several price kinds, including open, high, low, and close.

This indicator is used by traders to determine buy and sell signals for equities and to help locate areas of support and resistance levels.
Exponential Moving Average – EMA
“An exponential moving average (EMA) is a sort of moving average (MA) that gives the most recent data points more weight and relevance. The exponentially weighted moving average is another name for the exponential moving average.”
The other sort of moving average is the exponential moving average (EMA), which is more responsive to current data points and gives greater weight to the latest recent price points.
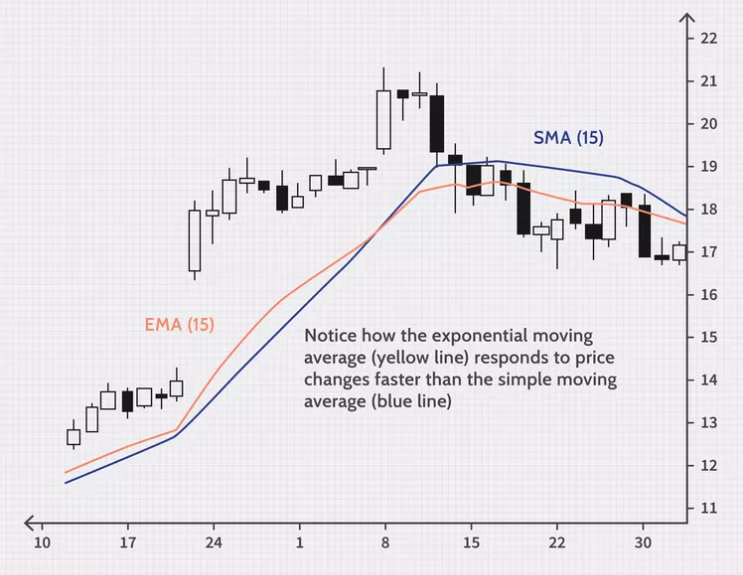
When opposed to the SMA, the EMA is more sensitive to recent price fluctuations.
Calculating EMA involves the following three steps:
-
To start, we must figure out the periods of exponential moving averages.
-
The factor for calculating exponential moving averages must then be calculated.
-
In the final phase, the price, multiplier, and EMA value from the previous period are used to calculate the current EMA by taking the time between the starting EMA and the most recent time. The equation is:
Current EMA = [Closing Price – EMA (Previous Time Period)] x Multiplier + EMA (Previous Time Period)
Weighted Moving Average – WMA
“A technical indicator that traders use to determine trade direction and whether to buy or sell is the weighted moving average (WMA).”
Another type of moving average used by traders to determine trade direction and buy/sell decisions is the WMA.
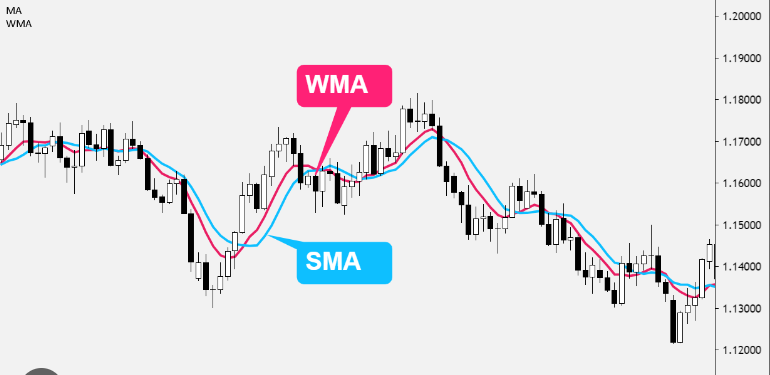
Recent data points are given more weight, whereas older data points are given less weight. Each data point in the set is multiplied by a weighting factor to calculate it. The weighted average is used by traders to produce trade signals. For instance, it indicates an uptrend when prices are higher than the WMA.

However, if the prices are lower than the weighted moving average, it means the trend is downward.
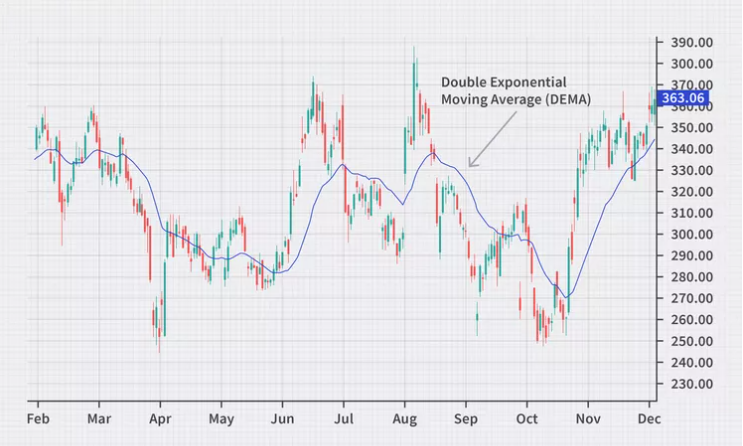
Double Exponential Moving Average – DEMA
“The Double Exponential Moving Average (DEMA) is a famous technical indicator used to cut down the lag in the conventional moving average.”
A technical indicator that can be used to spot a probable uptrend or decline in the price of a stock or other asset is the double exponential moving average (DEMA).
Since DEMA gives the most recent data points greater weight, it is an upgraded form of EMA. It has less lag and is more responsive, which aids short-term traders in immediately identifying trend reversals.
A technical indicator called the double exponential moving average (DEMA) was developed to lessen the lag in results that a standard moving average produces. It is used by technical traders to reduce the “noise” that might skew the movements on a price chart.
The DEMA is used, like any moving average, to show the trend in the price of a stock or other asset. The trader can identify an uptrend—when the price travels above its average—or a downtrend—when the price falls below its average—by monitoring the price over time.

When the price passes the average, it can indicate a trend change that will last for some time.
Triple Exponential Moving Average
“The triple exponential moving average (TEMA) is a trend-following indicator that responds swiftly to price changes by combining multiple exponential moving averages (EMA) calculations and subtracting the lag. The TEMA can be used to determine trend direction, alert to probable pullbacks or short-term trend adjustments, and offer support or resistance.”
TEMA shortens the delay of EMAs and increases their responsiveness to price changes. Patrick Mulloy developed the Triple Exponential Moving Average (TEMA) following the 1994 invention of the Double Exponential Moving Average (DEMA) (TEMA).
The TEMA lessens the lag gap between various EMAs, just like the DEMA.
The key distinction between DEMA and TEMA is that, in parallel to the single and double-smoothed EMAs used in the DEMA calculation, TEMA’s formula also utilizes a triple-smoothed EMA.
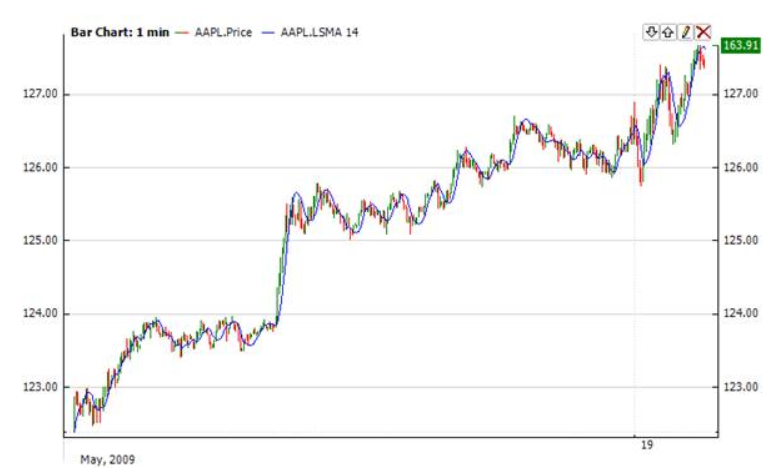
Least Square Moving Average – LSMA
“Like the other moving average kinds, LSMA aims to eliminate much of the noise present in the primary type of MA. Simple is the aim. People assume that every period is equal when calculating the simple moving average. Because of how it is calculated, the least square moving average is more complicated than the other average kinds. For earlier periods, it determines the least squares regression line.”
As a trend and reversal indicator, the Least Squared Moving Average (LSMA) or Linear Regression Moving Average can be utilized. It is a technique for technical analysis that analyses historical market information, including price and trading volume, and uses it to forecast the price direction of an asset in the future.

As was already mentioned, the Moving Average is modified by the LSMA (MA). The average trading price of a specific asset over some time is used to calculate the MA. The LSMA indicator, on the other hand, is focused on the least-squares approach. This is one of the most widely used technical indicators among other technical indicators.
Why Does A Professional Trader Use a Moving Average?
Technical analysis, a subset of investing that aims to comprehend and profit from the price motion patterns of securities and indexes, frequently employs moving averages. Heading averages are typically used by technical analysts to determine whether a security’s momentum is changing, such as if its price is suddenly moving downward.
Sometimes they will employ moving averages to back up their hunches that a change is possibly taking place.
Why Moving Averages are Used?
A moving average is a measure that depicts the typical change over time in a data series. Technical analysts in finance frequently utilize moving averages to monitor price patterns for certain stocks. While a negative trend would be interpreted as a sign of deterioration, an upward movement in a moving average could indicate an increase in the price or momentum of an asset.

Technical analysis, a subset of investing that aims to comprehend and benefit from the price motion patterns of commodities and indexes, frequently employs moving averages.
Heading averages are typically used by technical analysts to determine whether a security’s momentum is changing, such as if its price is suddenly moving downward. Sometimes they will employ moving averages to back up their hunches that a change is possibly taking place.
The Definition of MACD
The moving average convergence divergence (MACD), which is computed by deducting a 12-day exponential moving average from a 26-day exponential moving average, is used by traders to track the connection between two moving averages.
In addition, the MACD makes use of a signal line, which is itself a nine-day exponential moving average of the MACD line plotted on the same graph, to aid in the identification of crosses. The signal line is used to confirm the strength of a trend and to identify changes in price trends for securities.

The short-term average is placed above the long-term average and indicates upward momentum when the MACD is positive. The momentum is moving downhill when the short-term average is lower than the long-term average.
Golden Cross
A short-term moving average crossing above a long-term moving average forms a golden cross on a chart. A crossover between a security’s short-term moving average, such as the 15-day moving average, and its long-term moving average, such as the 50-day moving average, results in a pattern known as the “golden cross,” which is a bullish breakout pattern.
The golden cross, which is supported by huge trade volumes, signals the impending start of a bull market and is more significant than short-term signs.
A Few Drawbacks of Moving Averages
Moving averages are computed using past data, and the process itself is not predictive in any way. As a result, outcomes from utilizing moving averages may be arbitrary. The market sometimes appears to obey MA support and resistance levels and trade signals, and other times it doesn’t.
One significant issue is that choppy price movement can cause the price to bounce back and forth, leading to many trend reversals or trade signals.
When this happens, it is better to take a break or use a different indication to assist define the trend. When the MAs become “tangled up” for a while, the same thing might happen with MA crossings, resulting in several lost transactions.
How to Identify Entry & Exit Points Via Moving Averages?
Due to its lagging nature, it will warn you after a certain amount of loss. not earlier like in the case of RSI. The moving average depicts the average investor expectation throughout the specified time frame. It smoothes a data series and makes identifying trends simple.
It indicates the general trend of the price, not the precise momentum. The investor’s expectations are higher than the share relative to the time under consideration if the price is above the moving average.
Additionally, when the price falls below the moving average, investors’ current expectations for security are lower.

It is obvious that it doesn’t provide a precise understanding, therefore using it by itself is insufficient for confirmation. It should be supported by other patterns and indications.
And it offers you an indicator too late when we already knew prices were falling; as a result, it simply allows us to confirm that prices have fallen below the moving average; in the short term, we shouldn’t hope for miracles.
Conclusion (Key Takeaways)
Price data is made easier by a moving average by being smoothed out and forming one continuous line. This makes it simpler to see the trend. Simple moving average takes longer to respond to price fluctuations than exponential moving averages.
This might be advantageous in some circumstances while sending out incorrect signals in others. Moving averages with a 20-day look-back duration, for instance, will react to price movements more quickly than averages with a longer look-back period (200 days).
Moving average crossovers are a well-liked entry and exit tactic. MAs can also point out potential sources of assistance or opposition.
Moving averages always use previous data and only display the average price over a specified period, even though this may appear to be predictive.


