

Financial markets are complex systems full of quick information and price changes. To not lose way, traders use technical analysis. Technical analysis is based on the notion of historical price data and various other indicators to predict the possible direction of price movements.
This guide will equip you with a powerful TA combination: merging moving averages and Relative Strength Index (RSI) trading strategy. Get to know their top qualities up close, and how they influence each other – and prepare a strategy of trading like no other.
Here’s what we got here:
- Moving Averages: If you draw a smooth line on price changes, that’s probably a moving average. It shows the trend and the support/resistance level.
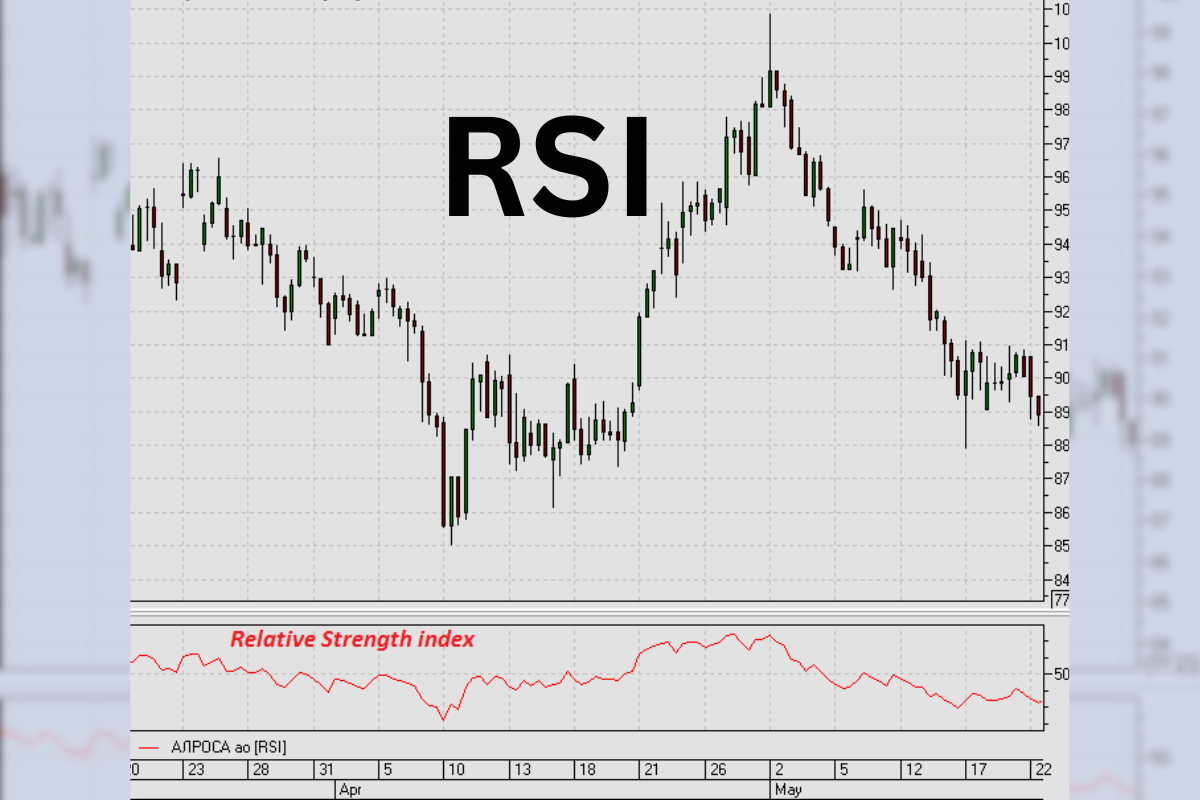
- Relative Strength Index (RSI): Its point is measuring momentum. This technical indicator is mostly used to determine possible overbought or oversold conditions. Pay close attention to when the RSI crosses above or below specific thresholds (70 and 30) – these are potential signals for entry and exit points in your RSI strategy.
Unveiling the Moving Average (MA)
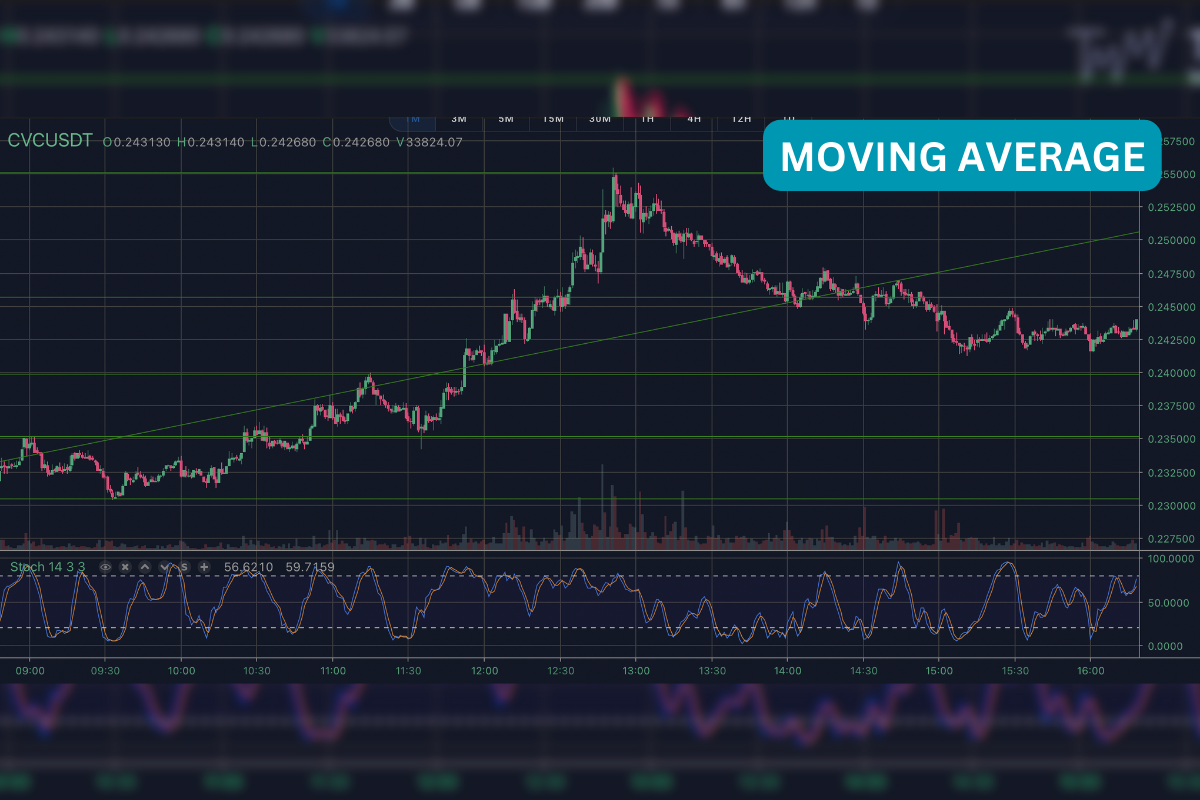
Another major tool is MAs. They are included in the standard analysis package of any trader. Moving averages filter out price fluctuations, abstracting from them and revealing the trend itself. This filter reflects only the main market movement, excluding the “noise” of short-term drops.
Types of Moving Averages
- Simple Moving Average (SMA)
This is the workhorse MA. The simple comprises only average closing prices, often in 50 days.
- Exponential Moving Averages (EMA)
The EMA puts more emphasis on recent prices and is hence more responsive to changing market trends.
How MAs Reveal Trends:
- Upward Trend: A rising MA suggests an uptrend, where prices are generally climbing.
- Downtrend: A falling MA indicates a downtrend, where prices are typically declining.
- Range-bound Market: A sideways MA suggests a range-bound market where prices fluctuate within a specific zone.
Keep in Mind:
- Lagging Indicator
MAs react to past prices, not predict the future. This can lead to delayed signals, especially during volatile markets or trend reversals.
- Trend Strength
One must note that MAs don’t really tell you much about the trend’s strength or momentum.
For the above reasons, moving averages are a powerful tool for identifying, confirming, and maintaining a trend, but even when using multiple, you may not have enough data to understand how strong the trend is.
Unveiling the RSI (All About Momentum)
Another popular technical tool that is usually added to MAs is the RSI which measures as momentum indicators, not a trend. Momentum is another concept of a trend that does not refer to how strong the trend is but how rapidly the price moves.
Behind the Scenes of RSI:
The RSI compares a security’s recent price gains with recent price losses during a specific period that is usually chosen for 14 days. This comparison helps reveal possible overbuy or oversold conditions.
Remember, the exact formula isn’t crucial. What matters is the interpretation:
RSI Reading
Above 70 : Overbought (Consider selling or waiting for a price correction before buying.)
Below 30 Oversold (Consider buying or waiting for a price increase before selling.)
The 70/30 thresholds for overbought and oversold are general guidelines. A stock in a strong uptrend might see RSI consistently above 70 without an immediate correction.
Consider these factors for a more nuanced interpretation:
- During strong trends, RSI can stay in overbought/oversold territory for longer periods.
- Volatile markets can cause RSI to swing more dramatically, leading to false signals (whipsaws).
Advanced ways to combine MAs and RSI
Boost your trading
Moving averages and the Relative Strength Index are great on their own, but how do you get even more out of them? Here are some advanced techniques.
Fine-tuning with MA Lengths
Standard MAs are great, but experimenting with different lengths can reveal more. A short MA will react more to recent price changes – and will thus give you more chances to profit from short-term trends. A long MA perspective broadens the trend view, filtering out price noise.
Divergence: When RSI and Price Disagree
We mentioned RSI divergence earlier. Here’s a closer look:
Bullish Divergence
This is a potential turning point! The price makes a new low, but the RSI starts to trend upward. This suggests a weakening downtrend and a possible price increase.
Bearish Divergence
The price makes a new high, but the RSI fails to follow suit and dips instead. This signals a potential loss of momentum in the uptrend and a possible price decline.
Remember: Divergence is a clue, not a crystal ball. Look for confirmation from other technical indicators or a significant change in price action before making a trade.
Teaming Up with Other Indicators
Combining RSI with other tools can strengthen your strategy:
- MACD (Moving Average Convergence Divergence)
MACD Your magic wand This indicator helps in understanding the trend direction and momentum. It performs best when included with RSI to grasp as much information as possible.
Like RSI, this indicator helps to find overbought/oversold conditions. Comparing the two methods will give a higher chance of detecting when they are likely buying and selling assets.
Risk Management and Backtesting
In the above sections, we have seen how the moving averages can be used in combination with the Relative Strength Index for your trading strategies. Two more essential aspects of risk management and backtesting related to any strategy are now to be discussed.
Why Risk Management Matters in Trading
All strategies run a risk, and the financial market bears considerable hazards. As a trader, putting your capital at risk is not a healthy practice long term. Remember your stop-loss orders. Here are two fundamental risk management tools:
Stop-Loss Orders: Your Safety Net
An order to exit the trade when the stock reaches a certain price level. In simple words, it limits your losses. Please make sure that your stop losses are always levels that fit your risk profile, and based on your trading strategy.
I always recommend thinking it’s your safety net. It will help you exit trades when you start making emotional decisions and make sure That you don’t lose more than you can afford.
Position Sizing
Position sizing is the amount of capital you put into each trade. You do not want to risk a large portion of your capital Taking a small percentage such as 1-2% of the capital on each trade is often how traders position size.
Conclusion
In sum, utilizing moving averages and the RSI indicator provides a robust framework for technical analysis. By leveraging MAs for trend direction and RSI for momentum, you can craft a more well-rounded strategy to identify potential entry and exit points. Remember, successful trading involves risk management, backtesting your strategies, and continuous learning to navigate the ever-evolving markets.


