

There is a lot of data and so many options things to consider when becoming part of the financial markets. However, technical analysis is one way to simplify the situation.
Technical analysis involves studying historical data to make projections about future price developments. Traders use tools called indicators to track trends, spot buying and selling opportunities, and measure the overall market sentiment.
Indicators are not a guarantee of future price developments. You can be trading alongside other methods, like fundamental analysis, to arrive at an informed conclusion about your trades. Finally, this article explains two major technical indicators — Moving Average Convergence Divergence MACD and Stochastic Oscillator. Thus, you will find out more about how they operate and how their implementation can fortify your points!
Unveiling the MACD: A Trend Tracker
Think of it as a two-line compass: the moving averages remove the noise of the stock’s fluctuations, pointing as much as possible in the right direction – but the MACD line itself tells you how strong or weak the stock’s upward or downward movement.
Another key MACD feature is the signal line.
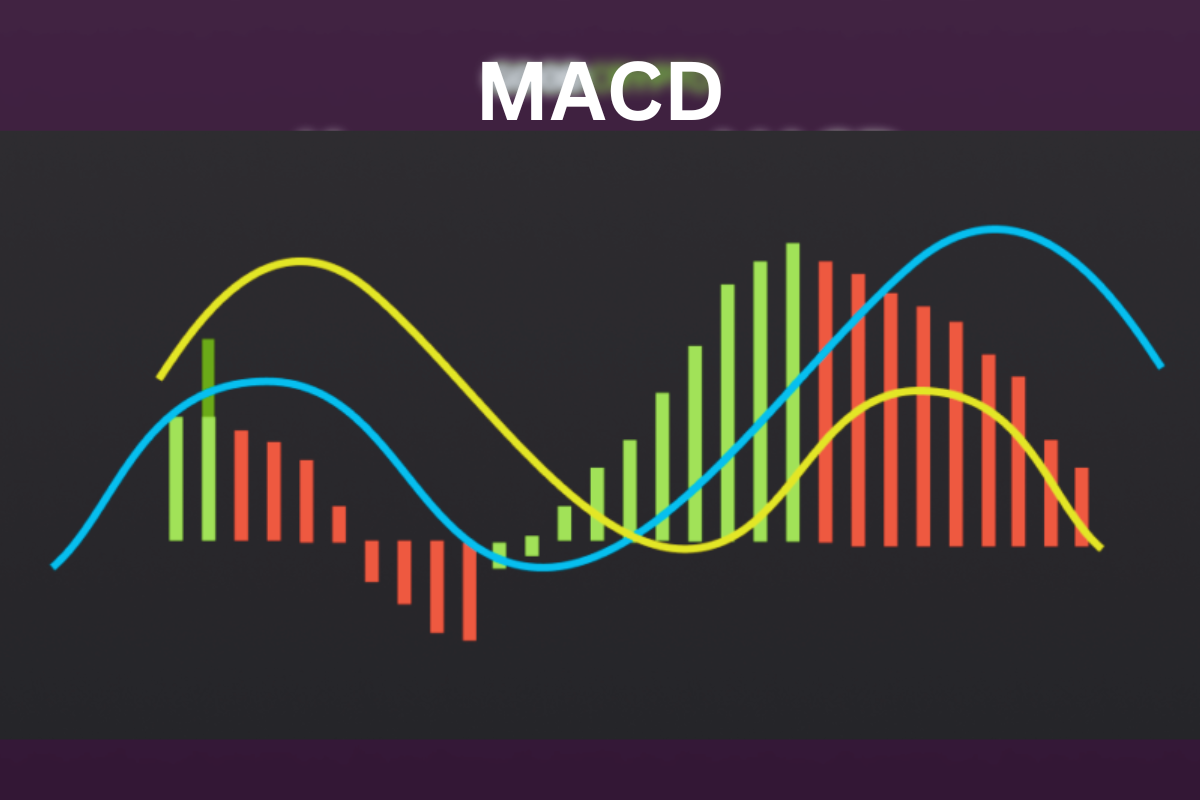
It filters the MACD line, providing a smoothed version and potential buy/sell signals. For instance, if it is “bullish” when the MACD line first changes the signal line upwards, it might happen to indicate an upward trend and a “purchase “.
On the other hand, if “bearish” crosses down, which means the MACD line falls below the signal line, it might happen to signify a downturn and “sell”.
However, remember the limitations. Always use it in conjunction with other analysis methods to develop a well-rounded trading strategy.
Summarizing the MACD signals:
Signal
- Bullish Crossover (MACD line crosses above the signal line) >>
Suggests a potential shift from a downtrend to an uptrend (Buying opportunity)
- Bearish Crossover (MACD line crosses below the signal line) >>
Suggests a potential shift from an uptrend to a downtrend (Selling opportunity)
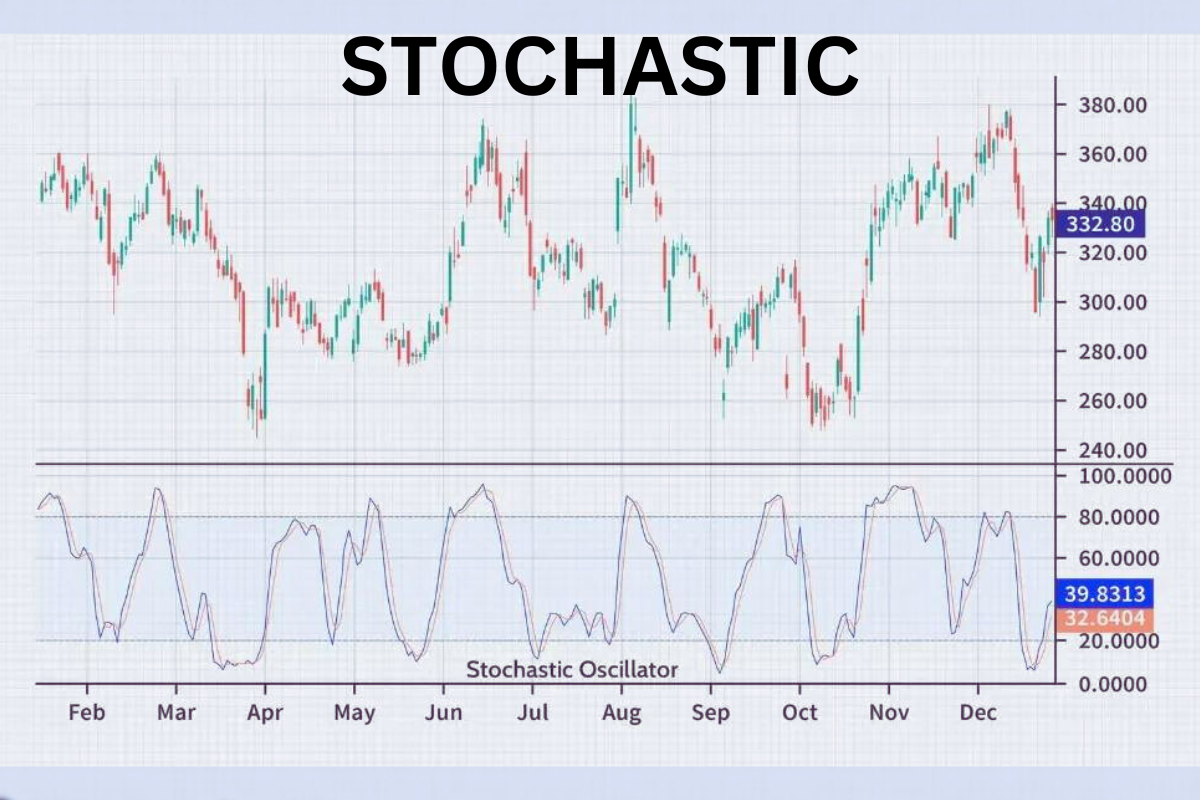
Decoding the Stochastic Oscillator
The last well-known technical indicator helps a trader find possible movement reversals. The MACD shows the trend direction, the Stochastic says the security is overbought or oversold.
Imagine the market like a tennis match. It’s like measuring how strong the serve is. If a player, the stream, makes a strong serve, there is a high probability the trend will go on, and a weak one may signal further movement alteration.
Here is the way it is done:
- Stochastic Oscillator (SO) is used to analyze the stability of a security’s closing price against its recent range.
- A reading of over 80 means that the price is near the most recent highs, signaling that it is overbought”. This indicates a signal to sell.
- Alternatively, the overbought/oversold zones may not lead to an immediate price reversal. This may appear following prolonged overbought and oversold conditions.
A table summarizing the Stochastic Oscillator signals:
Signal
- Overbought (%K and %D above 80) :
Security might be overbought, potentially indicating a price correction (Potential selling opportunity)
- Oversold (%K and %D below 20) :
Security might be oversold, potentially indicating a price increase (Potential selling opportunity)
Interpreting Stochastic Signals:
Therefore, it is necessary to wait for the validation of the signal by other technical indicators or price action before acting.
For instance, if the Stochastic Oscillator overbought is consolidated, but the price continues to grow, then one can postpone the price correction.
- False signals
Alternatively, the overbought/oversold zones may not lead to an immediate price reversal. This may appear following prolonged overbought and oversold conditions.
- Confirmation is key
Thus, this signal should be double-checked with other technical indicators or the price action Sign. If the Stochastic Oscillator overbought consolidation is drawn and the price continues to go up, it means the price’s correction is being postponed.
The Power of Combining MACD and Stochastic
Thus, Stochastic and MACD indicators methods look at the same thing: the MACD looks at the trend’s direction and momentum, and the Stochastic Oscillator – at overbought states.
And when you combine them, you get a stronger trading combination. MACD – facilitator will show us where the trend is – north or south; Stochastic – speedometer will show us how fast the car is moving.
Here’s how combining them benefits you:
- You get a more complete understanding of the market’s sentiment and potential turning points.
- When both indicators generate buy or sell signals in the same direction, it strengthens the overall message.
For example:
- Even though the MACD indicates a bullish crossover implying that the uptrend has just started, the Stochastic Oscillator still shows an overbought signal. It may mean that the uptrend is in the new egg and the price still has a lot of space before it becomes too expensive
- A bullish MACD crossover with the overbought/Stochastic Oscillator signal can be excellent buying.
Combining MACD and Stochastic for Powerful Trading
Strategies We explored the MACD & Stochastic Osc separately: Now it is time to understand how they illuminate each other even further. When combined, the strengths of both can enhance a trading strategy.
MACD: The Trend Navigator
Imagine the MACD as a compass, clearly showing the trend direction (uptrend, downtrend) through its moving averages.
Stochastic Oscillator: The Speedometer
The Stochastic Oscillator is a speedometer: It shows how fast the price is moving in the MACD-identified direction.
Combining for a Clearer Picture
By using both indicators, you gain a more comprehensive understanding of the market:
- Can the Stochastic Oscillator confirm these trend signals? It might. A bullish MACD crossover could be confirmed by an oversold reading from the Stochastic Oscillator meaning that the uptrend still has room to run.
- When both the MACD & Stochastic indicators send a buy signal in the same general direction, your confidence level increases. A bullish MACD crossover above the centerline with an overbought Stochastic a compelling buying opportunity.
Popular Trading Strategies with MACD & Stochastic
Trend Following
The MACD will determine the trend direction, while the Stochastic Oscillator assesses the point at which to enter and exit trades. For example, the purchase might occur when the MACD crosses above its signal line, while the Stochastic Oscillator does the same when it surpasses 80:
Countertrend
This strategy looks for reversals based on divergences. When the price continues to make new highs, but the indicators fail to do so, a divergence occurs. It indicates a weakening uptrend and a potential downside reversal.
Range Trading
In markets with limited price movement, the Stochastic Oscillator’s overbought/oversold signals become valuable for identifying potential entry and exit points within the range, even if the MACD doesn’t generate many crossover signals.
Conclusion
Mastering MACD and Stoch Oscillator takes time and practice. Nonetheless, these tools could be valuable to you on your trading journey should you understand their functioning, limitations, and how to integrate them with other technical indicators and good risk management. Be reminded; that trading is not a one-time event but a marathon, maintaining focus and discipline through consistent learning will help you tackle the dynamic market.


