

Financial markets interest us, but they are also frightening. The opportunity to earn millions of percent attracts you, but at the same time, the whole prize can roll down the wave of prices and crush you for several years. Traders use multiple approaches to price analysis and forecasting; technical analysis is one of them.
In this post, I suggest telling you how the strengthening of the already existing indicators will be beneficial for you: the trading strategy involves two prominent indicators which are the Moving Average Convergence Divergence (MACD) and the Fibonacci retracement (Fibonacci trading tools).
By integrating these two effective tools, you can achieve a better visualization of possible price changes and a higher probability of successful trades.
Understanding Moving Average Convergence Divergence (MACD)
With MACD, you can see more than just liquidity and shifting trends.
The following are the components:
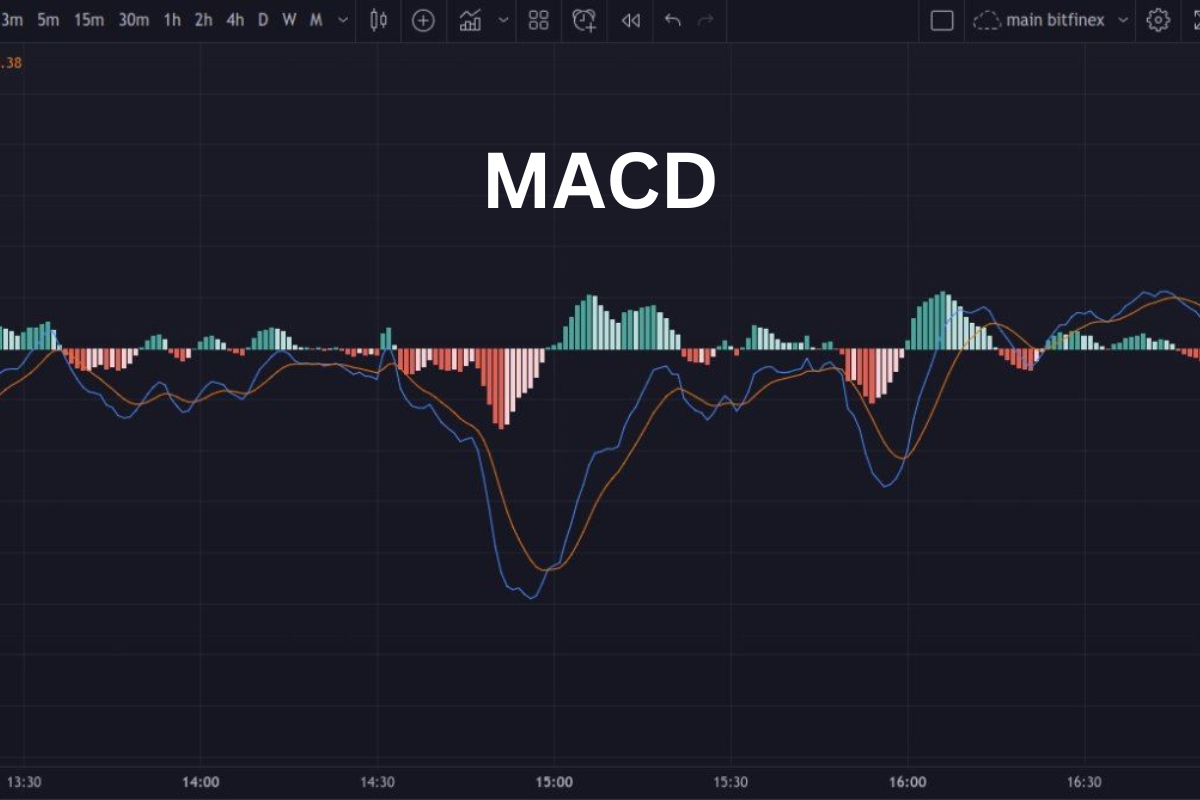
MACD is composed of the following three components:
MACD Line
The MACD line is calculated by subtracting a long-term, exponential moving average from a short-term EMA; it reflects the short-term momentum in the price.
Signal Line
A signal line, which is a signal line – a nine-period EMA of the MACD line, that smooths MACD line oscillations and helps practitioners identify when the MACD line will change.
MACD Histogram
The histogram of MACD, or the difference between the two lines, and the signal line, allows you to see the relative convergence or divergence of the two moving averages.
Interpreting MACD Signals
Traders primarily focus on three key MACD signals:
- Crossovers
The MACD line crossing above the signal line is considered a bullish one, with a probability of an upward rally rising. A bearish one is when the MACD line falls below the signal line. The latter indicates that MACD’s future performance could be weak and even more downward.
- Divergences
A bullish divergence is when the price hits a new low while the MACD line is higher than the one floated during the previous rally. Therefore, there is a high possibility of reversal and a new price bounce. In contrast, a bearish one, when the price achieves a new low but the MACD signal is lower compared to the previous high, may lead to a reversal in the opposite possible.
- Zero Line
The zero line demarcated the place where MACD and signal lines unite. If the crossover occurs above the zero line, it might be considered bullish. In case the situation happens below the line, it may be bearish.
Understanding Fibonacci Retracement
Fibonacci levels are based on the Fibonacci sequence but not a sequence of separation ratio, that is, when the numbers grow from 0, and it is a constant difference.
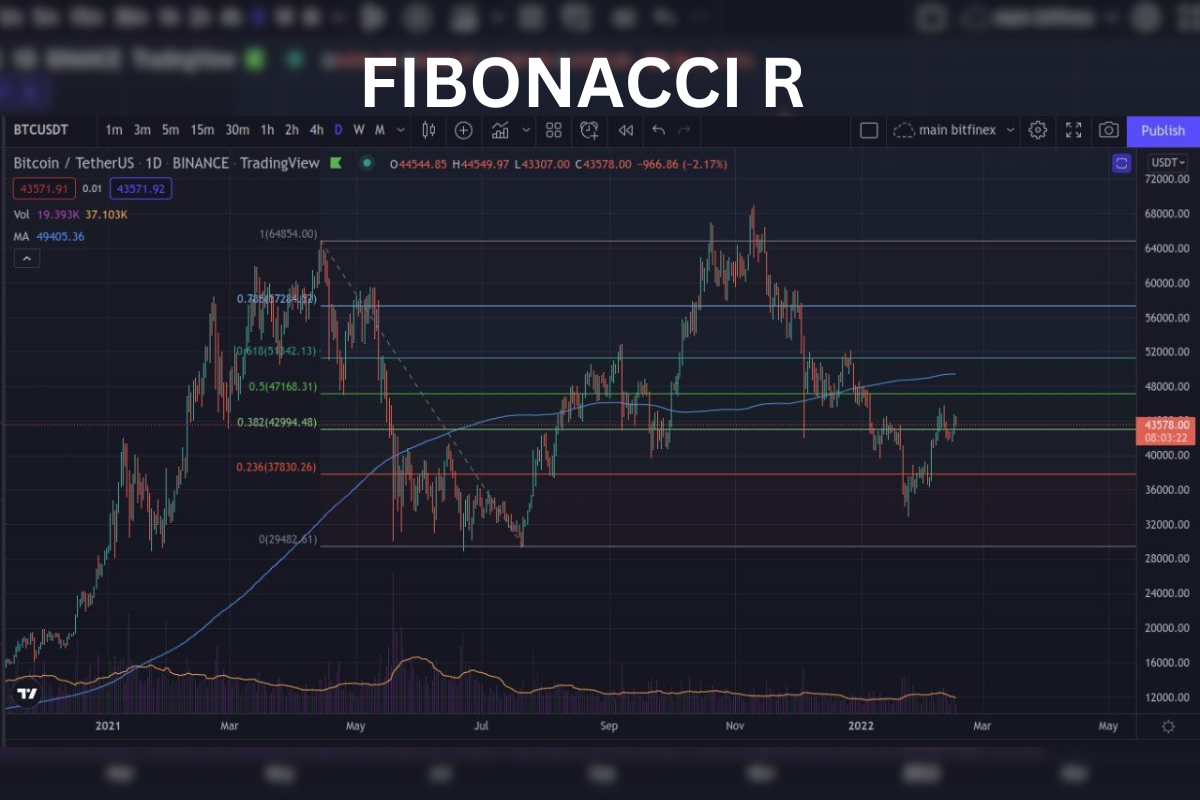
The Fibonacci sequence is a natural number and is created by adding the 1st number frequently by the 2nd number. The primary number is 1, and the Fibonacci sequence has a special number, golden ratio. It’s important to note that these key Fibonacci ratios (most commonly 23.6%, 38.2%, 50%, 61.8%, and 78.6%) don’t represent a sequence of separation with a constant difference. In Fibonacci trading, retracement levels are generated by the golden ratio.
These levels of retracement represent major areas that can make the price stop moving temporarily or reverse back before continuing as it was happening before. The underlying theory of Fibonacci retracement is that Fibonacci ratios act as natural support and resistance in the markets.
This implies that any price movement which interacts with a Fibonacci
Here’s how it works in practice:
- Identify a Strong Trend
The first step involves identifying a clear price trend, either upward or downward.
- Apply Fibonacci Retracement Tool
Most charting platforms offer a Fibonacci retracement tool. You’ll define the starting and ending points of the price swing (usually the high and low of the trend).
- Visualize Retracement Levels
The tool will automatically generate horizontal lines across the chart at the Fibonacci retracement levels (percentages mentioned earlier).
Interpreting Support and Resistance
The tool will automatically generate horizontal lines across the chart at the Fibonacci levels (percentages mentioned earlier).
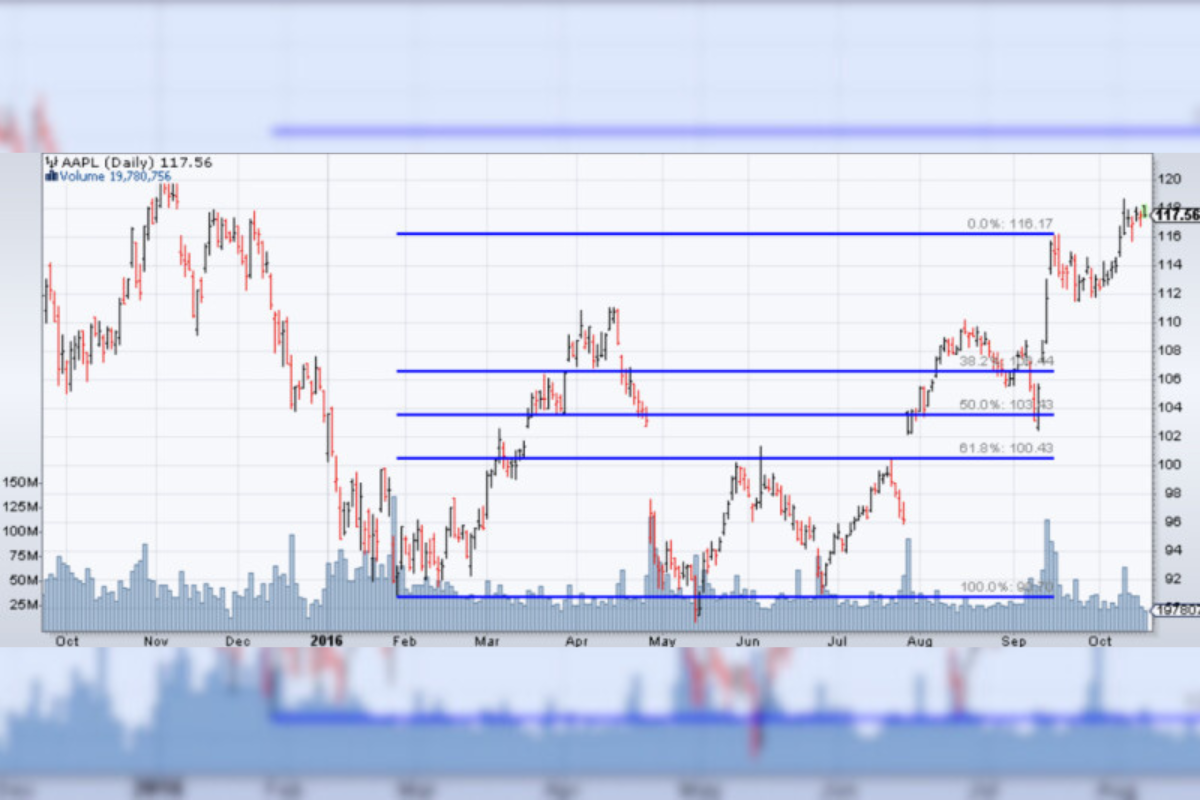
- Support – In the event of an uptrend, the retracement levels, especially 38.2% and 61.8%, can be possible support. If the price declines and rebounds from the buyers’ region, it will continue to rise as part of an uptrend.
- Resistance – The Fibonacci levels, specifically 38.2% and 61.8%, behave as resistance zones in a descending trend. When the price advances and can only give a minor rally and then falls into a sellers’ area, it will stall and continue moving down.
Advantages and Disadvantages of Using Fibonacci in Trading
- Pivot points ensure accuracy. With the right setting, they can accurately determine the moment of price reversal in advance, or confirm a change in trend direction at a later stage.
- Versatility. The tool can be used on any asset in any market and in any timeframe. But there is a warning: the larger the timeframe, the more accurate the signal. Although Fibonacci is a favorite tool for scalpers on M1 and M5, price noise can lead to false signals.
- Accurately displays market psychology. Most technical indicators use formulas that reflect patterns from previous cycles. Fibonacci levels are built based on mathematical algorithms and majority psychology — this can be taken into account when building a Fibonacci trading system.
Shortcoming:
- Difficulty in determining the starting point. A trend cannot be completely flat. Even at the moment of leaving a flat period, it is sometimes difficult to determine the starting point.
- False signals. They appear in this tool and there are a lot of them. These signals are not so much false as inaccurate. The price may reverse without reaching the level or after breaking through it, or it may reverse in the middle of the zone.
- Cannot be used in Expert Advisors (EAs). Automatic grid-building algorithms cannot be written into EA code. Therefore, this tool cannot be used in algorithmic strategies.
Fibonacci grids are an aid that divides the chart into zones. These zones reflect more or less the probability of a corrective reversal or a new trend direction. For example, a corrective reversal is most likely to occur in the 23.6% -38.2% zone. But this is not an axiom. And coupled it with other trend indicators and oscillators, that pay close attention to the formation of patterns.
Combining MACD and Fibonacci Retracement: A Strategic Approach
You would thus have a very powerful tool as not only could it allow you to spot potential trends and shifts in momentum and thus reversal but also potential areas where such a trend is likely to take a breather or reverse. The above is the case when we combine MACD and Fibonacci retracement.
Why Combine These Tools?
Detection of reversal and MACD is a strong momentum on its own as well since it reveals crossovers and divergences for the same. Detection of potential zones of support and resistance can also be gained through Fibonacci retracement. When combined, the two provide a strategic guideline in which to place an order in a trade.
MACD Confirmation for Fibonacci Levels
Consider the Fibonacci retracement levels as possible zones where the price chart will consolidate while the current trend is paused. However, these levels alone don’t guarantee a reversal. This is where MACD comes into play, acting as a confirmation tool.
Bullish Scenario
Upward Trend
Furthermore, price patterns provide a notion of an uptrend on the price chart.
Fibonacci Retracements
Using the Fibonacci R tool and support zones it is possible to utilize not only the 50% but also the 38%. 2% and 61. 8% retracements.
MACD Confirmation
Thereby, one should be waiting for a bullish crossover on the MACD indicator. With the signal line, the difference is surging above.
Bearish Scenario
Downtrend
Thus, it is necessary to find a downtrend on the price chart.
Fibonacci Retracement
The Fibonacci R tool and the support zones allow using not only 50% but also 38.2% and 61.8% retracements.
MACD Confirmation
The bearish signal confirmed after the bull signal is the MACD indicator crossover. Thus, if a MACD line crosses the Signal line, giving a signal below it. This signifies weakening momentum and potential for a downward move.
Advanced Techniques and Considerations
While the basic approach of combining MACD and Fibonacci retracement is powerful, there are advanced techniques and considerations to elevate your trading strategy:
- Timeframes
It all depends on the period you define using the chart to analyze. This is because a MACD bullish crossover on a daily chart has more impact than the one on the 15-minute timeframe. This can be interpreted as an increased probability of the signal being powerful enough to mark a trend change.
- Confluence
The Fibonacci retracement is the ideal place to begin when combining MACD with Fibonacci retracement; however, it isn’t the entire picture. Consider adding other technical analysis indicators such as RSI or Stochastic Oscillator for further confirmation of a potential entry or exit marker. You will have a stronger trading signal the higher the number of indicators that support your trading plan!
- Market Context
While technical indicators are fantastic tools, you should never place trades solely on them. Keep an eye on broader market news as well as economic releases and industry-specific factors that may have an impact on the security you chose.
- Adaptability
Markets are dynamic. Don’t get rigid with your strategy. Be prepared to adapt your approach based on evolving market conditions and confirmation from other indicators.
Conclusion
With MACD and Fibonacci retracement, you have a winning strategy in your decisions in the vibrant world of financial markets. MACD can be used for momentum and trading reversals while the Fibonacci retracement identifies support and resistance zones where you enter and exit your trades with high probability. Remember, this is a powerful duo, but always practice sound risk management and adapt your strategy based on market conditions. Happy trading!


