


While there are numerous technical indicators available in the financial market, Fibonacci retracements have emerged as one of the reliable options for technical analysis.
Brought to western Europe by an Italian mathematician, Leonardo Pisano Bigollo, these retracements were based on numbers created by Indian Merchants. Fibonacci retracement levels were initially created by ancient Indians between 450 BCE and 200 BCE.
Referred to as the Fibonacci retracement tool, Fibonacci lines play a significant role in stock trading.
Traders have to analyze its results together with other technical analysis tools like moving average convergence divergence (MACD), moving averages, trend lines, and volume to make favorable trading decisions.
What are Fibonacci Retracements?
Fibonacci retracements- derived from the Fibonacci sequence– demonstrate support and resistance levels in the financial markets. These horizontal lines show different levels each of which represents a Fibonacci percentage. This percentage indicates the amount of retracement in the price move.
Practically, these levels include 23.6, 38.2, 61.8, and 78.6 (in percentages)- 50 is also included in the Fibonacci sequence irrespective of not being declared as an official Fibonacci ratio.
The Fibonacci retracement tool is critical for situations where it’s necessary to evaluate two price points. When drawn between two price points, it creates vertical distance or levels between them like high and low points.
What is the Role of Fibonacci in Trading?
The term has a lot to do with forex trading and the financial market, but, before getting into its mechanics, it’s important to understand the unique Fibonacci sequence and its properties.
Fibonacci Sequence
Unlike several indicators, it is a mathematical sequence that starts with 0 and 1 followed by the sum of the two previous numbers. The sequence so created is as follows:
0, 1, 1, 2, 3, 5, 8, 13, 21, 34, 55, 89, 144, 233, 377, 619, 987, 1597, and so on.

Upon close examination, experts found some interesting facts about these Fibonacci numbers that play a significant role in Fibonacci retracement in day trading. Let’s have a look at some of them:
-
Divide a number by its previous one, and the result is approximated to 1.618 and is referred to as an element for Fibonacci extensions.
-
Divide a number by its next number, the result is approximated to 0.618, which works as the bases for the Fibonacci retracement level (61.8%).
-
Divide a number by two places higher number to get an approx. value of 0.382. It works as the basis of Fibonacci retracements (38.2%).
Golden Ratio
1.618 is called the Golden Ratio, Phi, or Golden Mean while its inverse is 0.618. Both Fibonacci numbers are commonly found in biology, the cosmos, and nature- particularly in tree branches, population growth, flower petals, human DNA, etc.
But, the question is, how is the golden ratio used as a trade signal? To begin with, these ‘special and unique’ numbers are divided into the Fibonacci extension level and retracement level that indicate possible turning points.
This golden ratio is converted into 3 percentages- 23.6%, 38.2%, and 61.8%. They are 3 widely used and famous percentages while 50% and 78.6% are also in use.
Though, it’s important to understand that 50% is not the Fibonacci number but is still used to correct price movements.
Traders can create retracements through key Fibonacci ratios. They just have to take two extreme points (or a peak and trough) on a price chart and use Fibonacci ratios to draw vertical lines, thereby getting some patterns.
Once identified, these trading patterns are then combined with horizontal lines to identify possible support and resistance levels in the market.
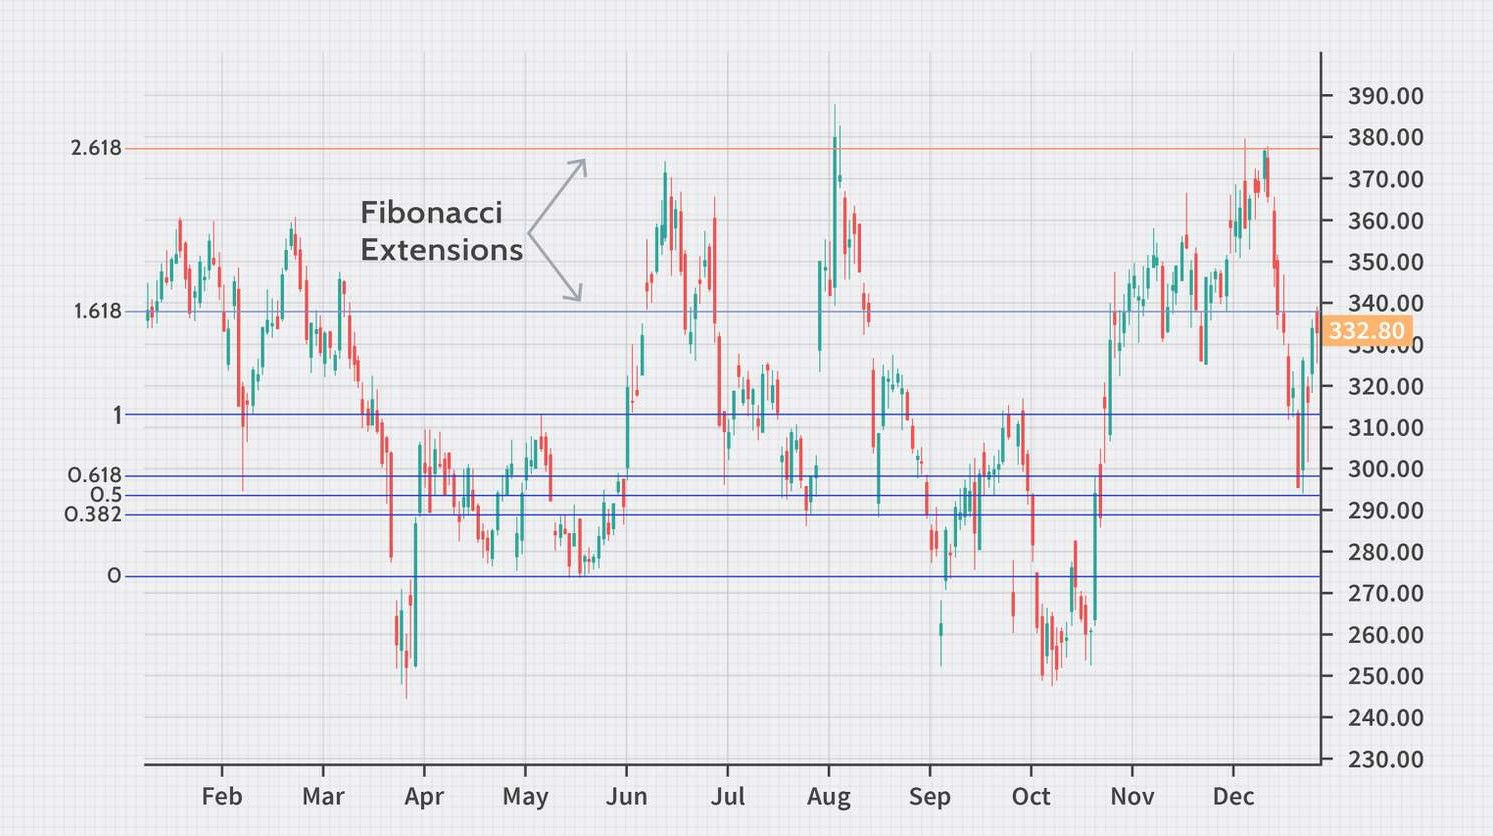
How to Use Fibonacci Extension Levels in Trading?
Apart from their fundamental properties to indicate price levels for support or resistance, Fibonacci extensions are responsible to evaluate the extent to which price may vary against a retracement.
To be more precise, as soon as Fibonacci retracement levels start working on an initial trend, Fibonacci extension levels become active to calculate the end of that market trend.
The formula of Fibonacci Retracement Levels
There are no formulae for Fibonacci retracement levels. Rather, they work on two points that are usually applied to the price chart for technical analysis. Lines are drawn between the two points at certain percentages with respect to the price movements.
For instance, the price of a product takes an upward move i.e. from $10 to $15 and the retracement indicator is drawn between the points, traders will get a 23.6% level at $13.82 (calculated as $15 – ($5 x 0.236) = $13.82).
Similarly, the 50% level will lie at $12.50 (calculated as $15 – ($5 x 0.5) = $12.50).
Application of Fibonacci Retracement Levels
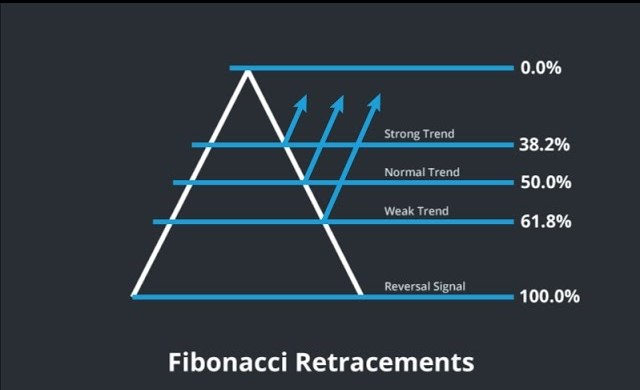
Fibonacci retracement levels are responsible to identify key levels for support and resistance. They also indicate possibilities of reversal to establish entry levels. Their behavior depends on the financial market’s prior price movements- which are discussed below:
-
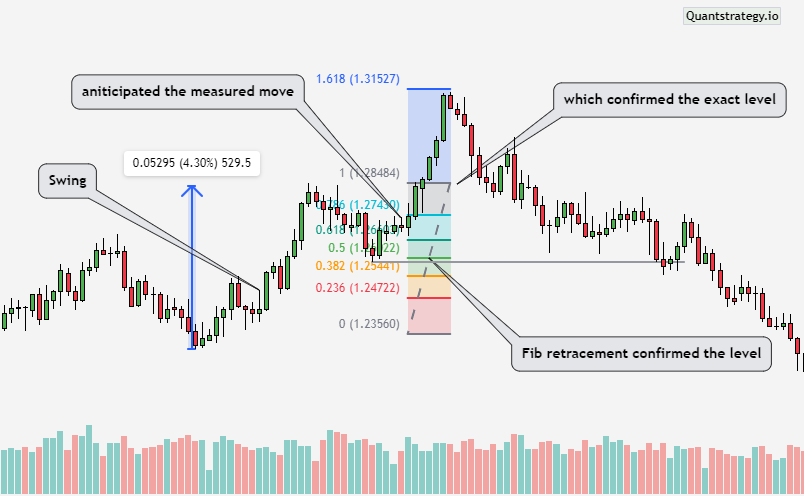
As soon as the price takes a big jump, traders have to identify the reasons and measure the move from the lower to the higher point. They have to do it before it bounces higher or follows the higher trend in order to know where the price could retrace.
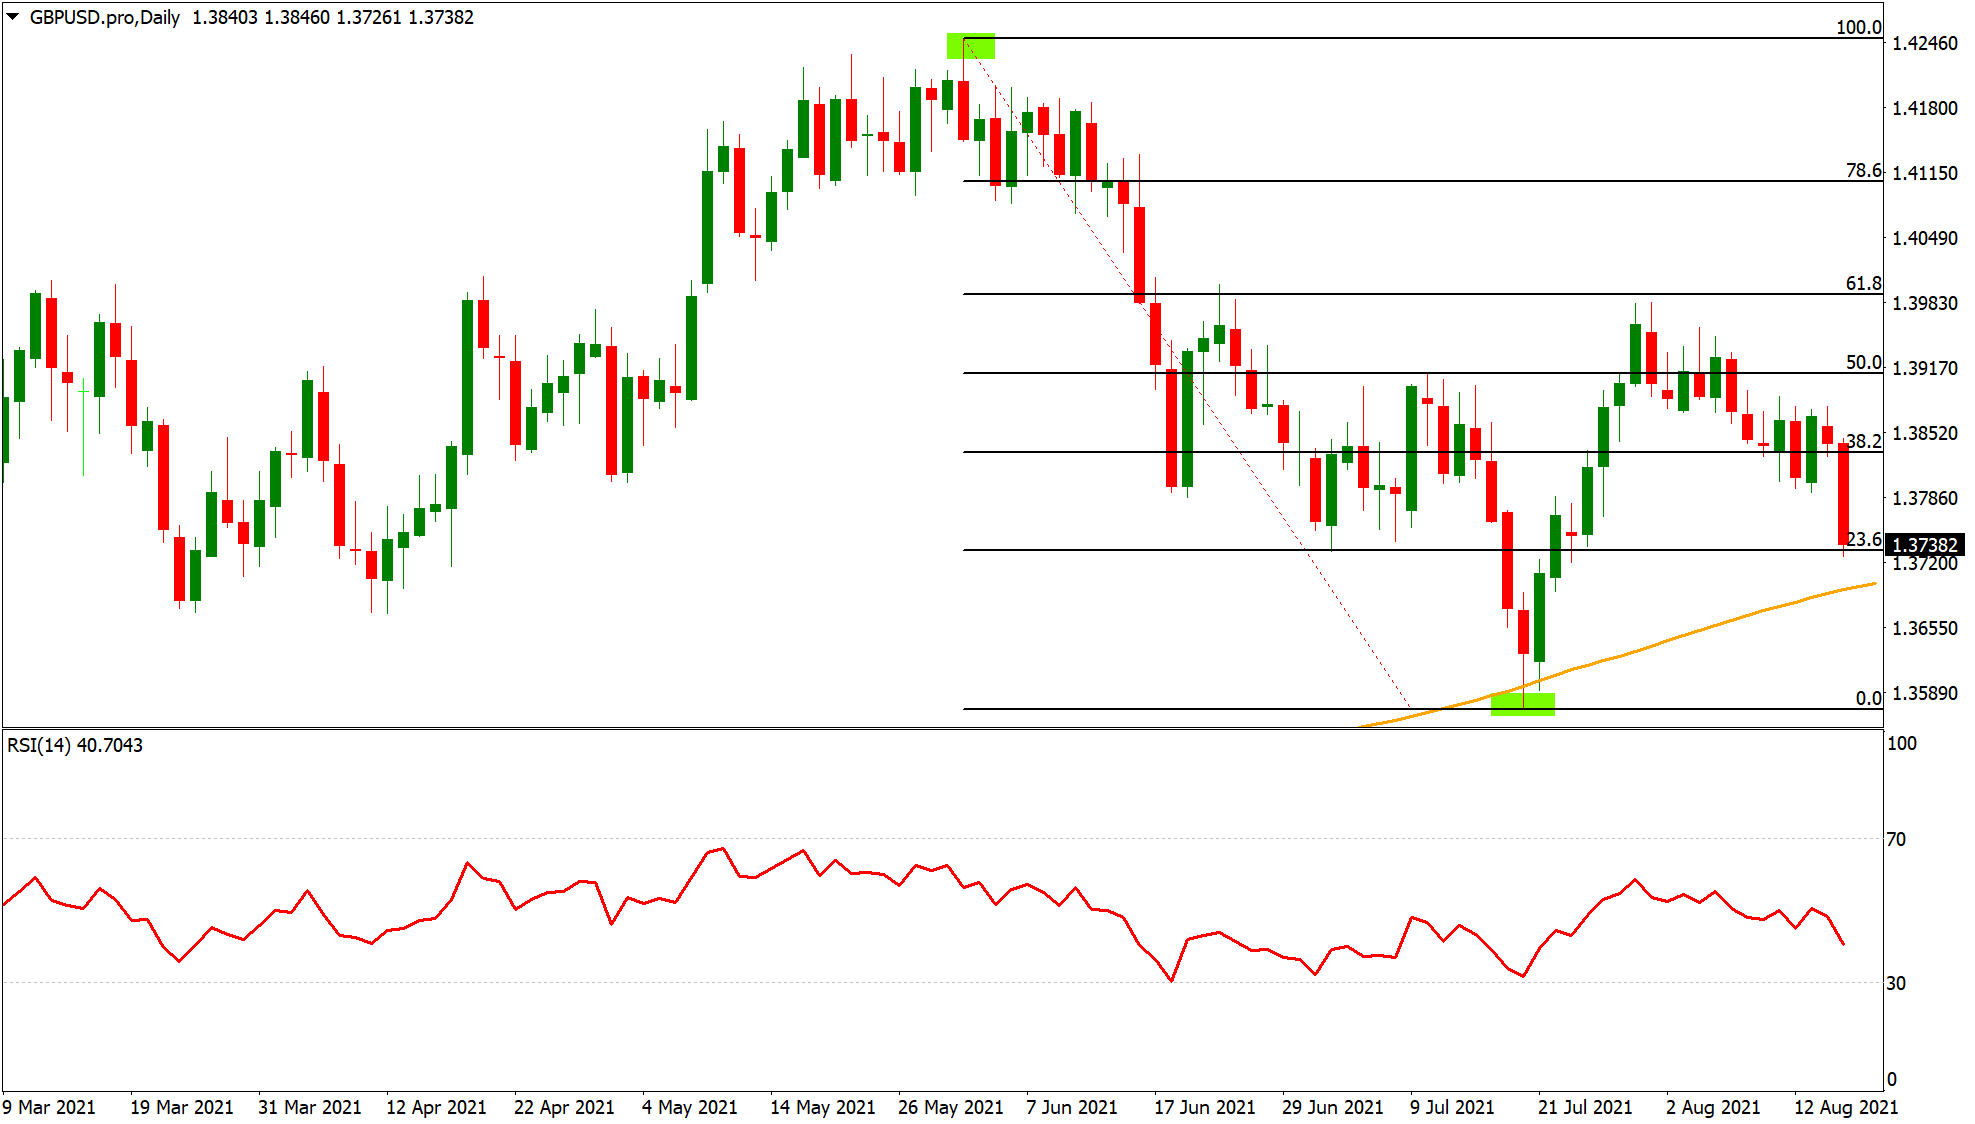
-
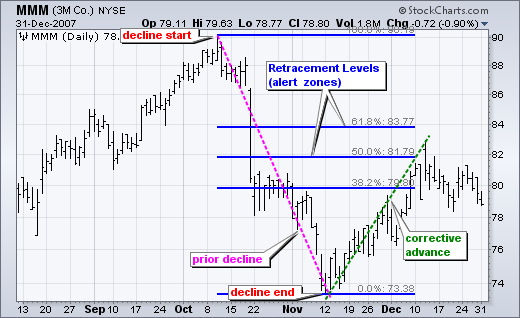
As soon as the price decreases, traders have to identify the reasons and measure the move from higher to lower points. It’s important to do it before correcting lower so that it would be easy to know where the price would retrace.
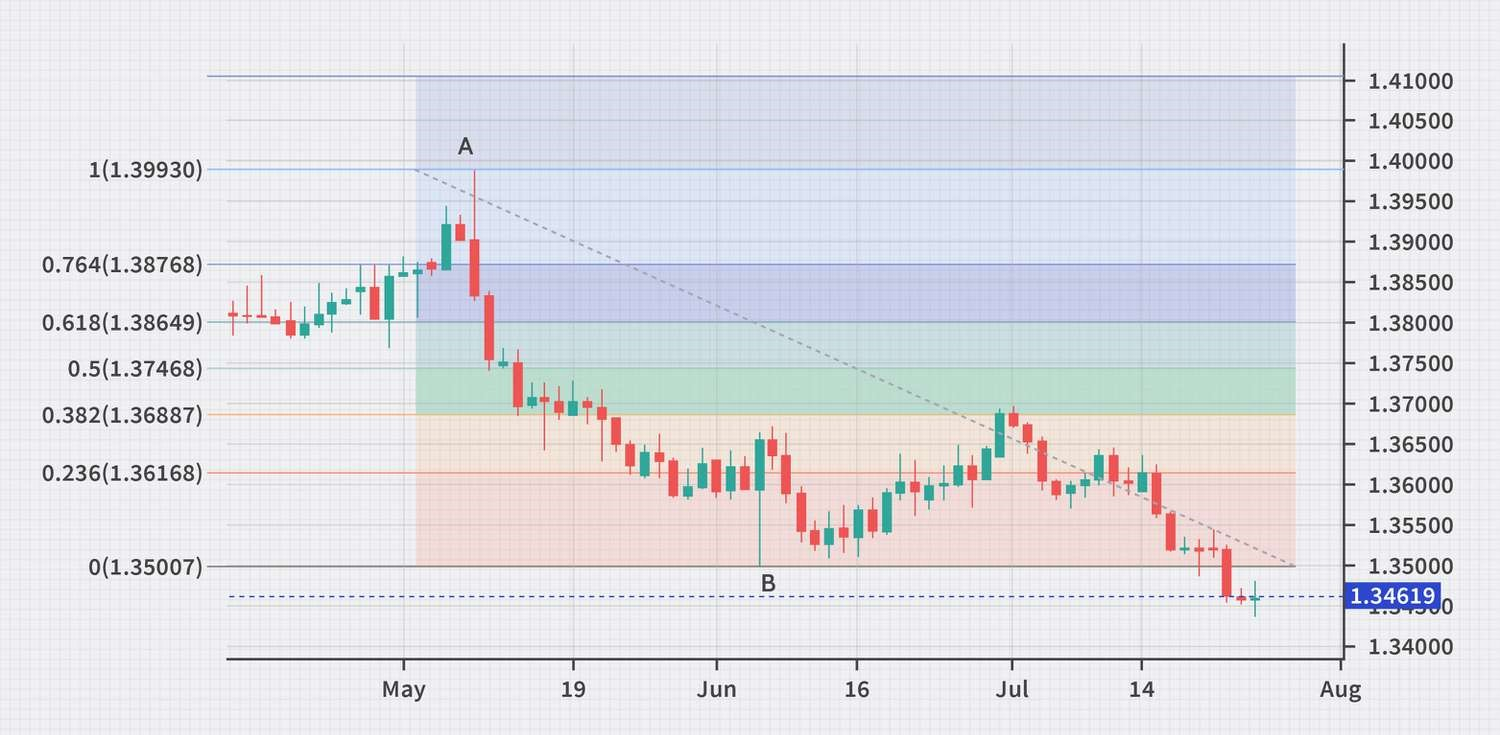
When demonstrated visually, Fibonacci retracement levels are easy to understand. Below are the two trends, which have been discussed above in detail:
Buy and Sell Pattern
As discussed earlier, the Fibonacci sequence is crucial to identify key Fibonacci ratios (like 0.618 forms 61.8 retracement level and 0.382 makes 38.2 Fibonacci retracement levels in percentage).
But, what traders have to know is, there are many trading levels that could contribute to wise decision-making in their trading career. Those additional retracement levels are 78.6% and 23.6%. that could decide buying and selling of a stock or a product.
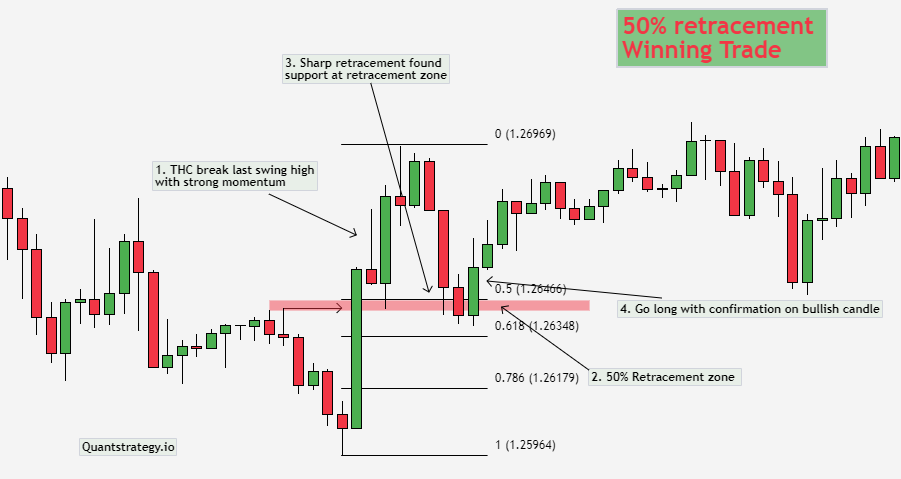
Buy Pattern
It shows an uptrend (traders bounce at point B to know the extent of price movement and calculate retracement from A to B by the time it reaches point C i.e. 161.8%), where traders have to calculate price retracement from point X to point A (i.e. from low to high) before it finds support (B) and bounces higher (C).
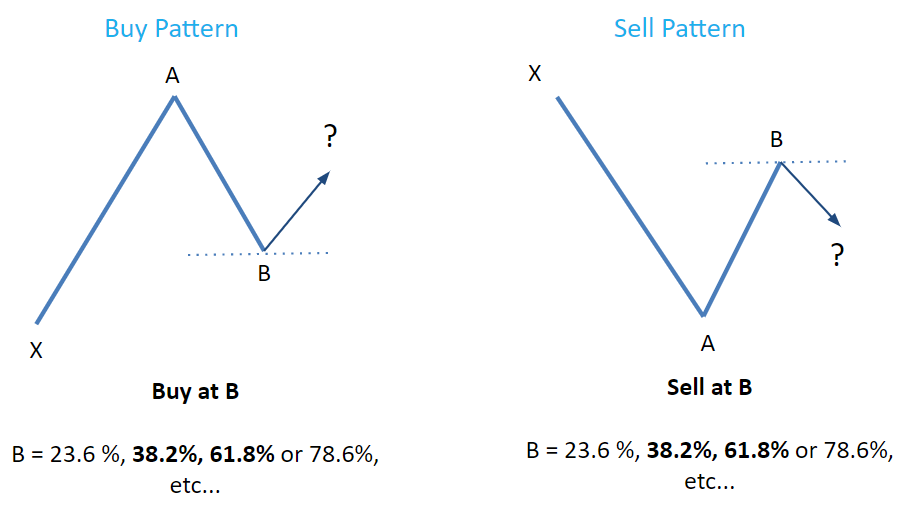
Basically, it’s because of the Fibonacci retracement levels (23.6%, 38.2%, 61.8%, 78.6%) that gave support to the price retracement.
Sell Pattern
It means there is a downtrend (traders enter the correction stage at point B and evaluate retracement between A and B. It helps to know the extent of the situation before it reaches C point i.e. 161.8%) in the market.
Traders try to figure out how much the value has retraced from point X to point A (i.e. from high to low) before it found resistance and corrected back lower. Point B could be any of the retracement levels mentioned above.
To authenticate the findings, traders can also use other technical indicators and price action patterns.
Tried and Tested Fibonacci Trading Strategies
There is a strong relationship between trend-trading strategies and the retracement lines. If the retracement is moving with the trend, be certain to direct the trade in the same direction. Chances are high that the product’s price will bounce in direction of the trend from the Fibonacci levels.
These levels are ideal for traders who are interested to invest in a particular stock but haven’t made a decision at the right time. They have to wait for a pullback situation and analyze results from other indicators to proceed with their interest.
To make this task easier, they can mark key Fibonacci ratios (23.6%, 38.2%, and 61.8%) on a chart and identify potential Fibonacci levels to enter a stable trading position.
Below are some trading strategies that use the Fibonacci tool to derive beneficial results:
-
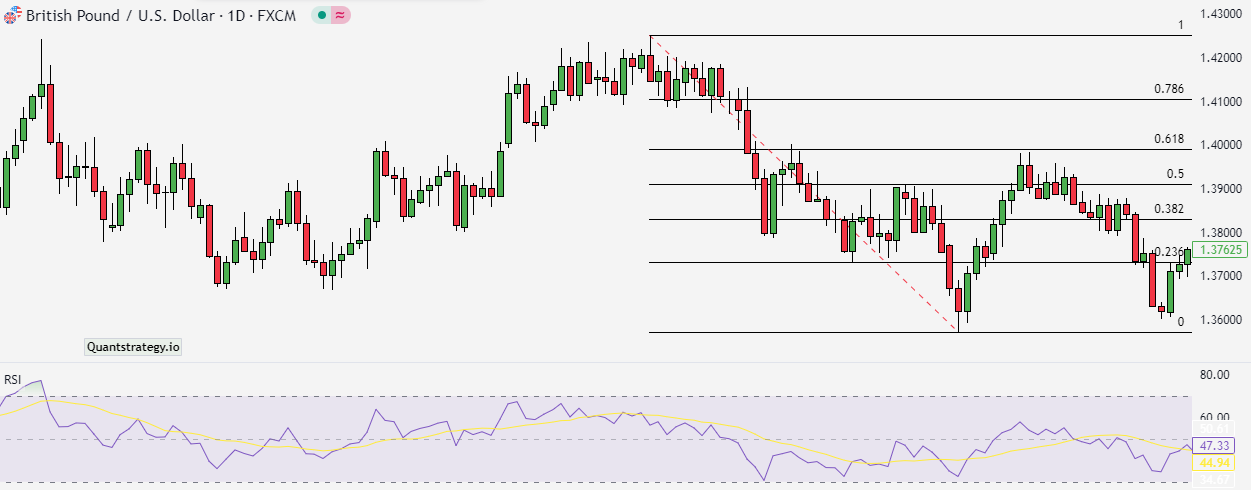
Fibonacci Retracement Lines and MACD Indicator: It focuses on crossing over the MACD indicator as soon as a stock’s price reaches a certain Fibonacci level. As the result, an opportunity opens in direction of the market trend.
-
Fibonacci Level and the Stochastic Indicator: It helps to easily identify oversold and overbought levels. The trading strategies closely analyze key elements from the indicator as soon as the price touches certain Fibonacci levels. When two signals are combined and analyzed, they create an opportunity for many traders.
-
Fibonacci Retracement Levels and Timeframes: These retracement levels are easy to use across multiple timeframes but, have shown proven results across longer intervals. For instance, a 38% retracement drawn on a weekly chart is technically more important than a 38% retracement drawn on a five-minute chart.
Traders just have to experiment with different confirming indicators to identify favorable market conditions, that could eventually increase their profit targets.
Conclusion
Fibonacci retracements are often used to identify the end of a correction or a counter-trend bounce.
Fibonacci retracement levels often work with remarkable accuracy, but they are harder to use than they look in retrospect.
Using these levels you can find low-risk, high-reward entry points. Many traders use Fibonacci levels in higher timeframes with success.
Fibonacci retracement levels can become even more robust when used in conjunction with other technical indicators or signals.


