

Pullback trading is a popular strategy used by many traders to take advantage of short-term price movements. This type of trading involves buying a security when it has pulled back from a recent high or selling when it has pulled back from a recent low. By doing so, traders hope to catch a reversal in price direction and make a profit in the financial market.
Pullback trading can be challenging, as it requires traders to have a deep understanding of market trends, technical analysis, and risk management. However, by implementing effective strategies, traders can increase their chances of success, especially in day trading.
In this article, we will discuss the top pullback trading strategies that you should know.
Types of a market pullback
These pullbacks can take many forms, and traders and investors often use different metrics to classify them. Here are some of the most common types of market pullbacks:
Normal Pullback:
A normal pullback is a temporary decline in price that is relatively small, typically less than 10% from the previous high. These pullbacks are common in healthy markets and are often seen as buying opportunities for investors.
Correction:
A correction is a pullback of 10% to 20% from the previous high. Corrections can occur for many reasons, including economic or political uncertainty, market volatility, or changes in interest rates. These pullbacks are more significant than normal pullbacks, and traders often take a defensive stance during corrections.
Bear Market:
A bear market occurs when the price of a security or asset declines by 20% or more from the previous high. Bear markets can last for several months or even years and are often caused by economic recessions, financial crises, or significant changes in market conditions. During bear markets, traders and investors often reduce their exposure to risky assets and adopt more defensive strategies.
Flash Crash:
A flash crash is a rapid and severe market pullback that occurs over a very short period, often minutes or even seconds. These pullbacks can be caused by a variety of factors, including high-frequency trading algorithms, sudden news events, or technical glitches. Flash crashes can cause panic among traders and investors and can have significant impacts on market liquidity.
Dip:
A dip is a small and short-lived pullback in price that is often caused by market noise or short-term volatility. Dips can be an excellent opportunity for traders to enter the market at a lower price, and they are often followed by a quick rebound in price.
Oversold:
An oversold market occurs when the price of a security or asset declines too quickly and too far, leading to an imbalance between supply and demand. This can cause the asset to become undervalued, and investors may perceive it as a buying opportunity.
Sector Rotation:
Sector rotation occurs when investors move their investments from one sector of the market to another. This can cause a temporary pullback in the sector that is being sold, while the sector being bought may experience a temporary boost in price.
Trading Pullbacks
The basic principle of pullback trading is to buy an asset after it has experienced a temporary decline in price, with the expectation that the price will rebound and continue its upward trend. Here’s how pullback trading works in more detail:
Identify the Trend: The first step in pullback trading is to identify the overall trend of the market or asset that you want to trade. This involves analyzing price charts and using technical indicators to determine whether the market is in an uptrend, downtrend, or sideways trend.
Identify the Pullback: Once you have identified the trend, the next step is to identify the pullback. A pullback is a temporary decline in price that occurs during an uptrend. Pullback Traders use indicators such as moving averages, Bollinger Bands, and Relative Strength Index (RSI) to identify when the price has temporarily retreated and is likely to rebound.
Enter the Trade: Once you have identified trade pullbacks, the next step is to enter the trade and make sure whether it’s a weak trend or a strong trend. This involves placing a buy order at the support level at a better entry price, which is the point where the price is expected to rebound. Traders often use stop-loss orders to limit their losses in case the price continues to decline.
Manage the Trade: After entering the trade, the trader must manage it effectively. This involves monitoring the price and adjusting the stop-loss order if necessary. Traders also use technical analysis to identify potential exit points, such as resistance levels or when the primary trend is about to reverse.
Exit the Trade: The final step is to exit the trade. Traders can exit the trade when the price reaches their target profit level, or if the security’s price breaks below the support level and triggers the stop-loss order. Traders may also exit the trade if the trend is about to reverse, or if there are other signs of weakness in the market.
Pullback Trading Strategies:
While the basic principle of trading pullbacks remains the same across different financial markets and assets, there are several types of pullback trading strategies that traders use to identify opportunities and manage risks. Here are some of the most common pullback trading strategy types:
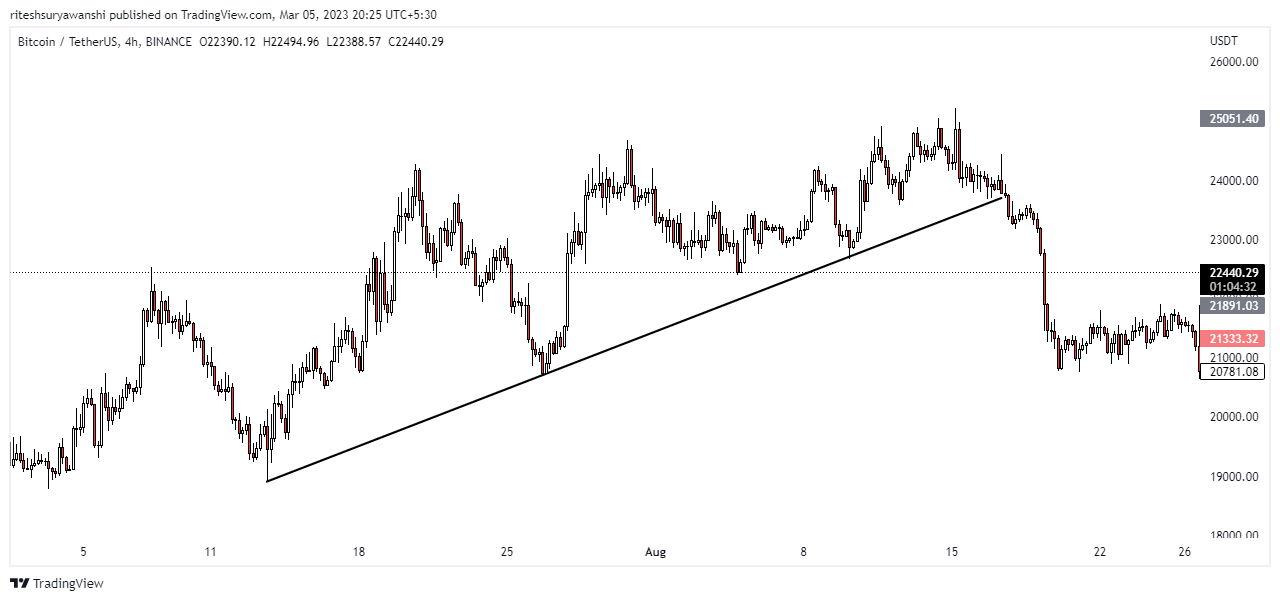
Trendline:
Trendline is a simple and effective pullback trading strategy that involves drawing a trendline on a price chart to identify the overall trend of the market. Most Pullbacks occur in this pattern.
Many Investors then look for pullbacks to the trendline, which can be used as entry points for long or short trades. Trendline pullback trading is popular among forex and stock market traders.
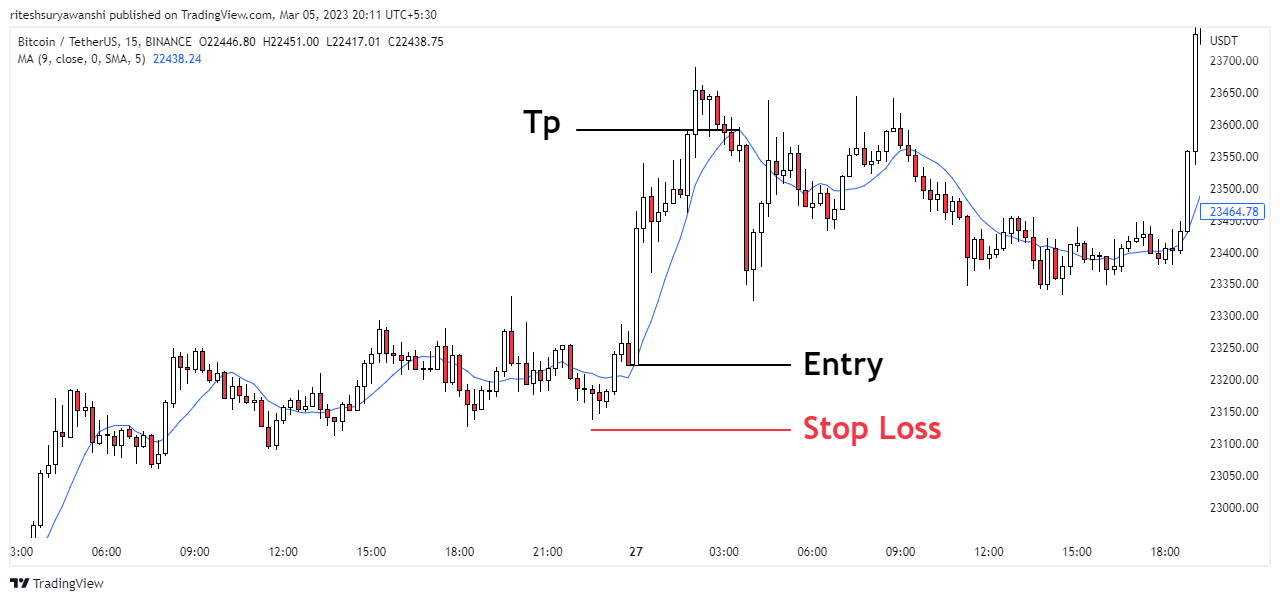
Moving Average:
Moving average pullback trading is used to identify trends and momentum. In the above image, it looks like correction waves. Day Traders use moving averages to smooth out price fluctuations and identify the direction of the trend.
When the price pulls back to the moving average, traders can enter long or short trades with the expectation that the price will continue to follow the prevailing trend.
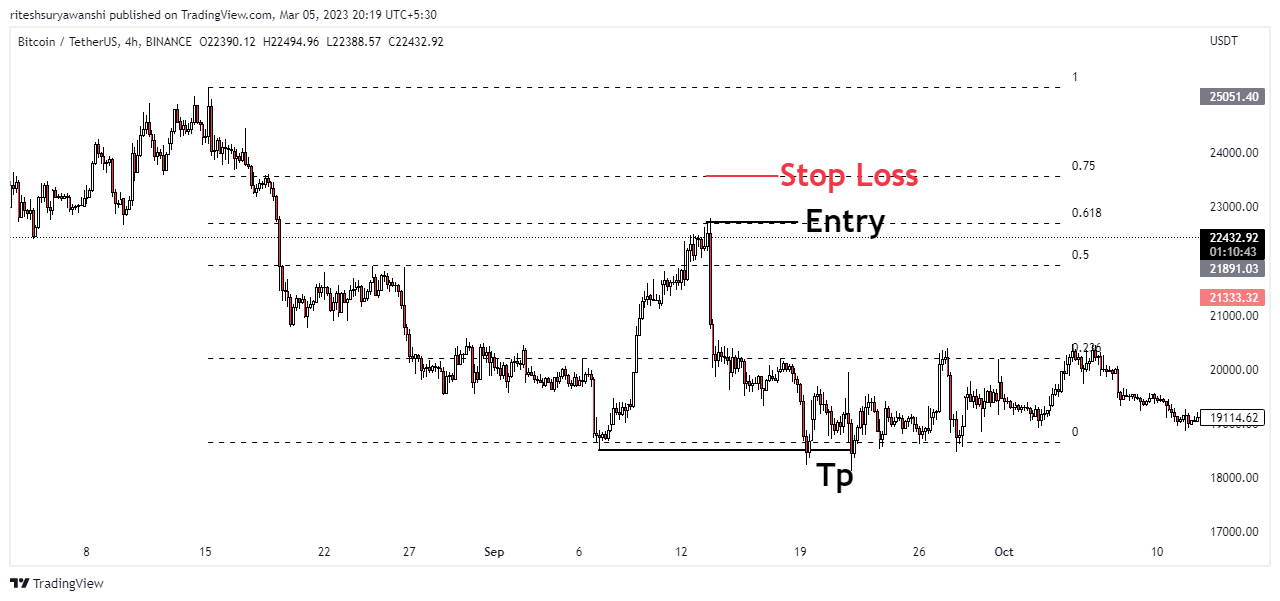
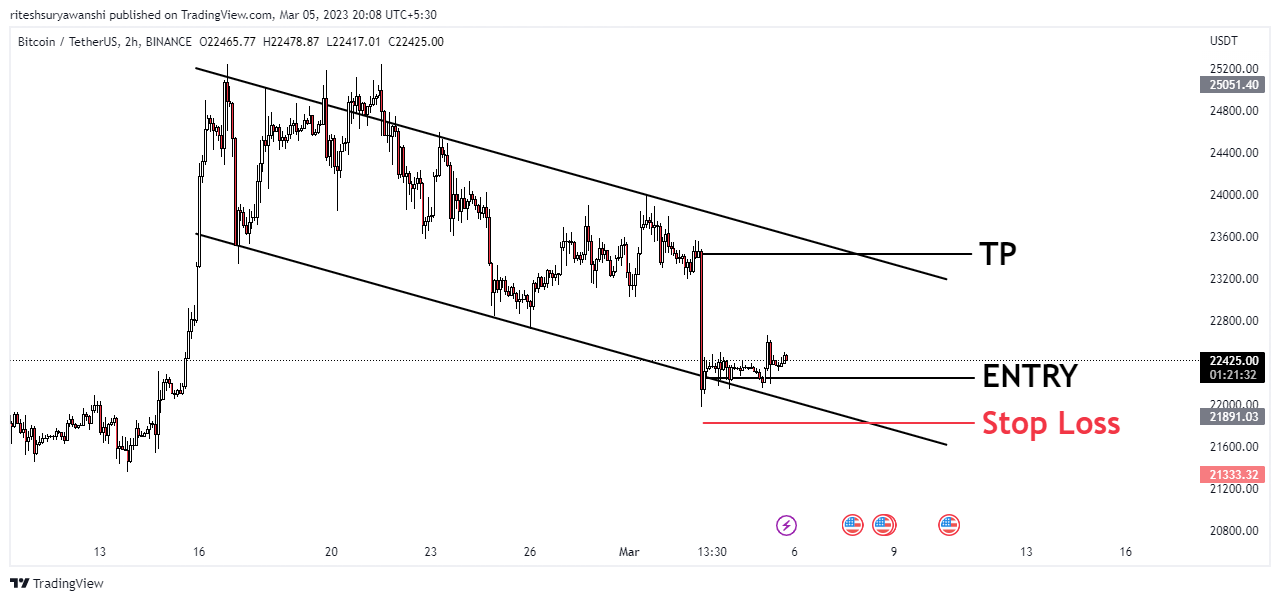
Fibonacci Retracement :
Fibonacci retracement is a trading strategy used by technical analysts to identify support and resistance levels in the market.
Traders use the Fibonacci retracement tool to draw retracement price levels based on the previous price movement. When the price pulls back to a Fibonacci retracement level (0.618), traders can enter short trades with the expectation that the price will go back in the direction of the trend. You can place your tp at Fib’s 0 level, which is basically a swing low.
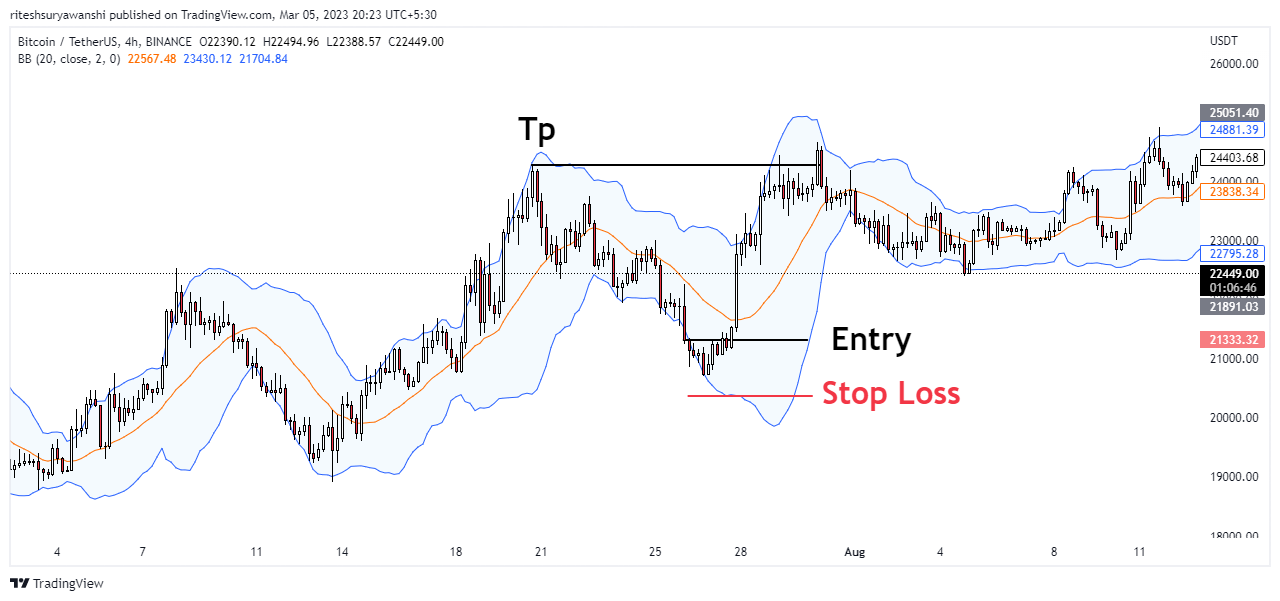
Bollinger Bands:
Bollinger Bands is a popular technical indicator used by traders to identify market volatility and potential price reversals.
Traders use Bollinger Bands, which are based on moving averages and standard deviations, to identify the upper and lower bounds of the price range. When the price pulls back to the lower band, traders can enter long trades with the expectation that the price will rebound.
When the price pulls back to the upper band, traders can enter short trades with the expectation that the price will retreat.
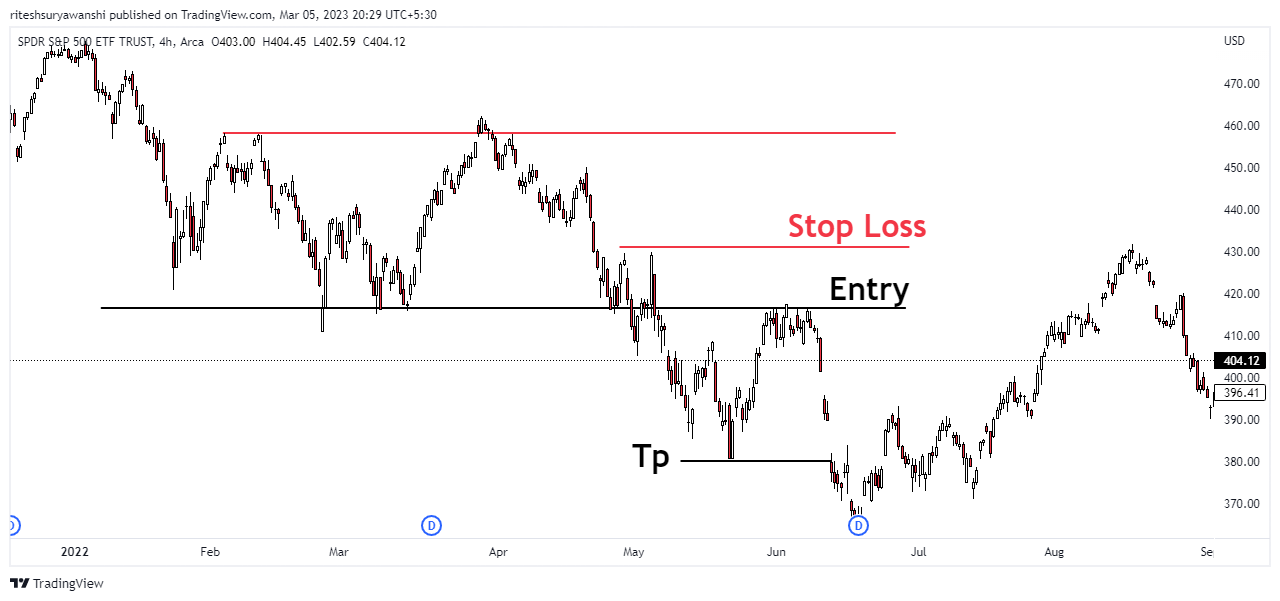
Support and Resistance Pullback :
Support and resistance is a popular pullback trading strategy used by traders to identify key levels of support and resistance in the market.
Traders use support and resistance levels, which are based on previous price movements and market psychology, to identify potential entry and exit points for long or short trades.
When the price pulls back to a support level, traders can enter long trades with the expectation that the price will rebound. When the price pulls back to a resistance level, traders can enter short trades with the expectation that the price will retreat.
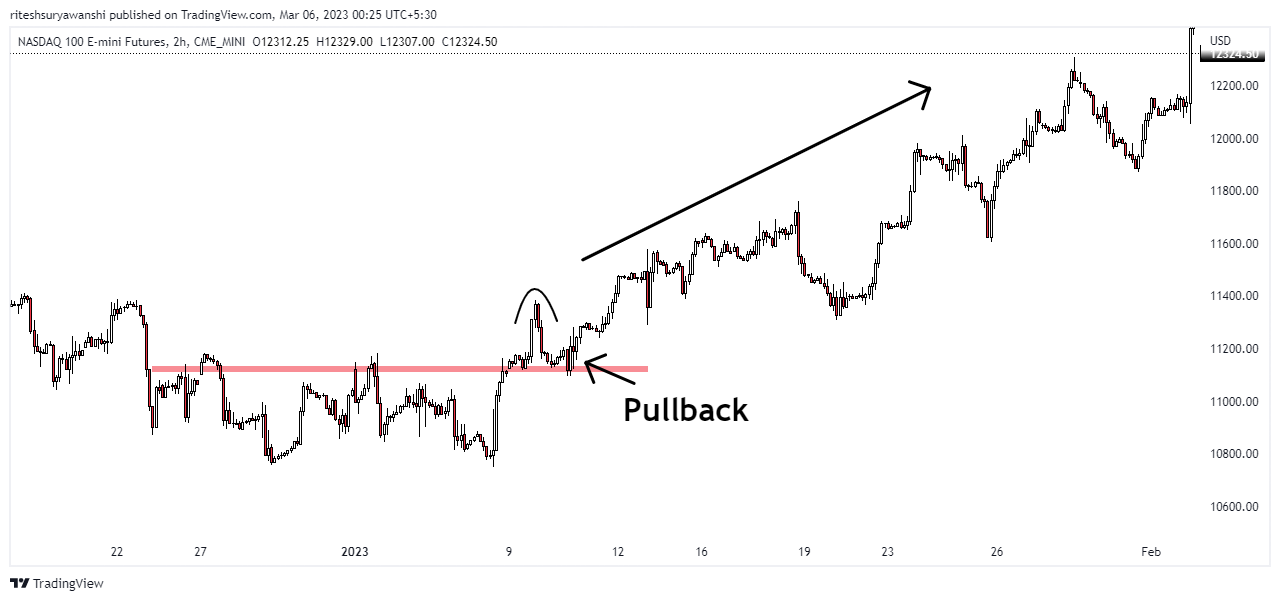
Breakout pullbacks
A breakout pullback is a technical trading strategy that seeks to profit from the momentum of a security that has broken out of a trading range, followed by a pullback to a key level of support or resistance.
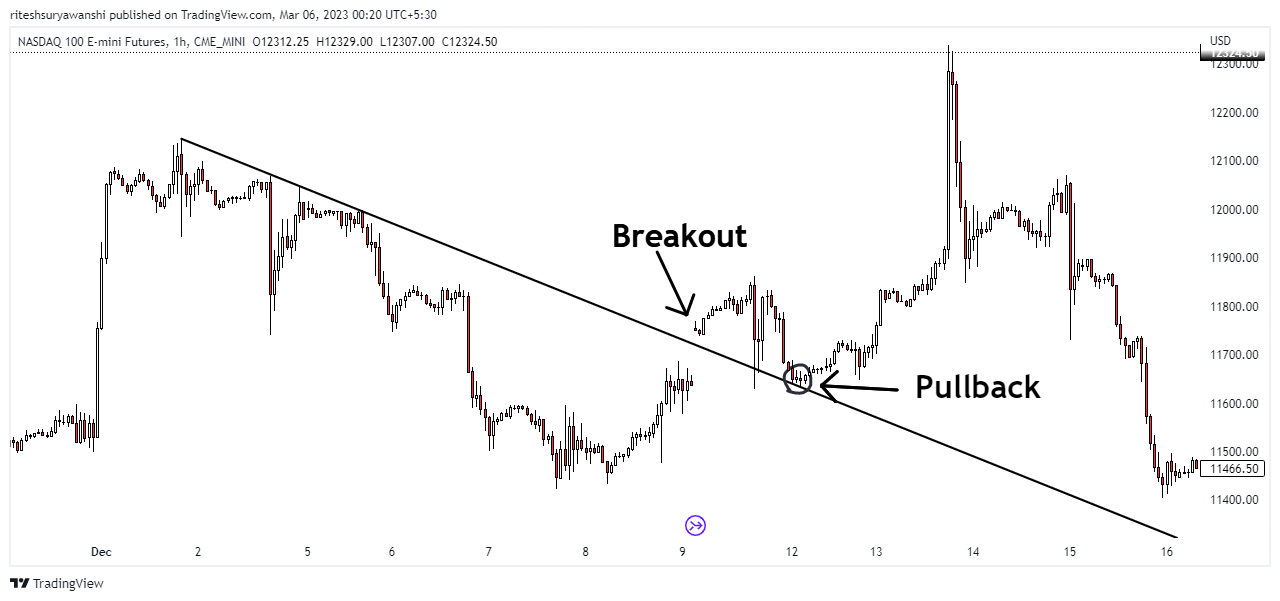
Here’s how it works:
- Identify a security that is trading within a range for an extended period, with clear support and resistance levels.
- Monitor the security for a price breakout above the resistance level or below the support level.
- Once a breakout occurs, wait for a pullback to the breakout level.
- Once the pullback occurs, Buy or sell the security at the breakout level, depending on the direction of the breakout.
- Set stop-loss orders to limit potential losses, and set profit targets based on the distance between the breakout level and the next key level of support or resistance.
- Monitor the trade closely and adjust stop-loss and profit targets as needed.
Breakout pullbacks can be effective trading strategies for short-term traders who are looking to capitalize on short-term price movements.
Pullback vs Reversal
In trading, a pullback and a reversal are two different price movements that traders need to be aware of.
A pullback is a short-term price movement that occurs after security has experienced a strong move in one direction. It is often a retracement of the initial price movement and can be seen as a temporary pause or correction before the trend resumes.
A pullback can be a good opportunity for traders to enter or add to an existing position at a more favorable price. However, if the pullback is too deep or lasts too long, it could indicate that the trend has reversed, and the trader should consider exiting the position.
A reversal, on the other hand, is a change in the direction of the trend. It occurs when the price movement reaches a significant level of support or resistance and fails to break through it. A reversal can be identified by a change in the trendline or a change in the pattern of price movements.
Reversals can be challenging to identify and can often catch traders off guard, leading to significant losses. However, traders can use various technical indicators and analysis techniques to identify potential reversal points and adjust their positions accordingly.
In summary, a pullback is a temporary pause or correction in a trend, while a reversal is a complete change in the direction of the trend. Traders need to be aware of both price action movements and use appropriate trading strategies to manage their positions effectively in financial markets.
Conclusion
In conclusion, pullback trading is a popular strategy used by traders to take advantage of temporary price declines in the market.
By using different pullback trading strategies, traders can identify opportunities and manage risks effectively. Not only rely on the indicators but make sure you’re taking price action into consideration.
However, as with any trading strategy, there are no guarantees of success, and traders must be prepared to accept losses if the market moves against them.


