RSI or Relative Strength Index is a momentum indicator developed by J. Welles Wilder and explained it in his book in 1978. RSI measures underlying security price change and oscilates between 0 and 100. Reading above 70 is considered as overbought and reading below 30 is considered as oversold. Trading opportunities can be indicated by seeking for divergences, failure swings and centerline crossovers. Relative strength index can also be used to identify the trend direction.
What is Relative Strength Index (RSI)?
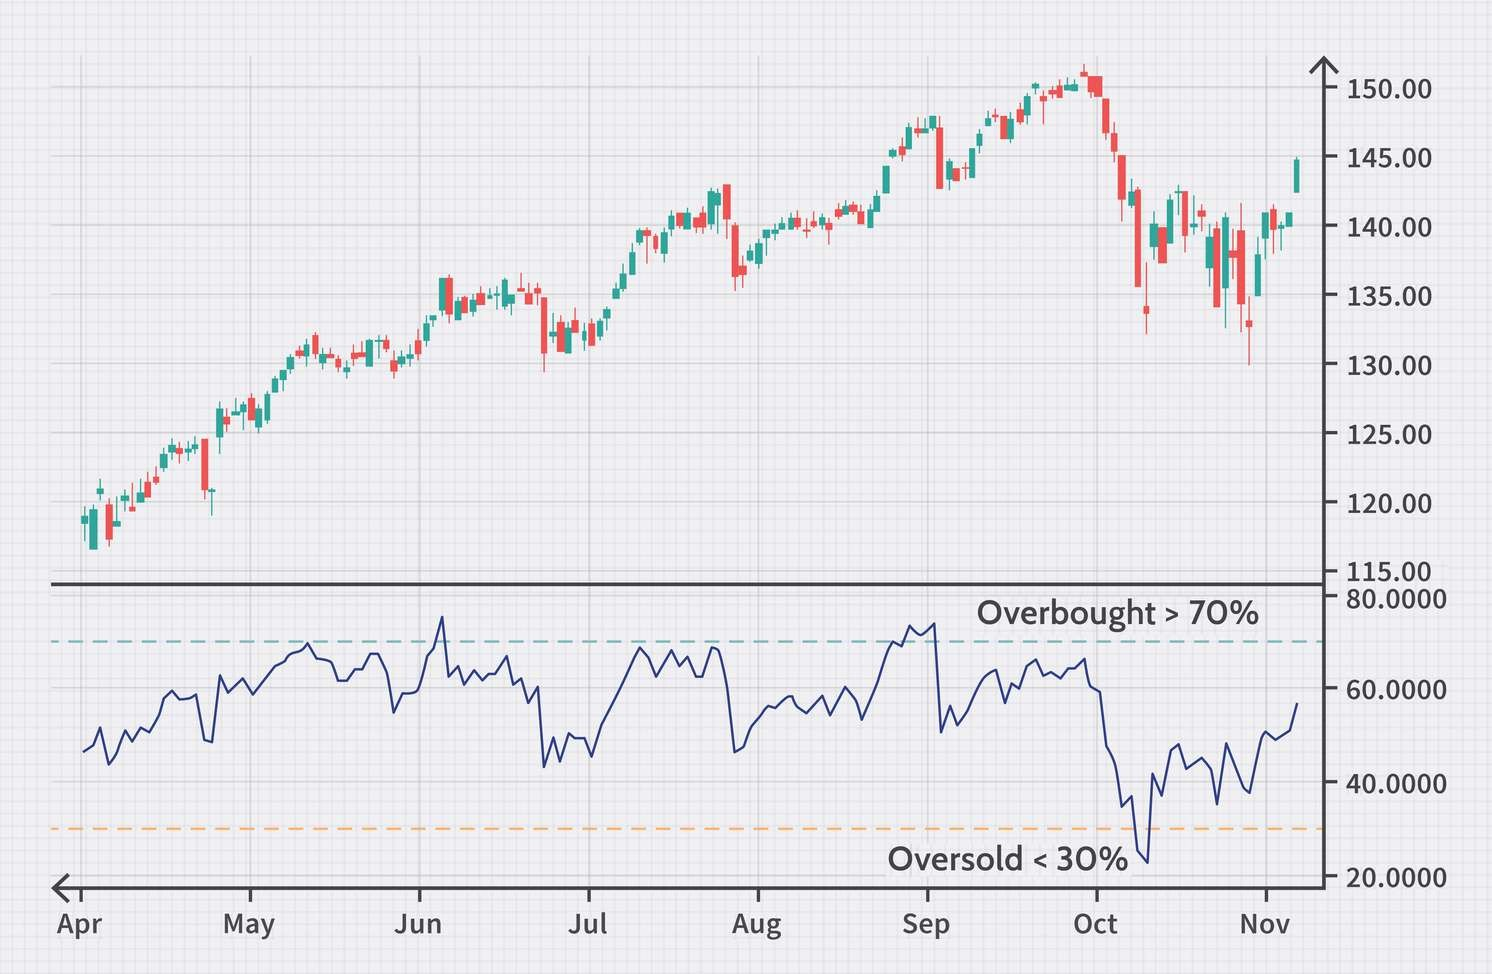
RSI compares the strength of up days to down days to determine how well a stock performs relative to itself. This value is calculated and has a range of 0 to 100.
When evaluating this value, the number 70 or higher is considered bullish. In contrast, a reading of 30 or lower is considered bearish. In general, tracking times of overbought and oversold situations are valuable as well.
Relative Strength Index Formula
The RSI formula involves calculating the ratio of average gains to average losses over a specified period, typically 14 days. This calculation is then plotted on a scale of 0 to 100, where readings above 70 are considered overbought and readings below of 30 are considered oversold.
RSI = 100 – (100 * (1 + Average Gain/ Average Loss ) ),
While this formula can help traders to understand the usage of RSI better, it’s not recommended to perform these computations while trading. Instead, most charting software contains the RSI indicator that handles all of the calculations itself.
Using RSI
Understanding The RSI Trading Signals
Once traders have located the RSI indicator in their platform’s index, they may modify the settings to suit their RSI strategy.
Afterward, it’s important to understand how their usage/setting enables different indicator signals as they trade. These signals can be better understood according to the following:
Current Trend
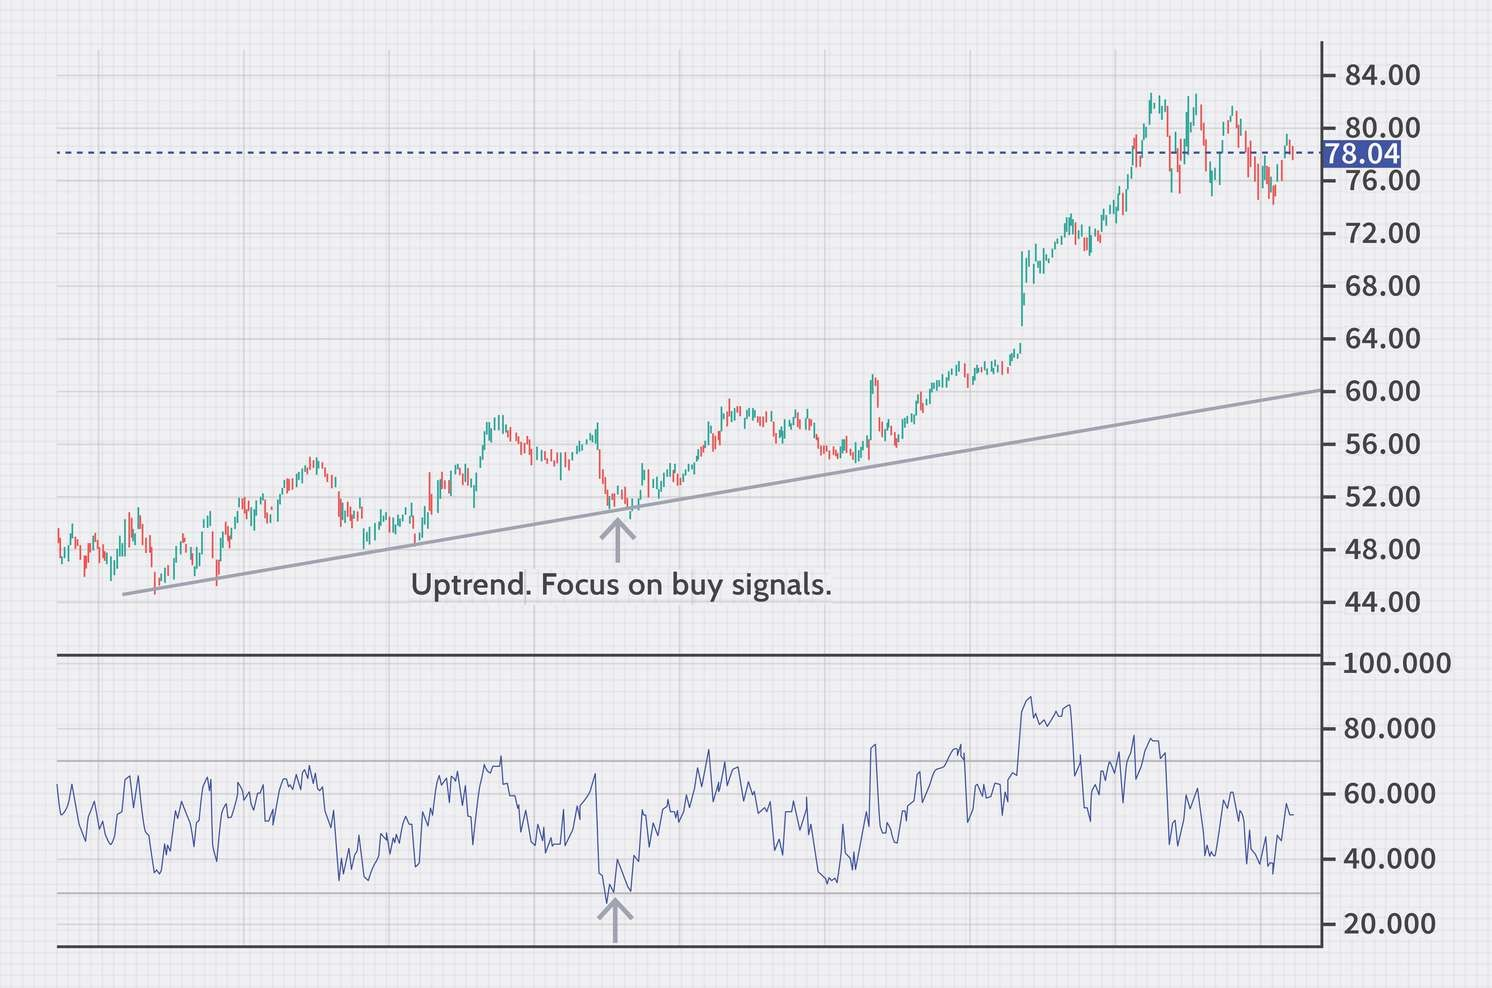
The RSI is more than just a buy/sell signal in trading. In fact, it helps to determine the primary trend’s direction. Traders can better understand this trading strategy through the following factors:
- Uptrends
Generally, bull markets should search for signals of 66.66, while bear markets should look for signals of 33.33.
Here, traders may notice it to be slightly lower than the standard 80/20 or 70/30 values. John Hayden presented these readings of 33.33 and 66.66 in his book RSI: The Complete Guide.
Throughout the book, John discussed that these levels reflect bullish and bearish tendencies rather than the typical extreme readings.
Furthermore, the RSI isn’t only intended to show buying and sale signals indications. Instead, the RSI indicator is also responsible to display “strength,” specifically the trend’s strength.
- Downtrends
The RSI can also be used to define downtrends, as shown below. All investors need to ensure in this process is that the security does not exceed 66.66.
Should you now decide on the buy or sell signals based on the crosses of 66.66 and 33.33? don’t be in a hurry, there is more to consider beforehand:
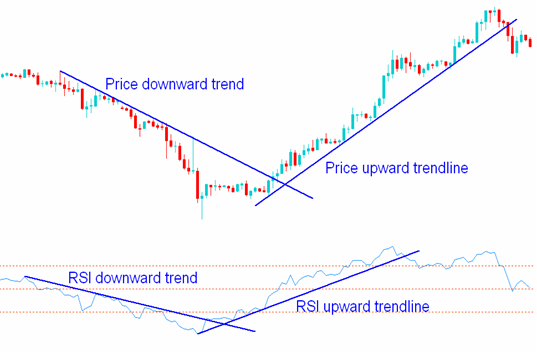
Support and Resistance of the RSI
The RSI indicator can also demonstrate market’s support and resistance levels? These support and resistance levels can be horizontal zones or sloping RSI trendline.
Breakouts
Traders can see an RSI line predicting a breakout below:
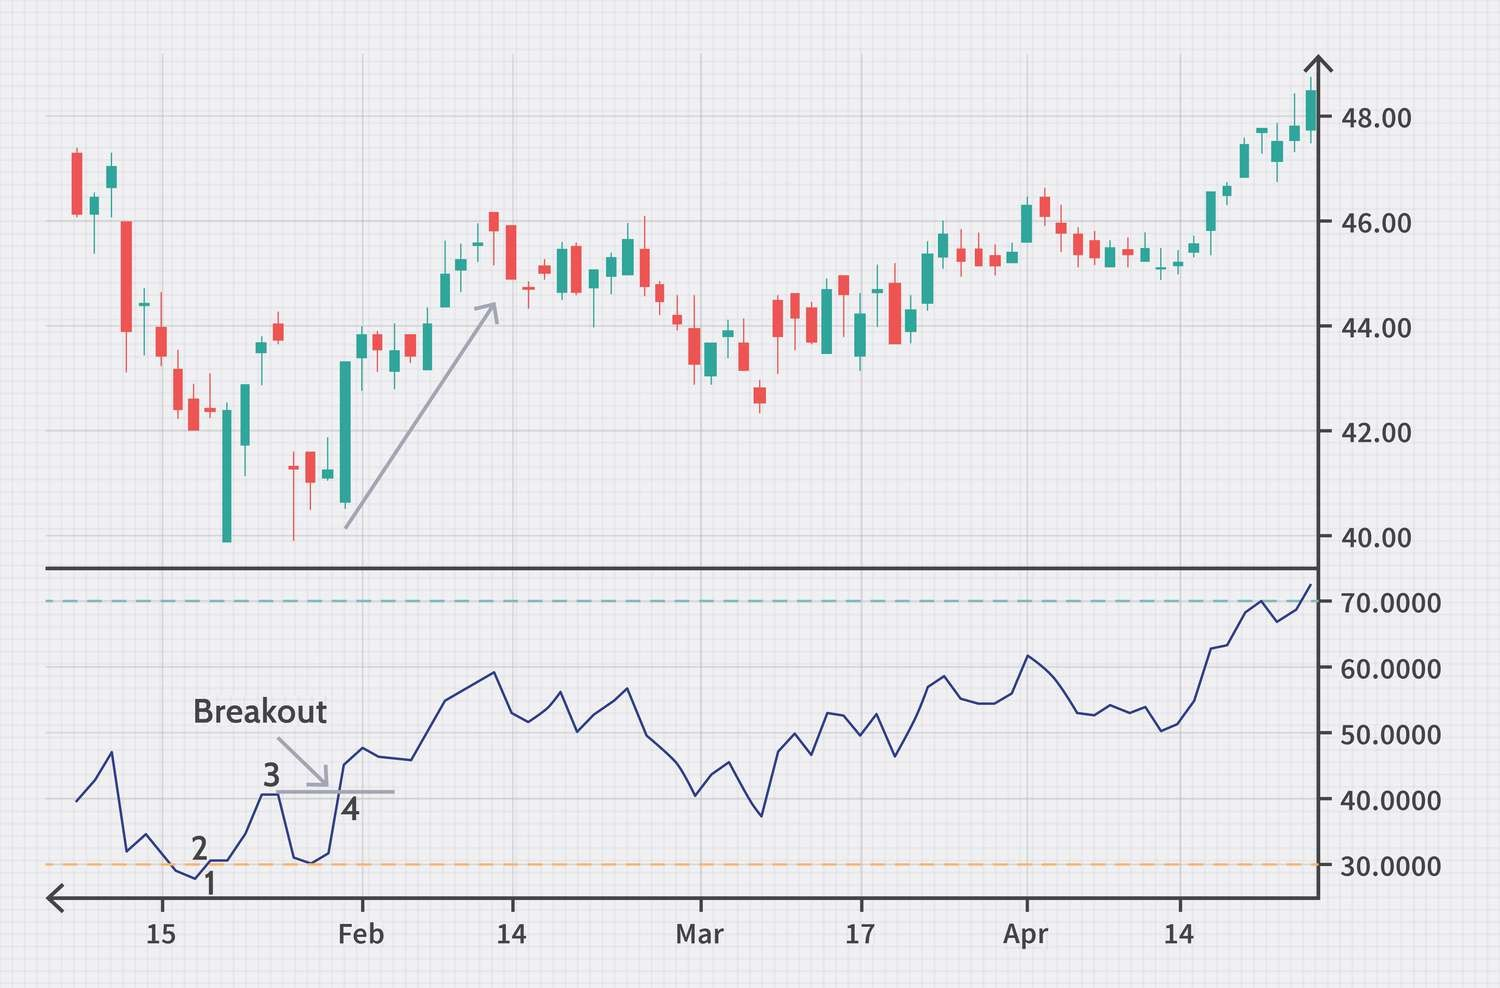
In this scenario, investors can apply an RSI trendline to other technical indicators in the same way that price charts can, as shown in the above chart. According to this chart, the breakdown led to a good 7% run.
Breakdowns
In another example where RSI correctly predicted a top, the indicator broke down and tested the RSI trendline before the price drops. Although the stock hit new highs, the RSI began to fall, as shown below.
Now, multiple false signals may occur before the big shift.
This uncertainty proves that no easy money is available in the market unless traders have mastered the craft.
RSI Divergence According to Price
This approach is old but effective, so individuals can apply it to the RSI indicator. Using this approach on the previous example, investors may want to discover when the price reaches new highs, but the Relative Strength Indicator cannot make new highs.
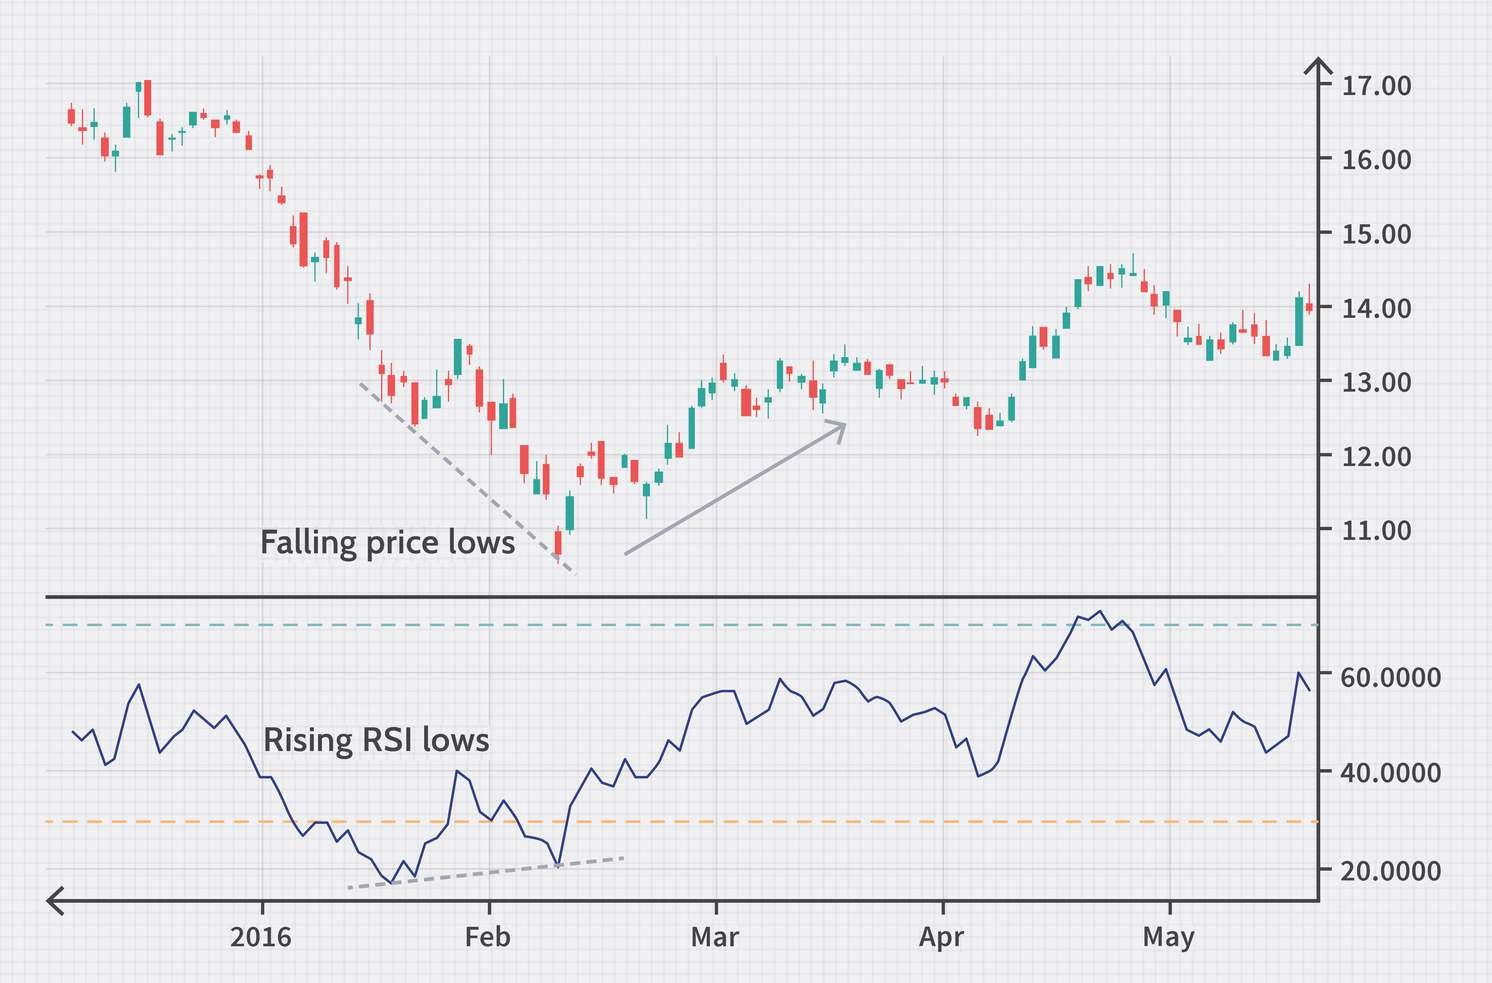
This is a clear example of the RSI indicator starting to roll as the price rises.
Using Double Bottom RSI Signal
Apart from the RSI divergence with price, the relative index can also identify common patterns such as double bottoms.
An example below shows this scenario where the initial price bottom is made on high volume.
However, when the RSI is has been above 30 for a long time, but the stock has a snapback bounce following the first price sell-off, there will be chances of a violation of 30 on the RSI.
This rally is brief, followed by another downturn that breaks the low of the initial bottom.
This second low is where stops from the previous reaction low are looted. The security begins to rally quickly shortly after breaking the low by a few ticks.
As the result, the second low doesn’t form a double bottom on the price chart and the relative index.
The second rally has strength because:
-
The weak longs were stopped from their position on the second reaction
-
The new shorts are being squeezed out of their position.
All in all, combining these two forces causes sharp rallies quickly.
Does RSI Setting Affect the Indicator Trading Signals?
Yes, it does. The RSI setting determines how frequently the RSI shows overbought and oversold signals and divergence signs of buying and selling. The RSI values are calculated at 14-period intervals.
Therefore, choosing a lower interval, such as 5-period, will lead the RSI to hit extreme levels more frequently. Similarly, lengthier duration settings will see the RSI indicator rise above 70 or fall below 30 less often.
Tips to Use RSI Signals Efficiently
Here are important tips for using RSI Efficiently
-
Use the RSI in conjunction with other indicators, such as moving averages or trend lines, to confirm signals and identify potential trend reversals.
-
Be patient and wait for clear signals rather than jumping in at the first sign of an oversold or overbought reading.
-
adjust the time frame and time period of the RSI calculation to match the specific market or asset being Analyzed.
-
Always have a solid risk management strategy in place.
Additional Factors To Consider When Using RSI
- Choosing an Optimum RSI Setting for Day Trading
J. Welles Wilder Jr., the RSI’s creator, advocates adopting the 14-period RSI as an optimum setting for trading But, depending on whether investors are trading forex, cryptocurrencies, or other financial markets and the timescale they are trading on, alternative RSI values may be suitable for trading.
For instance:
★ The 14-period RSI provides multiple signals
★ The 5-period RSI sends frequent signals
★ And the 50-period RSI provides only one extremely effective trading signal for the time specified.
Although different RSI settings are conceivable and perhaps beneficial because Wilder designed the indicator, we should understand why Welles Wilder believes his signal works best with 14 periods, as per his book.
Precisely speaking, it’s because 14 periods = two weeks or half a month. And this period is finalized by considering how natural phenomena like the Fibonacci sequence affects the financial markets.
As per his book, what brought Wilder to consider 14 periods after testing multiple periods was the realization that this period was best for swing trading with daily timeframe charts.
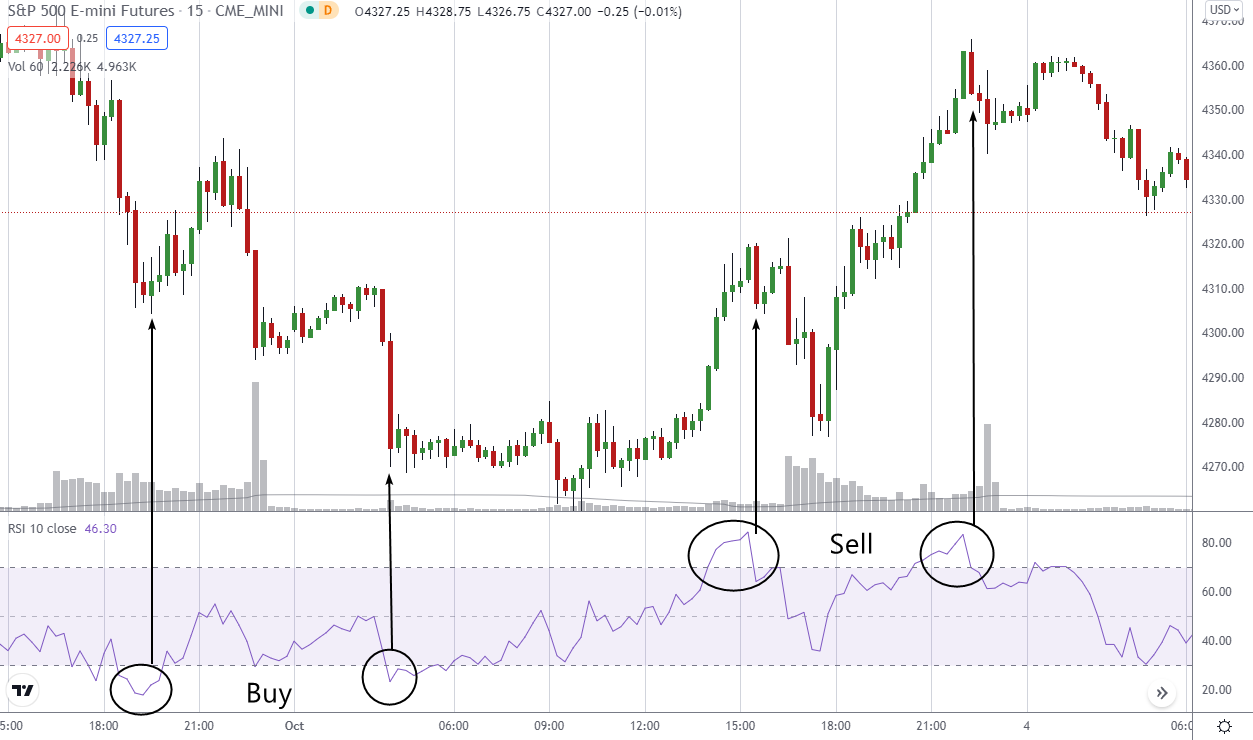
- Purchasing a Good RSI
As per his book, Wilder also suggests utilizing the RSI at the 30 and 70 levels of the oscillator as oversold and overbought readings, respectively. This indicates that when the RSI falls below 30, traders should buy the financial asset while on the other hand, when it rises above 70, it’s time to sell. Though, there is much more a trader can do if he/she doesn’t want to proceed with this approach.
Now some trend-following trading strategies use a high RSI to buy. However, be sure that the RSI is a momentum oscillator instead of a trade trigger.
Therefore, numerous successful day-traders have improved RSI buy and sell triggers by changing oversold and overbought criteria to 20 and 80 or other levels.
While this provides dependable trade signals, there are times when traders may miss profitable trading opportunities by setting 20 and 80 RSI values.
- Trading with RSI
Traders can combine divergence trading techniques with several technical indicators, such as MACD and Stochastic. Which is more precise, MACD or RSI? Divergence works solely on an underlying price chart. Thus neither is superior.
Divergence happens when the direction of a technical indicator, usually an oscillator, ‘diverges’ from the direction of the price. Essentially, the RSI indicator starts moving in the opposite direction of the price.
Traders and investors perceive a change in the direction of the RSI indicator as an indication that price fluctuations will follow in the same direction. In this case, the oscillator acts as a price-leading indicator.
- Using RSI TRding Strategies
Wilder proposed RSI trading strategy that combined the concept of divergence with overbought and oversold signals. Furthermore, Wilder states that each trader’s experience discovers the finest indication settings. Hence, they should experiment with different settings to find which performs best for their RSI trading strategy or system.
Here is one example of an RSI trading strategy to use as a starting point for constructing their trading system:
RSI- 90/10 Levels & 2-period
Larry Connors developed this RSI trading strategy to identify moments when the short-term trend is significantly oversold or overbought within an overall price trend.
Connors uses the 90 and 10 levels in the trading strategy for overbought and oversold signals instead of the 70 and 30 levels to filter out false signals quickly. This is a buy-dip, sell-rip trading method.
Traders can use this RSI trading strategy by:
-
Evaluating the overall price trend by plotting a 200-period simple moving average (SMA).
-
Adding the RSI indicator
-
Setting the period to two.
-
And finally, setting the overbought and oversold values to 90 and 10, respectively.
After understanding these steps, they can opt for the following:
● Buy signal is when price > 200 SMA & RSI(2) < 10
● Sell signal is when price < 200 SMA & RSI(2) > 90
5 Must-Know RSI Trading Strategies Using RSI
Now let’s explore the 5 lucrative RSI trading tactics to make the most of every trading opportunity:
1. RSI and MACD
According to the relative index example below, the green candles indicate the times traders may receive entry signals from both indicators.
Furthermore, the RSI indicator exits an oversold state barely more than an hour after the morning open, signaling a clear buy signal.
They should go long on this stock during this approach since the indicators give two matching signals. Furthermore, if investors are in a situation similar to the chart above, their position will be at the beginning of a long-term bullish trend.
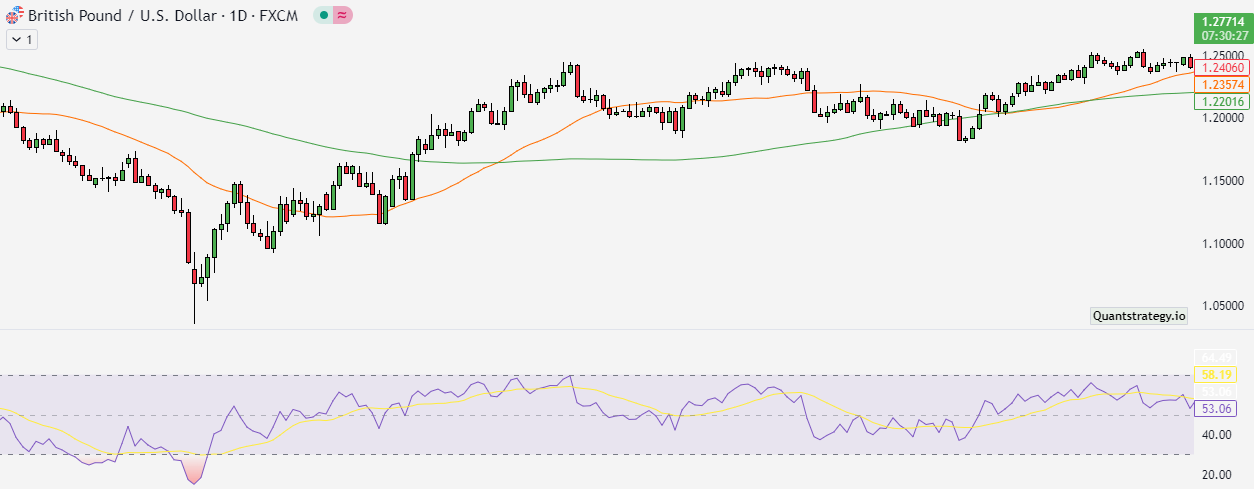
2. Relative Strength Index with MA Crossover
Here, the results from RSI indicator will be merged with moving averages to get better understanding of the market trends. The moving averages will be calculated using the 4-period and 13-period MA values.
When the RSI line crosses the 50-line, and a supportive crossover of the moving averages occurs, we will purchase or sell the stock. Holding the position until there is divergence on the chart or receive a reversal signal from one of the two indicators is also impactful.
Before starting, it’s important to know that a consistent divergence from the moving average is insufficient justification to quit a trade. Therefore, before departing the market, we propose waiting for a candle to close above both moving average cross lines.
3. Trading with RSI and Price Action
In this technique, traders can employ the strength index signals with any price action indication, like candlesticks, chart patterns, trend lines, channels, etc.
Simply put, they will need an RSI indication and a price action signal (candle pattern, chart pattern, or breakout) to enter a trade. Each trade should be held until a contrarian RSI signal or price movement verifies that the move has concluded.
The candlesticks forms a Morning Star Pattern and the RSI also enters a bullish area. According to this RSI trading strategy, the RSI and candlestick patterns provide bullish cues to enter the stock.
4. Relative Vigor Index and RSI
This trading method revolves around relative strength and vitality indexes.
They only need to enter the market if both indicators give favrable signals in this method. Then, retain the posture until one of the tools sends an indication to the contrary.
5. RSI and Keltner Channel Indicator
This trading strategy is about investigating the slope of the Keltner Channel. As per the trading strategy, the upward slope is for prospective long entry, and the downward slope is for possible short positions.
Considering this, traders should seek purchase entries when the RSI closes above 50, and the Keltner Channel slope is upward. Likewise, they should look for a short entry when the RSI falls below 50, and the Keltner Channel slopes lower.
This way, when traders enter the market long, their stop-loss order is placed below the Keltner Channel. In contrast, when they enter the market short, the stop-loss order is placed above the Keltner Channel. Now if investors want to ride the trend as much as possible, they should utilize a trailing stop.
Usage of RSI: Is It Helpful?
The usage of Relative Strength Index (RSI) can be helpful in analyzing the strength of price momentum in financial markets. It can provide traders with a useful tool for identifying potential trend reversals, generating buy and sell signals, and managing risk in their trading strategies.
How to Apply RSI Indicator?
When it comes to the Relative Strength Index (RSI) indicator, many beginner traders may fall into the trap of simply buying when the indicator reaches 30 and selling when it reaches 70. However, it’s crucial to understand that solely relying on this trading method may lead to losses.
Why is that? Because trading the obvious can be a risky strategy in financial markets. While basic methods can work, they often have a low success rate since many traders are using the same approach.
To use the RSI indicator effectively, traders should focus on developing a well-rounded trading strategy that incorporates multiple indicators and techniques for risk management. It’s also important to adjust the RSI calculation time frame based on the market or asset being analyzed.
Conclusion
In the end, combining the relative strength index with a good trading strategy, such as volume or moving averages, is a fantastic place to start if they are new to trading. So, when it is combined with any other indicator, there will be predetermined values to choose from.
This approach also removes many of the ambiguities that come with the trade. However, as traders progress in trading, they may want to use more subjective price action methods. In this case, make sure to be patient and cautious to progress as a trader because this level of trading requires extensive skills in trading.
With time and practice, every trader can improve and master the above-shown trading skills – making a fortune as a pro trader in the near future. Good Luck!