MOM is a momentum indicator that measures the speed and magnitude of price changes. It is used to identify overbought and oversold conditions in the market and generate trade signals.
In this blog post, we will explore what MOM is, how it’s calculated and how traders can use it to improve their trading results. Stay tuned!
What is Momentum Indicator
The momentum indicator is a technical indicator that measures the speed and magnitude of price changes. The momentum indicator can be used to generate buy and sell signals, as well as to identify underlying asset trend direction. The most common way to use the momentum indicator is to look for divergence between the indicator and price.
Formula for Momentum Indicator
Many traders believe that the momentum indicator is one of the most important technical indicators available. The formula for the momentum indicator is very simple: it is simply the difference between the current price and the price “n” periods ago.
MOM = close – close_n
where close and close_n are the closing prices for current and n periods ago.
The value of “n” is typically 14. The momentum indicator can be used in a number of ways, but perhaps the most popular is to use it for generating buy or sell signals.
When the momentum indicator crosses above 0, it is generally considered a buy signal, and when it crosses below 0, it is generally considered a sell signal.
However, it is important to note that the momentum indicator can remain above or below 0 for long periods of time, so it is often used in conjunction with other technical indicators.
How to Use MOM in Trading Strategies
Momentum indicator can be used for defining trend direction. When it is above 0 it is up trend and when it is below 0 it is down trend.
Usualy it generates buy signal when MOM crosses above 0 line and generates sell signal when it crosses below 0 line.
Besides this MOM can be used for generating trading signals based on divergence patterns.
A buy signal is generated when the indicator forms a higher high while price forms a lower high. This indicates that the trend is losing momentum and could reverse.
A sell signal is generated when the indicator forms a lower low while price forms a higher low. This indicates that the trend is losing momentum and could reverse.
Other Momentum Indicators
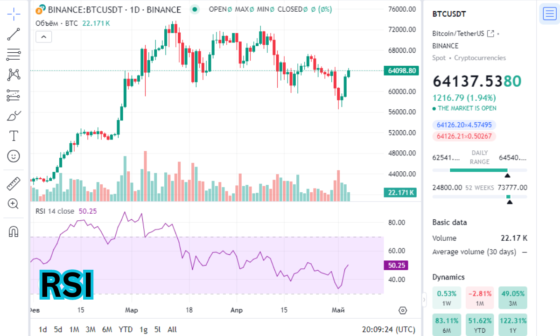
There are many different momentum indicators, but the most popular ones are the Relative Strength Index (RSI), the Stochastic Oscillator, and the Moving Average Convergence Divergence (MACD).
Each of these indicators has its own unique formula and can be used in different ways. For example, some traders use the RSI to identify overbought and oversold levels, while others use it to look for divergences between price and the indicator. The MACD is also a popular tool for spotting divergences, as well as for identifying trend changes. Meanwhile, the Stochastic Oscillator is often used to find possible support and resistance levels.
While each of these indicators can be helpful on its own, they are often used together to form a more complete picture of market conditions.
Limitations of MOM
MOM indicator has some limitations. First, MOM is a lagging indicator, so it is not always accurate in predicting future price movements. Second, MOM can be affected by false signals in choppy markets. Finally, the MOM indicator is more useful for longer-term trends rather than short-term moves.
Despite these limitations, the MOM indicator can still be a helpful tool for traders.
Conclusion
MOM can be a helpful momentum indicator to use in trading strategies as it captures an asset’s price trends.
However, like all indicators there are some limitations to MOM that you should consider before using it in your own trading. If you would like free access to our MOM based trading strategies subscribe now.


