


Oscillators are among the most significant and popular indicators in the financial markets. They are important because of their significance in identifying when the markets are in an overbought or oversold condition. They are helpful when verifying a trend as well.
Besides, even Wall Street uses them daily because of their significance. Some of the most common oscillators are the Commodity Channel Index (CCI), Relative Strength Index (RSI), and Stochastic Oscillator.
The Commodity Channel Index and Relative Strength Index both serve as momentum oscillators and suggest whether an asset is overbought or oversold. However, they differ in their interpretations and calculations.
RSI determines the speed and shift of price movements, whereas the CCI indicator determines the difference between the asset’s typical price level and its average price level over a given period.
In this blog post, we shall cover the details of the two indicators and explain their advantages and disadvantages to determine which can better fit your trading strategy.
Relative Strength Index (RSI) – Explained
The Relative Strength Index (RSI) is a momentum indicator that was developed by J. Welles Jr. in 1978. RSI compares the magnitude of average price gains and losses over a given period to determine the change and speed of price movement of an asset.
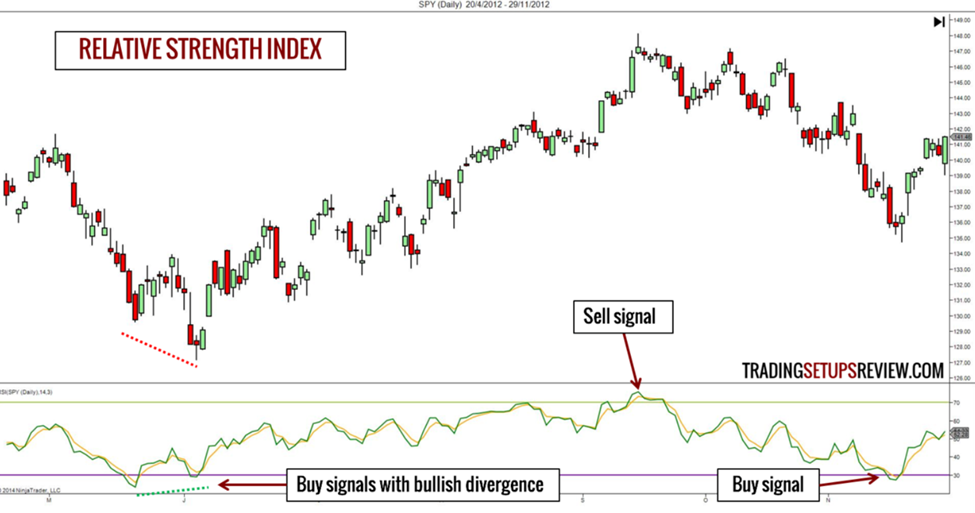
Like the Stochastic oscillator, the RSI values range between 0 and 100. The indicator is typically employed to identify overbought and oversold conditions of the market.
Interpreting the Relative Strength Index (RSI)
A market decline may be imminent if the average gain regularly exceeds the average loss. The opposite is true when the average loss leads.
- An RSI reading below 30 indicates the asset is oversold and suggests that a stock can be undervalued.
- An RSI reading above 70 signal an overbought asset and suggests that a stock can be due for a price adjustment.
The common default value of the Relative Strength Index is 14.
Calculating the RSI
The Relative Strength Index can be calculated by the following formula:
RSI = 100 – (100 / 1 + RS)
where RS = Avg. Gain / Avg. Loss
or
RS = Average of n-day up closes / Average of n-day down closes
Advantages of Relative Strength Index
- Simple Interpretation: RSI is straightforward to comprehend, with obvious levels for overbought and oversold conditions.
- Versatility: RSI is adaptable to a range of asset classes and time frames, which makes it useful for a variety of trading tactics.
- Extensively Used: RSI is one of the most extensively used momentum indicators and is incorporated into many trading systems.
Disadvantages of Relative Strength Index
- False Signals: The relative strength index (RSI) is prone to producing misleading signals, particularly in strongly trending markets in which assets stay overbought or oversold for prolonged periods.
- Frequent False Signals: Range-bound markets lack strong trends. RSI in these environments tends to oscillate within its overbought/oversold zones more frequently, potentially generating false buy/sell signals. In this case it works Better with period and levels Modifications.
Introduction to the Commodity Channel Index (CCI)
The Commodity Channel Index is a versatile technical analysis tool that helps identify overbought and oversold areas. Besides, it can also be used to spot significant trend momentum and help traders locate critical price points to enter an existing trend.
While originally meant for finding cyclical trends in commodities, it’s also employed for other financial instruments, including equities and currencies. Moreover, with time, the Commodity Channel Index has emerged as one of the most popular momentum indicators for identifying buy and sell signals, especially for day traders and scalpers.
Much like the RSI and MACD, the Commodity Channel Index is shown as a sub-chart, which is an additional chart that is displayed beneath the main price chart. Because of its widespread use, the indicator can be found on almost all trading platforms.
Calculating the Commodity Channel Index (CCI)
The Commodity Channel Index (CCI) measures the price momentum using the difference between the current price and its historical average price. The current period’s deviation is compared to the average deviation over the previous N periods to achieve this.
Unlike RSI, CCI values are unbounded. This means the CCI values can go lower or higher indefinitely. Because of this, historical extreme CCI levels, from which the price reversed, are usually used to calculate the overbought and oversold levels for every particular asset.
The formula used for calculating the CCI indicator is
CCI = (AveP – SMA of AveP) / (0.015 x Mean Deviation)
Where
AveP = Average Price = (High + Low + Close) /3
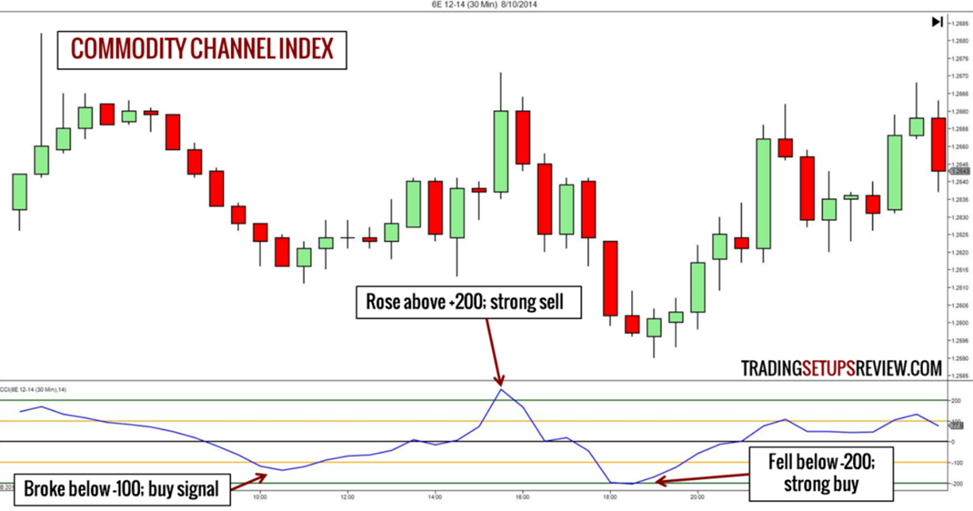
The Commodity Channel Index ranges from -100 to +100 and has three significant levels – 0, -100, and +100. Notably, this technical indicator uses a typical price (H + L + C / 3) instead of a closing price.
The default value of CCI time period is 20. However, some traders prefer using a higher time period since it enhances the accuracy and probability of the indicator.
Interpreting the Commodity Channel Index (CCI)
The Commodity Channel Index can be employed to identify overbought and oversold conditions, divergences, and trend reversals. When the value of the Commodity Channel Index is above zero, it signals that the price is above the historic average and depicts a strong upward momentum. On the contrary, a CCI value below zero suggests that the price is below the historic average and depicts a strong downward momentum.
- When the price hits +100, the asset is overbought.
- When the price hits -100, the asset is oversold.
Furthermore, when the CCI hits extreme levels, like +100 or -100, it indicates that the price is too distant from its average and is probably going to return to the mean. Trend reversals can be indicated when CCI crosses the zero line, which suggests momentum shifts. Besides, divergence occurs when the indicator moves in a direction opposite to the price, suggesting a potential reversal and a weakening of the trend.
Advantages of Commodity Channel Index (CCI)
- Adaptability: CCI can be used in any market, such as the stock market, Forex, or commodity, and can suit any trading style. Moreover, it can be adjusted for any trading time frame, such as day trading time frames like 15 minutes and longer time frames like a daily time frame.
- Identify Trend and Strength of the Trend: CCI helps in identifying market trends with no effort. A positive CCI value indicates an uptrend, whereas a negative CCI value indicates a downtrend.
- Divergence Signals: CCI offers divergence signals before they are reflected in price. This indicates a potential price reversal.
- Effective in Trending and Range-bound Markets: The CCI indicator works well in both range-bound and trending markets, which renders it fit for several trading strategies.
Disadvantages of Commodity Channel Index (CCI)
- False Signals: CCI can generate whipsaws and misleading signals in choppy or sideways markets.
- Lagging Indicator: CCI is a lagging indicator as it depends on historical price data to produce trading signals. It can fall behind in situations of rapid shifts in market conditions.
- No Fixed Overbought or Oversold Levels: CCI doesn’t have preset threshold values like the RSI. The values above or below +100 and -100 aren’t suitable for all trading timeframes and assets.
CCI vs RSI
The Commodity Channel Index (CCI) and the Relative Strength Index (RSI) are both well-known technical indicators.
The differences between them are as follows:
- The CCI focuses on regular divergences from an asset’s moving average price to spot divergences, whereas the RSI tracks the speed of price changes to analyze the overbought and oversold levels.
- The RSI evaluates the correlation between the average up-close and average down-close over a given period, usually 14 days. The reading of the RSI oscillates between 0 and 100 and is considered oversold when below 30 and overbought when above 70. The CCI lacks specific range limitations, which might make it more challenging to understand than the RSI. High positive CCI values imply that the asset is above its historical high, whereas low negative CCI values imply that the asset is below its historical low and is trading weakly.
- CCI, compared to RSI, does not have particle range bounds, which renders it more difficult to read.
Which is Better CCI or RSI?
Deciding whether CCI is better than RSI hinges on trading style, preferences, objectives, and market conditions you are trading in. While both indicators have their strengths and limitations, neither is inherently superior to the other. Some traders may prefer RSI for its simple interpretation and approach in spotting overbought or oversold conditions, while others appreciate the adaptability and effective functioning in cyclical and trending market conditions. The selection of CCI or RSI should align with the individual strategy and market analysis needs of the trader.
Moreover, it is necessary to remember that no single can guarantee successful trades. Profitable trading usually involves using multiple technical indicators in combination with other forms of analysis to confirm signals and decrease the possibility of false positives.
Moreover, backtesting and practicing both indicators can help traders better understand their nuances and determine which one aligns best with their trading strategy.
Conclusion
In conclusion, both CCI and RSI can be valuable momentum oscillators for stock analysis and trading approach development, however, they have different strengths and applications. Incorporating them into your technical analysis toolbox can help you make more informed trading decisions and navigate the dynamic space of the financial markets more efficaciously. Still, the best way to decide which is better between the two is to experiment with both indicators and observe which one matches your trading style and investment goals.


