


The Commodity Channel Index is a flexible indicator that can be used to spot emerging patterns or signal dangerous circumstances.
The CCI was created by Lambert to identify cycles in the commodity markets, but it can also be used to equities, foreign exchange, cryptocurrency, and other financial instruments.
CCI generally shows current price levels relative to average price level over time. When prices are much above average, the CCI can be quite high, but it can also be quite low when prices are significantly below the median.
What is Commodity Channel Index?
One form of technical indicator that compares current prices to a typical average price over a specific time period is the commodity channel index. This program was originally designed by Donald Lambert to monitor cyclical movements in commodity prices.
The CCI is used to identify overbought or oversold conditions because it is regarded as a momentum oscillator.
A fundamental assumption has been made in the CCI Index: commodities move in cycles, and highs and lows are periodically triggered. According to the data, one of these cyclical reverses would happen soon, if CCI indicator in overbought or oversold region.
The Commodity Channel Index Formula
The CCI is used to identify potential market reversals. The CCI is calculated using the following formula:
CCI = 100 ( TP – SMA(TP) ) / (0.015 ATR),
TP = typical price, defined as the sum of the high, low, and close divided by three,
SMA(TP) = simple moving average of TP over a specified period,
ATR = average true range over a specified period.
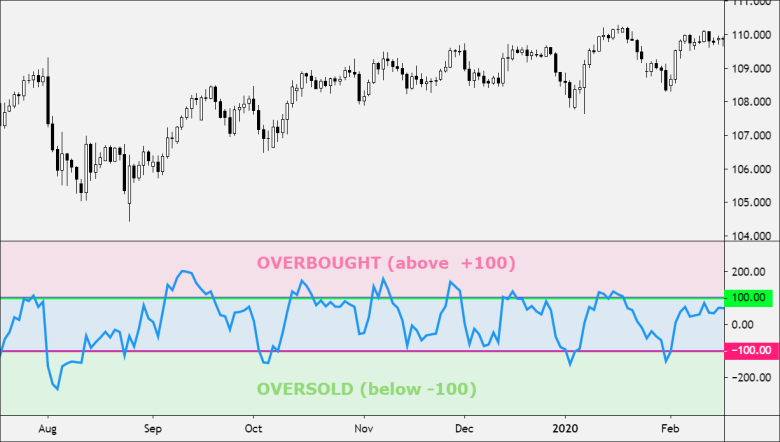
The CCI normally ranges from -100 to 100. When the reading is greater than 0, prices are above the moving average; when it is lower than 0, prices are below the moving average. Traders often look for readings above 100 or below -100 to signal a potential change in market direction.
The CCI, however, is a lagging indicator, which means that it will only give signals after a change in the direction of the market has already taken place.
Defining Overbought and Oversold levels with CCI values
Traders use the Commodity Channel Index (CCI) to assist them spot overbought and oversold market circumstances. The current price of a securities and its past prices are factors into the calculation used to determine the CCI. Normally, the CCI ranges from -100 to +100, with readings above +100 signifying an overbought market and readings below -100 signifying an oversold market. These levels can change, though, depending on the specific asset being traded.
The CCI is frequently combined with other technical indicators by traders to assist validate trade suggestions.
Using CCI to Find Asset Trend Direction
Traders can determine whether price is moving up or down with momentum by looking at the CCI. If the CCI is less than 100, a downtrend in the price is present. On the other hand, if the CCI is greater than 100, the price is in uptrend.
Using CCI to find Bullish/Bearish Divergences
Traders frequently use CCI during technical analysis to look for divergences (commodity channel index). Technically speaking, CCI gauges how strongly a price movement is occurring.
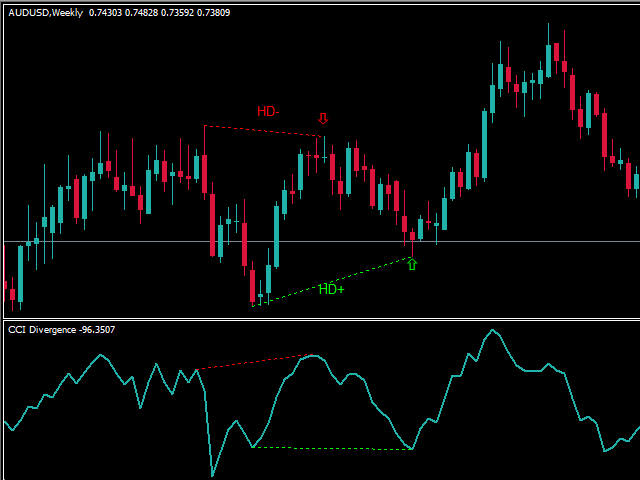
Divergences between the CCI and the price can be used by traders to spot future market reversals. An indication of a potential price reversal to the upside would be the CCI rising when the price is decreasing, for instance. Similar to the last example, a possible reversal to the negative could be indicated if the CCI is declining while the price is rising.
The key is to look for divergences that are not too close together, as this could simply be noise in the market. By using CCI to identify divergences, traders can potentially profit from reversals in the market.
A bullish divergence occurs when the security price reports lower lows, but CCI forms higher lows, showing less downward momentum. A bearish divergence occurs were security reports higher highs but CCI forms lower highs. During an upward trend, a bearish pattern can show several bearish deviations.
How the commodity channel index (CCI) works
The commodity channel index (CCI) measures whether a market is overbought or oversold. The CCI value typically ranges from +100 to -100, hence buy and sell signals only work 20–30% of the time. Lambert’s CCI trading recommendations were focused on changes above or below 100 that produced buy or sell signals.
Buy and Sell Signals While New Trend Emerging
CCI movements occur most frequently between -100 and +100. Moving over these limits shows unusual strengths and weaknesses that can prefigure long moves. You could use this level to make bull or bear filters.
Identifying Emerging Trends and Generating Trading Signals
Technically the CCI favors bulls if positive and bears if negative. Nevertheless, using simple zero-line crossovers could yield numerous buy and sell signals. The table below displays Caterpillar CCI for 20 days of a given period. In the first seven months, four trends were detected.
CCI and other Indicators: A Winning Combination in Trading
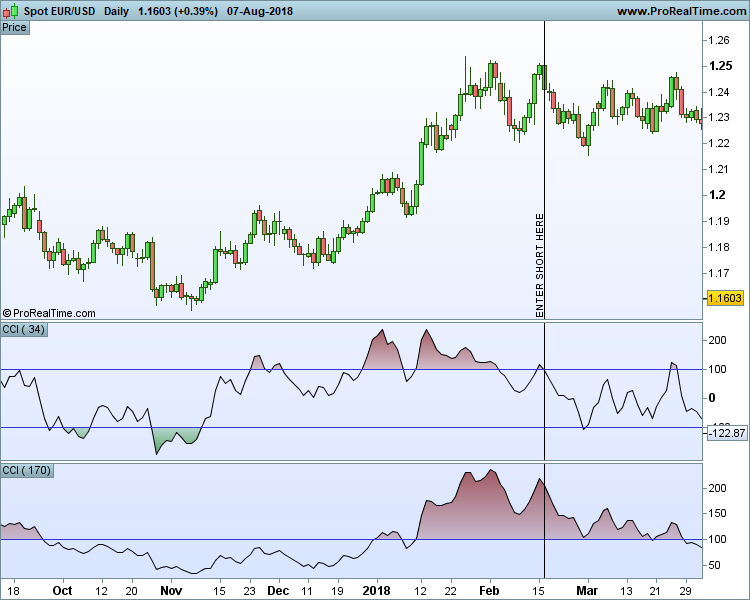
The importance of having multiple indicators at one’s disposal when trading as no single indicator can provide a complete view of the market. The Commodity Channel Index (CCI) is one such indicator that can be used in conjunction with other technical indicators such as support and resistance levels or moving averages to make more informed trading decisions. The use of multiple indicators together can provide a more holistic view of the market.
How to Use CCI on Your Trading Strategy
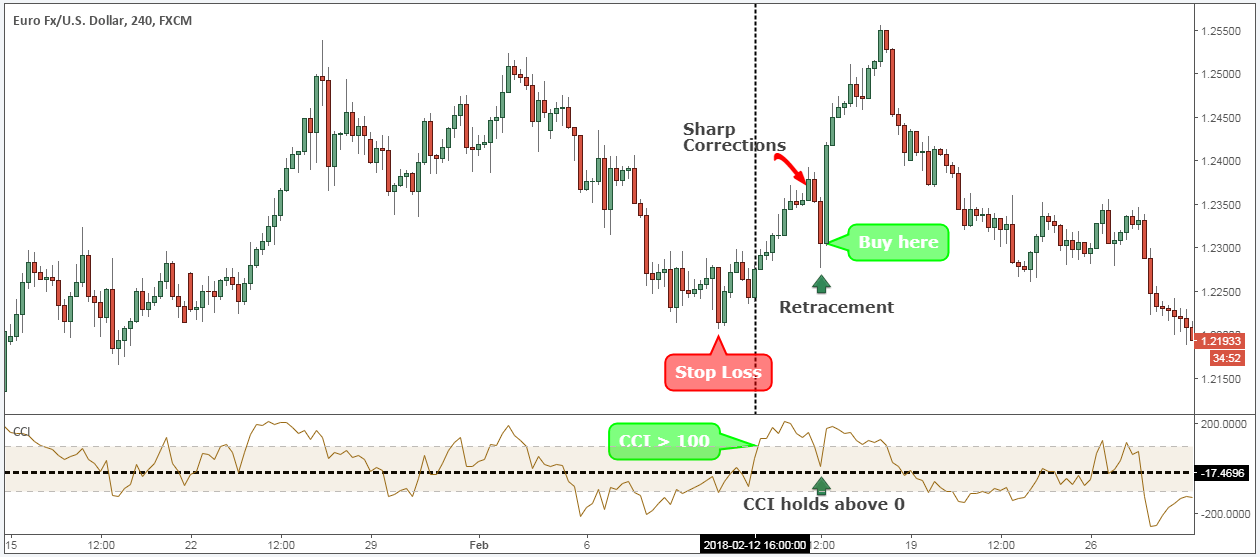
One popular way to use CCI is by looking for price action trading setups that form after the CCI indicator has moved into extreme territory. These setups can often lead to quick and profitable moves in the markets.
To get the most out of using CCI in your trading strategy, it’s essential to do your research and practice using the indicator in a demo account before implementing it in live trading. By understanding how the CCI works and its limitations, you can make more informed trading decisions.
Limitation of Commodity Channel Index
Commodity Channel Index (CCI) being a popular indicator used by traders to spot potential price reversals, but also notes that the CCI can give false signals, especially in choppy markets. To avoid this, traders should use the CCI in conjunction with other indicators like support and resistance levels to confirm potential reversals.
Conclusion
The Commodity Channel Index (CCI) is a versatile indicator that can be used to identify new patterns or extreme conditions in different financial markets. It was developed by Lambert to detect cycles in commodity markets, but can also be applied to stocks, forex, crypto, and other instruments. CCI measures the current price level in relation to average prices over time, which can help determine overbought or oversold levels. It ends by promoting a CCI-based trading strategy subscription service.


