


If you are a trader, or have just begun with trading, then you must have heard of Average True Range or ATR. However, what is Average True Range or ATR? What purpose does the ATR indicator serve traders?
In this blog, we will find the answer and know how to use Average True Range as a Volatility Indicator.
What is Average True Range (ATR)?
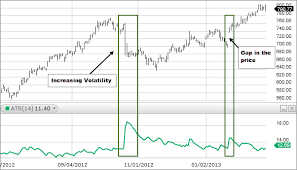
As the name suggests Average True Range ATR happens to be the average of true ranges over a specified period. We can use ATR to measure volatility. Average True Range takes into consideration any gaps in the price movement.
Usually, your Average True Range calculation is based on 14 periods. This time period can be intraday, daily, weekly, or monthly.
For measuring recent volatility, you should use a shorter average like a time period of 10 to 12. On the other hand, for calculating longer term volatility, a time period of 20 to 50 is perfect.
How the average true range indicator works?
If the ATR indicator is expanding, it means that the market volatility is increased with the range of each bar getting larger. A price reversal with an increase in ATR indicator will indicate strength behind the move. However, an average true range indicator is not directional.
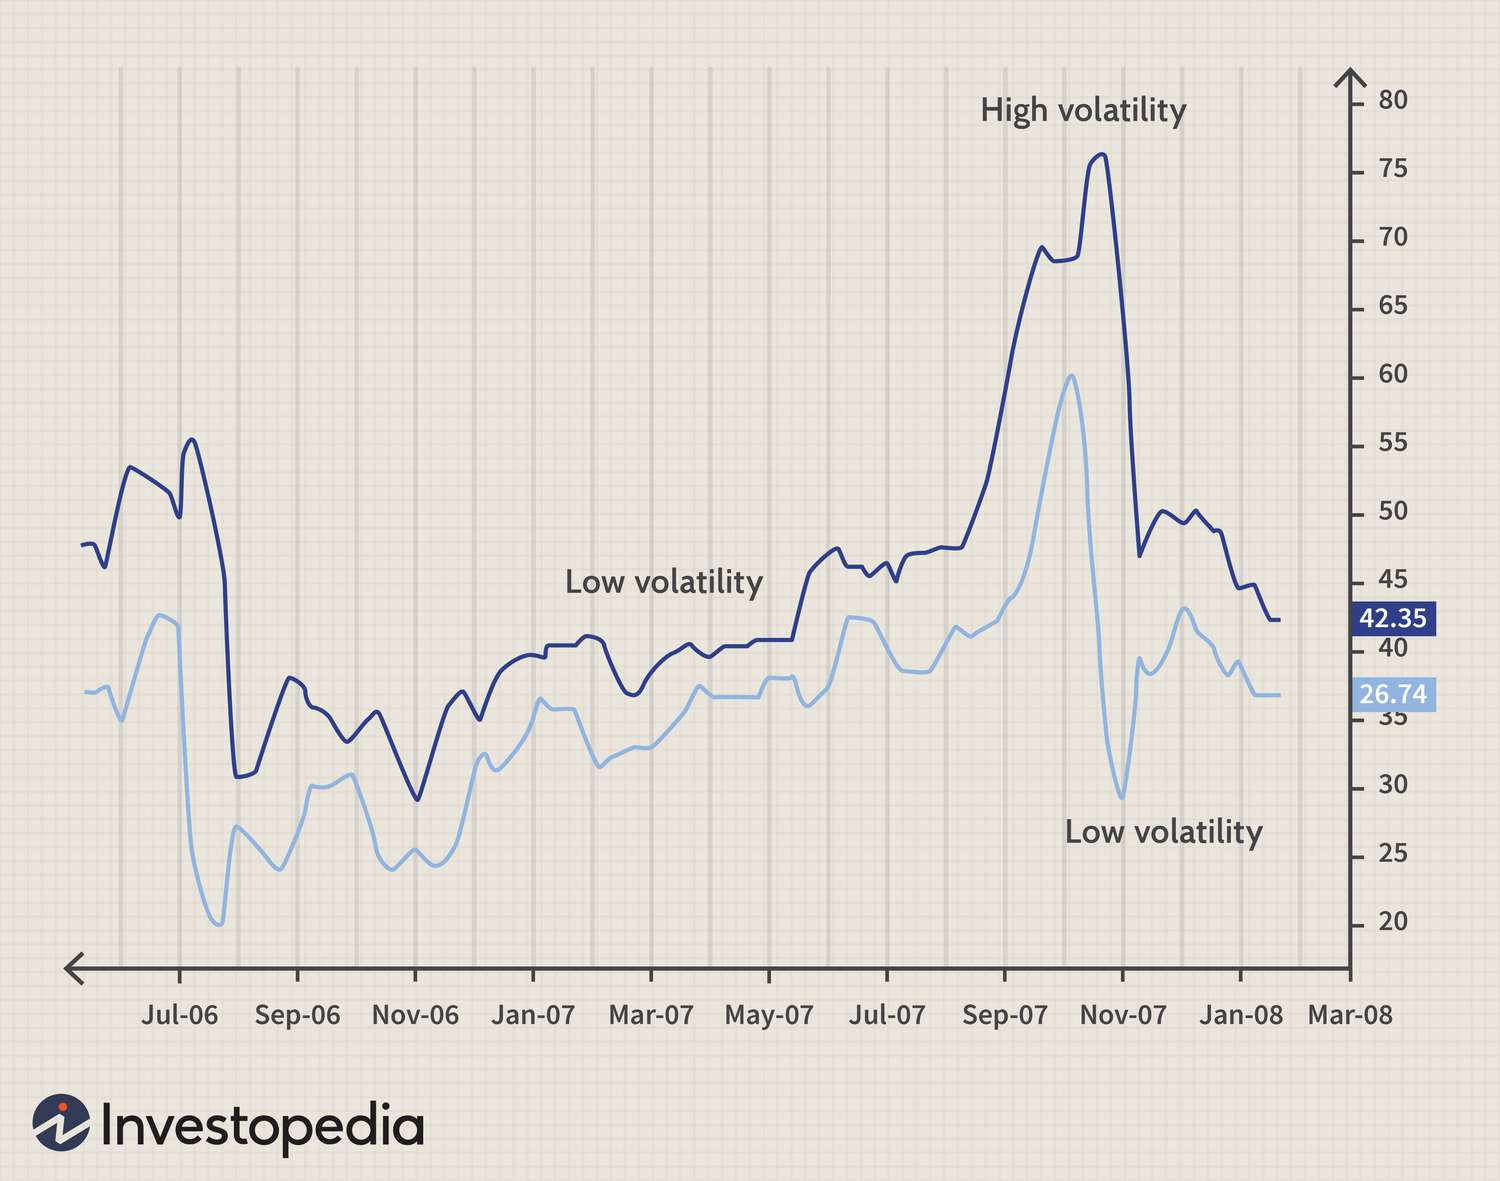
So an expanding ATR indicator can indicate a sell signal or buy signal. a high ATR value usually results from sharp advances or declines. It will unlikely sustain for longer periods.
A low ATR value indicates a series of periods with small ranges or quiet days in the average true range indicator. We find these low average true range values during extended sideways price action. A prolonged time of low ATR values may indicate a consolidation area with the possibility of a continuation move or price reversal.
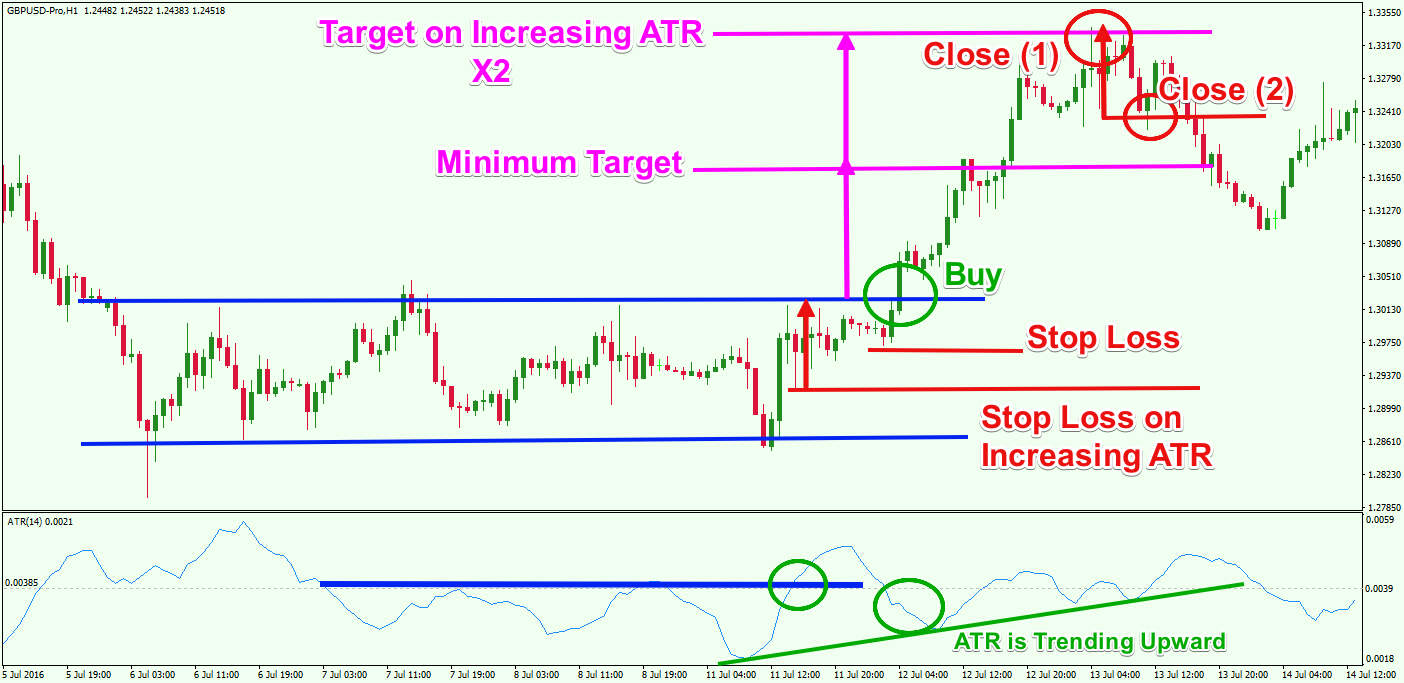
Average true range is very useful for stop loss and entry triggers, which signal changes in volatility. Whereas, a fixed percentage or dollar-point stop loss will not allow for volatility, the ATR stop loss will adapt to sharp price moves or consolidation areas, triggering an abnormal price movement in either price direction.
We can use a multiple of ATR such as 1.5 x ATR to catch these abnormal price moves.
How to Calculate ATR – formula
ATR calculation is very easy. All it takes is using a simple formula. let’s see the average true range formula below.
ATR = (Previous ATR * (n – 1) + TR) / n
-
Where:
-
ATR = Average True Range
-
n = number of periods or bars
-
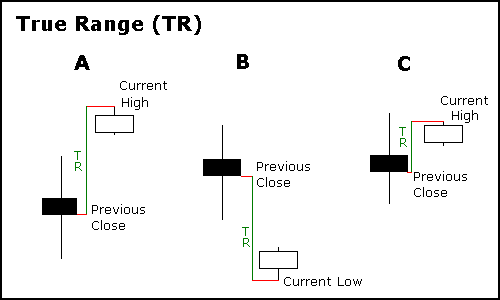
TR = True Range
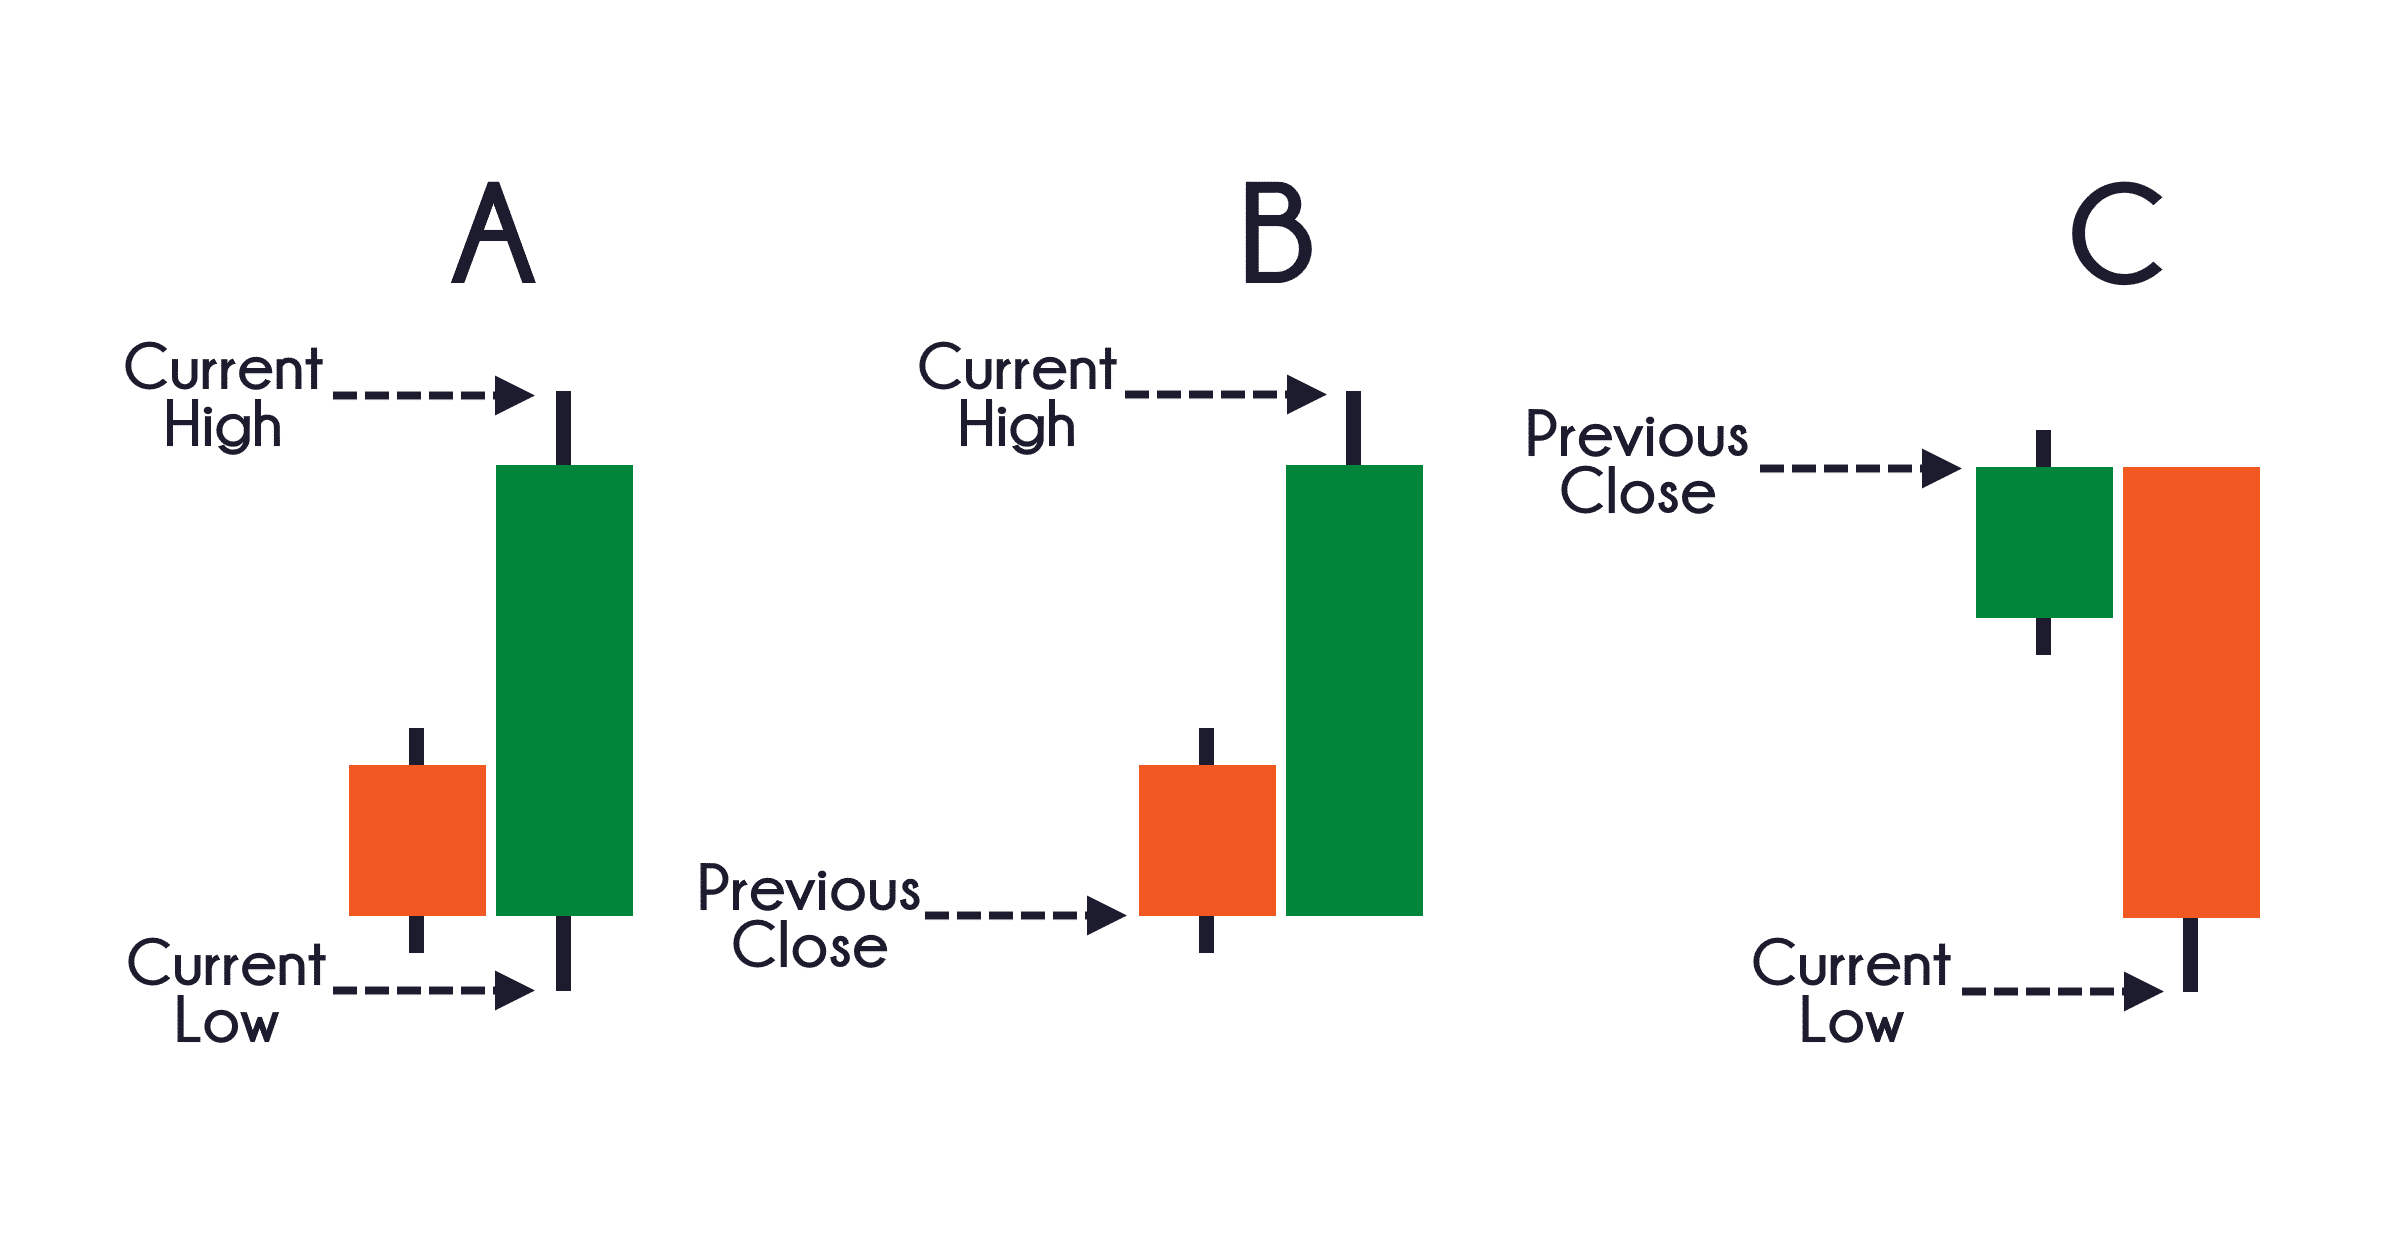
The True Range for today or daily ATR is the greatest of the following:
-
Today’s low subtracted from today’s high.
-
Yesterday’s close subtracted from the absolute value of today’s high.
-
Yesterday’s close subtracted from the absolute value of today’s low.
How Average True Range (ATR) Can Improve Your Trading Performance?
In simple words, a stock that gets a high level of price volatility has a higher average true range (ATR). However, an asset with a lower volatility holds a lower ATR. Traders can simply use the indicator to enter and exit trades and mark a stop loss and take profit orders. The average true range (ATR) trading strategy can be of great help to you, when you are making trade decisions.
We commonly use the ATR indicator as a stop loss tool. When the ATR is high, traders need to be ready for greater price volatility and wider price fluctuations. a wise strategy here is to set your stop loss further away and avoid being kicked out of the trade earlier than you would like.
On the other hand, when the indicator signals lower volatility, traders may use a closer stop loss.
the average true range indicator also assists you understand the profit potential while trading. One can mark a closer take profit in a low volatility market and make it further away, if the price volatility skyrockets.
Absolute Average True Range
Based on true ranges using absolute price changes, the average true range indicator reflects price volatility as an absolute value, meaning that the average True Range is not reflected as a percentage of the current close. Rather, it means that stocks with high price will have a higher ATR than the assets with a low price.
How to Read and Use Average True Range
Average True Range is a technical analysis indicator measuring the volatility of a stock or other security over a period. It is not a measure of price direction, but a measurement of daily degree of price change.
You can use these indicators to identify possible breakouts or as the basis for marking trailing stop loss orders.
Example of Using ATR
Traders may use these details to track the asset price moves, usually in a certain period for marking profit targets and finalizing on whether to attempt a trade. Let’s see an example.
Let’s assume you collected the prior 14-day ATR for asset ABC and found it is 2 dollars. Looking at today’s stock, you will first collect the following details.
- Today’s high is 32 dollars.
- Today’s low is 29 dollars.
- Yesterday’s close is 30 dollars.
You will now find the current true range by using the largest value from the below 3 calculations.
- 32 – 30 = 2.
- 29 – 30 = -1.
- 32 – 29 = 3.
3 will be used, since it is the highest to determine the current 14-day period average True Range to determine how volatile the stock may be.
Formula = (($2 x 13) + $3) / 14 = $2.07.
The stock is up 3 dollars since the trading range is 3, with the price moving 47 percent more than average (2.07), which gives you a buy signal with this trading strategy.
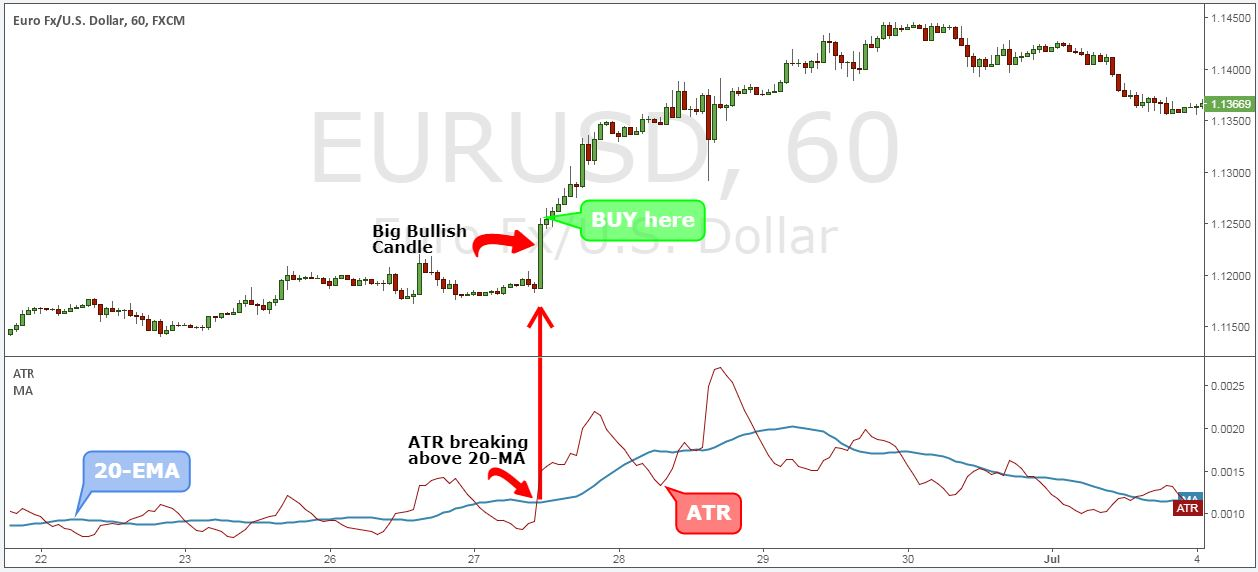
ATR breakout alerts
we can think of a breakout as a move outside the defined support or resistance area. We can use average True Range breakout signals to identify potential buy and sell opportunities.
When the current average True Range is above the breakout level it is a buy sign. On the other hand, when the current average True Range is below the breakout point, it is a sell signal.
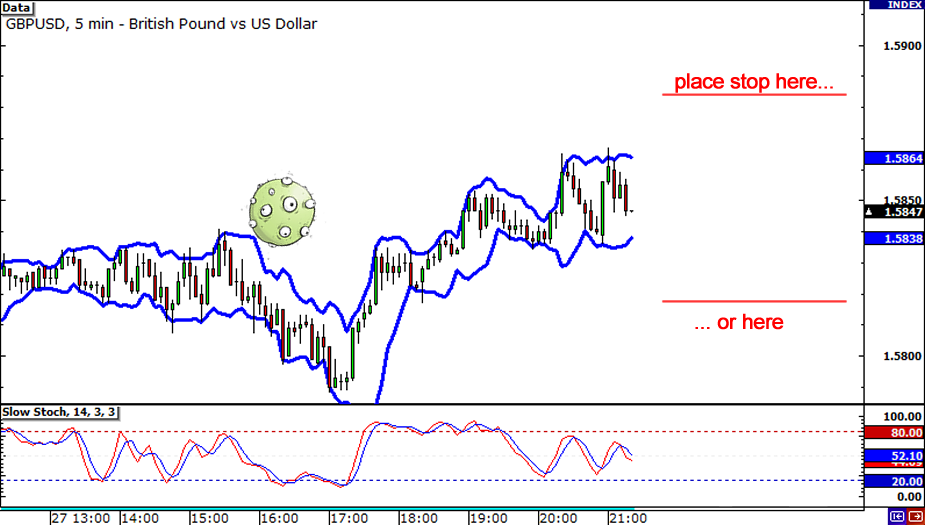
Trailing Stop Loss by Using ATR
A trailing stop loss is a way for you to exit a trade, if an asset’s price goes against you. However, it also enables you to move the exit point, if the price is moving in your favor.
Many day traders use the ATR to figure out where to mark their trailing stop loss. At the time of trading, look at the current value of the reading. A rule of thumb for you is to multiply the average of true range by two to decide a reasonable stop loss point.
So, if you are purchasing an asset, you might put a trailing stop loss at twice the level of average of true range below the entry price. On the other hand, if you are shorting a stock, you will mark a stop loss at twice the level of average of true value.
Limitations of ATR
When, you are using ATR in your trading practice, keep in mind, it is not a directional indicator and measures only volatility (high volatility or low volatility). Furthermore, ATR is a subjective measurement not usable as a standalone indicator, giving you some insights of whether the price trend is about to reverse or not.
Still, the ATR is an overall great tool, when it’s about adapting to the ever-changing market environment. When used with other indicators or technical trading systems, it can help you have the most profitable trading experience.
Conclusion
So overall, we conclude that knowing how to use the average True Range can help you set better profit targets and stop losses, as it gives you a more accurate idea of a security’s volatility.
Using ATR for trading will definitely help you get better trade performances.


