

Both leading and lagging indicators have practical uses because they can provide traders with the knowledge they need to make trading decisions. In this post, we will talk about trading’s popular leading indicators and popular lagging indicators and how to use them to enhance your technical approach. Therefore, let’s get started.
Introduction
Trading indicators include both popular lagging indicators and leading indicators. In essence, it depends on the kind of information they offer and how quickly they react to price-related behaviors. If an indicator moves ahead of or behind another parameter, such as price action, it is said to be a leading or lagging indicator.
Leading indicators are used to forecast future price changes as opposed to lagging indicators, which are used to confirm prior market moves. The theory underlying leading indicators states that by observing how the market and its participants act, market trends and turning points can be predicted.
They provide early indications about the possible direction of the market, which can be used to choose whether to buy or sell. Leading technical indicators include things like moving averages, the relative strength index (RSI), and the stochastic oscillator.
On the other hand, the idea underlying lagging technical indicators is that market trends and turning moments can be found by looking at previous market data. They send indications after a trend or reversal has already begun to help traders locate potential entry and exit locations and to confirm trends.
Lagging indicators include things like trendlines, moving averages, and Bollinger Bands.
What is a leading indicator?
A leading indicator indicates that it will provide data before another statistic. Leading indicators are those that basically predict when the price might go forward. Price action is essentially something that is associated with the majority of circumstances. if a price is declining and an indicator starts to rise before the price. This could be suggested as a leading indicator because it predicts a price increase.
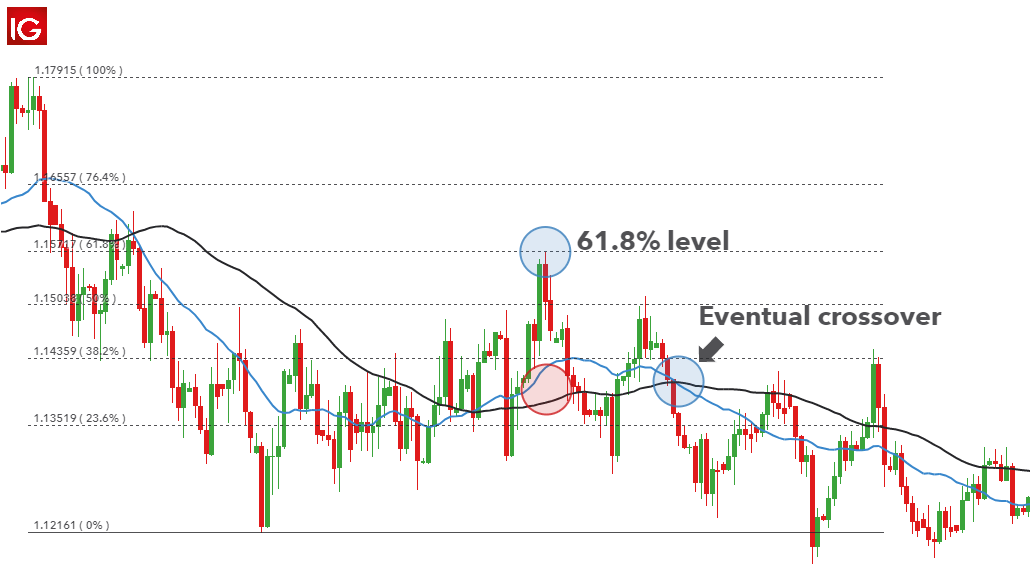
Fibonacci retracement and extension tools, for instance, are both regarded as leading indicators. As they both try to anticipate where the price might go next before it really happens. Remember that leading indicators are not always reliable. The price will occasionally move in the direction that the indication points, and occasionally it will not. It is preferable to merely employ trading strategies and not rely heavily on them.
What is a lagging indicator?
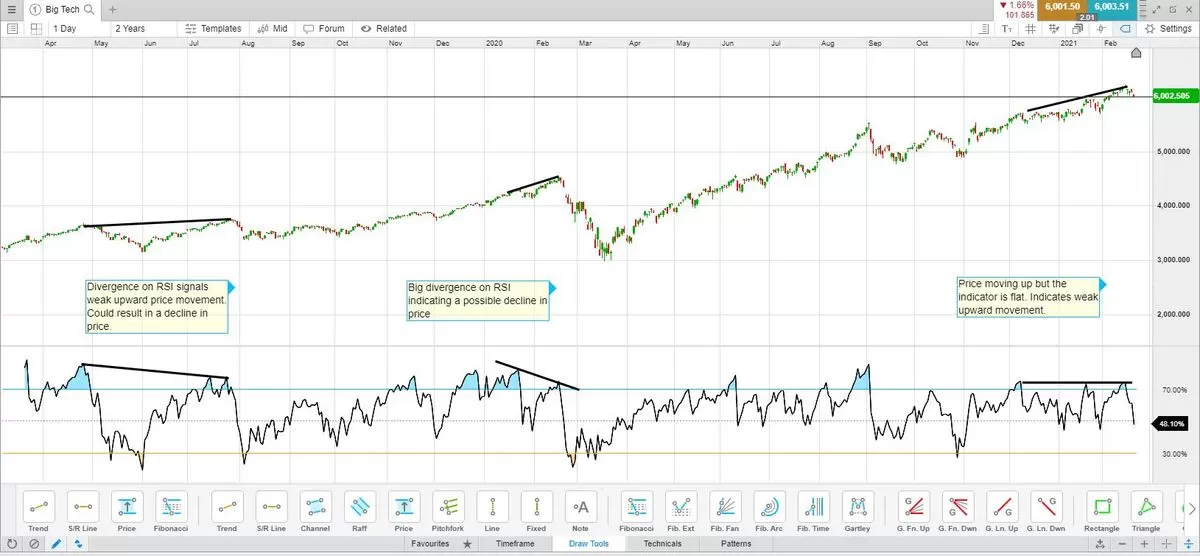
Given that they exclusively concentrate on real data, the majority of technical indicators are lagging indicators. It is also not advised to use the way in which the price will increase. Although in some situations, such as divergence, lagging indicators act as a price guide.
When the price constructs a current arising greater than a prior swing but the indicator does not, there is a divergence. Alternatively, the indicator does not create a new low under a previous swing low while the price does. In essence, this is a sign that the price may be declining and that the trend may be about to change.
Lagging indicators are useful because they can make price movements easier and give traders the impression that the price has been found. Also, forecast future price movements. These might improve or upgrade their notion of where the price might go up from there. However, it is impossible to determine which indicator is the best. Both leading and lagging indicators can be used as trading tools to help in decision-making.
The following chart displays many instances of divergence utilizing the Relative Strength Index (RSI) on a trading chart
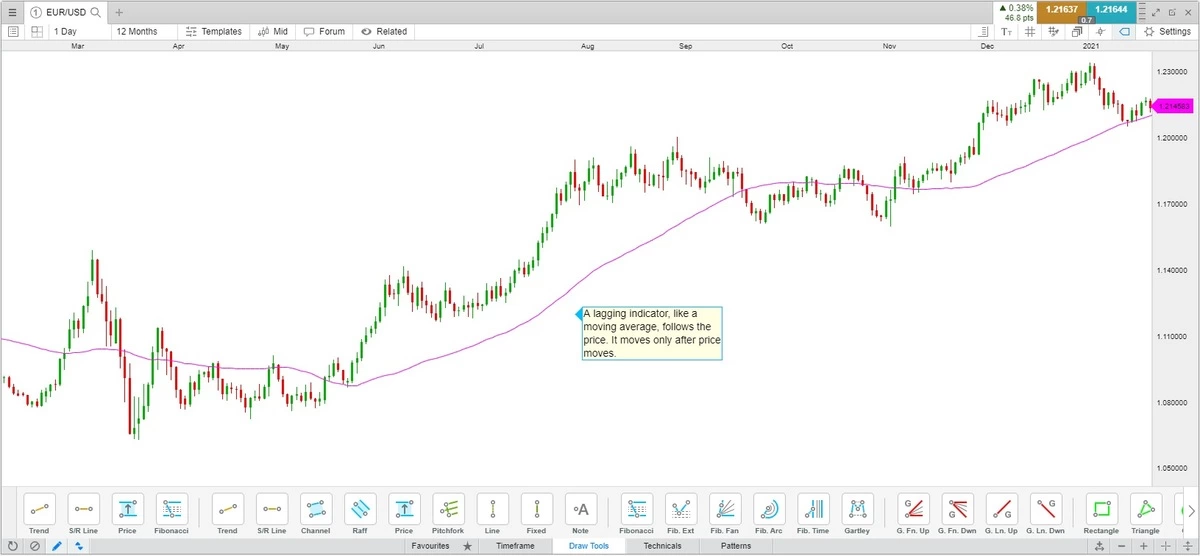
A lagging indicator often follows the price and gives the trader delayed feedback. A lagging indicator is something like a moving average. The moving average may continue to rise after the price does if the price is falling and then rising again.
What are the examples of leading and lagging indicators?
Leading indicators: Relative Strength Index(RSI)
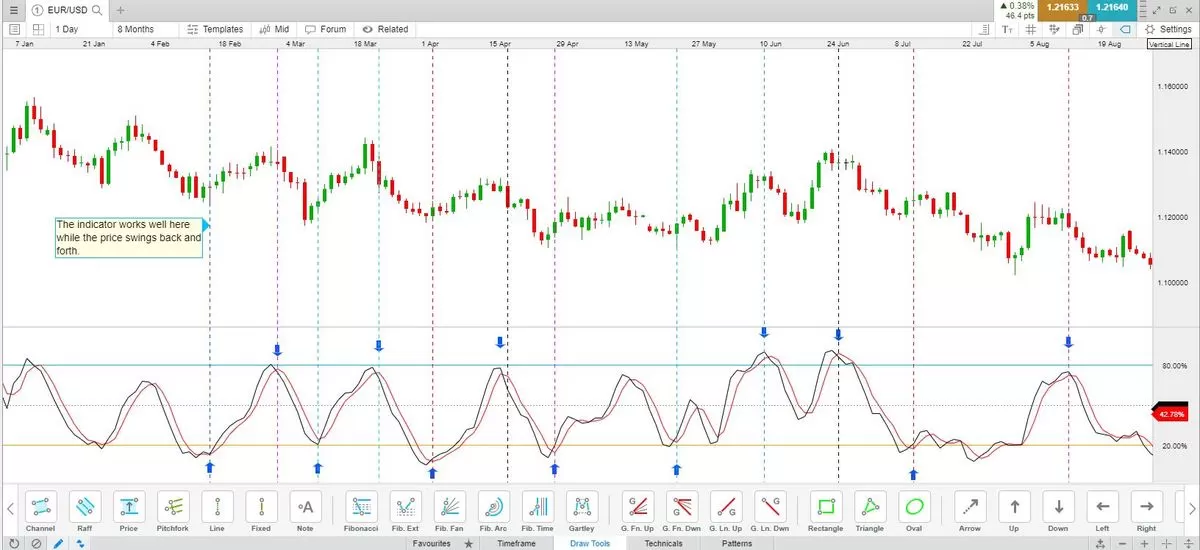
A technical indicator that functions as both a leading and lagging indicator are the relative strength index (RSI). It is a lagging indicator in the broadest sense since the price must move before the indicator starts to move in the desired direction. The pricing basically goes forward with a slight delay. It is moreover a leading sign.
When the RSI reaches its maximum value, it may be a sign that the price has reached its limit and may soon change course. However, because the indicator lags the price, traders may decide to wait for the price to start changing before acting on the indication.
The RSI can also become a leading indicator through divergence, which provides a sense of when trends may be emerging from a state of stagnation and are ready to change.
As was already mentioned, divergence can also turn the RSI into a leading indicator, revealing when trends may be about to fizzle out and turn around.
Lagging indicator: Simple moving average(SMA)
Moving averages are regarded as lagging indicators since they merely follow prices after a delay. For instance, the moving average could start moving after the price moves, if it drops and then rises.
Moving averages can also be thought of as a leading indicator because moving averages might indicate potential areas of support or resistance for the price in the future. As a result of mean reversion, where prices return to more normal levels after advancing away from the moving average, the price will frequently retrace to the moving average.
The longer the moving average is or the more periods are used in its calculation, the less frequently the price will return the moving averages.
The following chart demonstrates how a simple moving average (SMA) functions as both a lagging and a leading indicator since it moves with price but in a delayed manner and because it also serves as a leading indicator because of the price’s propensity to return to the average.
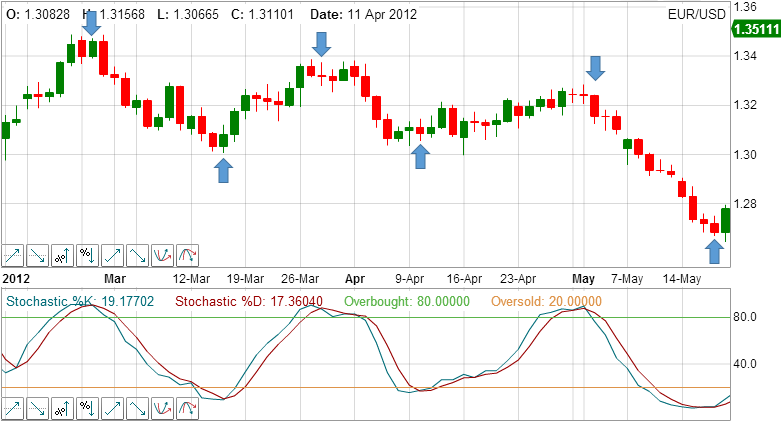
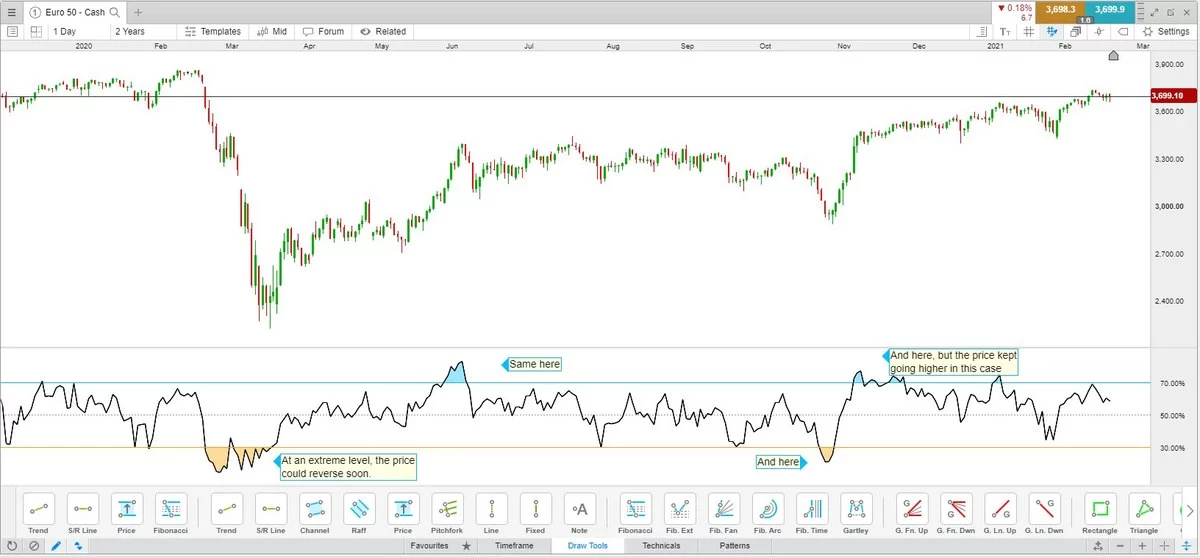
Leading indicator: Stochastic oscillator
The stochastic oscillator is primarily used to illustrate the potential for price changes and price overshoots. It acts as a leading signal in this situation.
Overall, the indicator lags behind the price since it compares the most recent closing price to the closing prices of earlier price bars. As a result, the indicator will also lag behind time.
The stochastic oscillator reveals potential overbought and oversold levels in range assets or assets that are moving moderately periodically higher and lower in overcast and overbudget zones.
Despite the fact that cloudy in an elevation may not necessarily indicate that a reversal is progressing, for example, a stochastic will also provide overbought and oversold levels during a trend. The reason for this is that prices might stay overbought or oversold for long periods of time in trends.
This indication occasionally fails when there is choppy price action, such as when the price moves quickly up and down. Due to the indicator’s lagging, trades may be entered even when the price is about to change again.
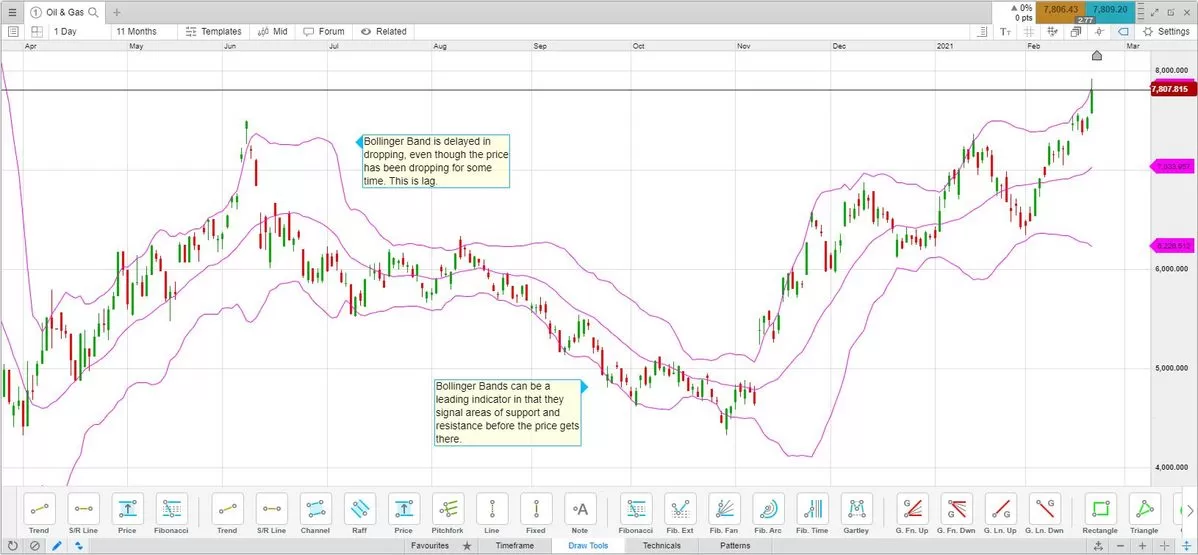
Lagging indicator: Bollinger bands
Bollinger bands are inherently trailing as a result of the previous considerations. Because the indicator does not respond until the price moves, Despite the fact that the outermost bands of Bollinger bands have a moving average, they can function as a leading indicator. Because they make it easier to spot areas where prices may decline or change.
We can observe that the Bollinger Bands respond to price changes a little bit slow on the chart below. Nevertheless, as the price fluctuates, the bands can be useful in identifying regions of dynamic support and resistance.
Leading vs lagging indicators
Although assembling a trading strategy, some traders go for a mix of leading and leading technical indicators. Some select leading and at the same time, others choose to lag. Honorable price action traders will not choose any kind of indicators rather than concentrates on investigating price charts with freehand.
It is not so much how an indicator is divided (leading or lagging indicators) that happens preferably how the indicator is used and clarified by the individual. Basically, both indicators have their own uses and inform traders something regarding price action.
Leading or behind are not superior to one another. It is crucial to include risk controls on each trade when utilizing any form of technical indicator or trading method in case the price doesn’t move in the anticipated direction.
One way of risk control is the use of stop-loss orders, which force the trade to close if the price moves in the opposite direction by a specific amount. However, stop-loss orders do not take into account market volatility, such as slippage or gapping on price charts. Another approach to risk management is position sizing.
Appropriate position sizing is a key aspect of risk management in trading. It involves picking the appropriate amount of capital to put into a trade in order to lower the chance of loss. This can be accomplished by allocating assets across a number of trades or by instituting a stop-loss to limit the potential loss on a single investment.
One of the main drawbacks of indicators is the possibility that they produce false indications. When an indicator forecasts a certain behavior but the price behaves differently than expected, this is known as a false signal.
Because of this, a trader could make a mistaken decision, such as shorting or selling when the price is actually poised to increase further. False signals serve as a helpful reminder of the importance of using risk management techniques, such as stop-loss orders and position sizing, when trading to minimize potential losses.
In conclusion, a trading strategy that relies exclusively on price action or a mix of leading and lagging indicators can be successful. To reduce possible losses, it’s crucial to comprehend how the indicators are being used and to incorporate risk-management strategies like stop-loss orders and position sizing. Indicator false signals also serve as a reminder of the value of risk management.
Difference between leading and lagging indicators in trading:
- The major distinction between the two indicators is that lagging indicators are outcomes of previous acts, whilst leading indicators are future-looking. Leading indicators are focused on results, whereas lagging indicators are output-focused.
- Leading indicators serve as a warning sign for the economy, whereas lagging indicators are the outcomes of changes that have already taken place in the past. Leading indicators are difficult to measure but simpler to change than lagging indicators, which are also easier to affect. Leading indicators track progress. They demonstrate the likelihood of achieving a goal.
- Making decisions based on leading indicators may or may not be accurate. This is so because a wide range of things affects the trend.
- Lagging indicators represent evidence of previous events, but leading indicators are like possibilities for the future. Before trailing indications show what has already happened, leading indicators let you make decisions.
- Lagging indications are like lessons that one might learn from prior acts, whereas leading indicators are watched before making any decisions to attain our goal. Lagging signs serve as a kind of affirmation that the trend is continuing.
- While lagging indications provide assurance, leading indicators act as warning signs. This is so because Leading indicators predict the future while Lagging indicators quantify the present.
- The leading indicator displays the trend that the economy may follow, while the lagging indicator displays the pattern that the economy is presently following. You need sophisticated tools and methods in order to track leading indicators.
For instance, the balance sheet, income statement, and cash flow statements all contain statistics that are lagging indicators.
Leading and lagging indicators in trading: How to trade with leading and lagging indicators
There are much well-known leading and lagging indicators available for trading, including:
- Bollinger Bands
- Relative strength index (RSI)
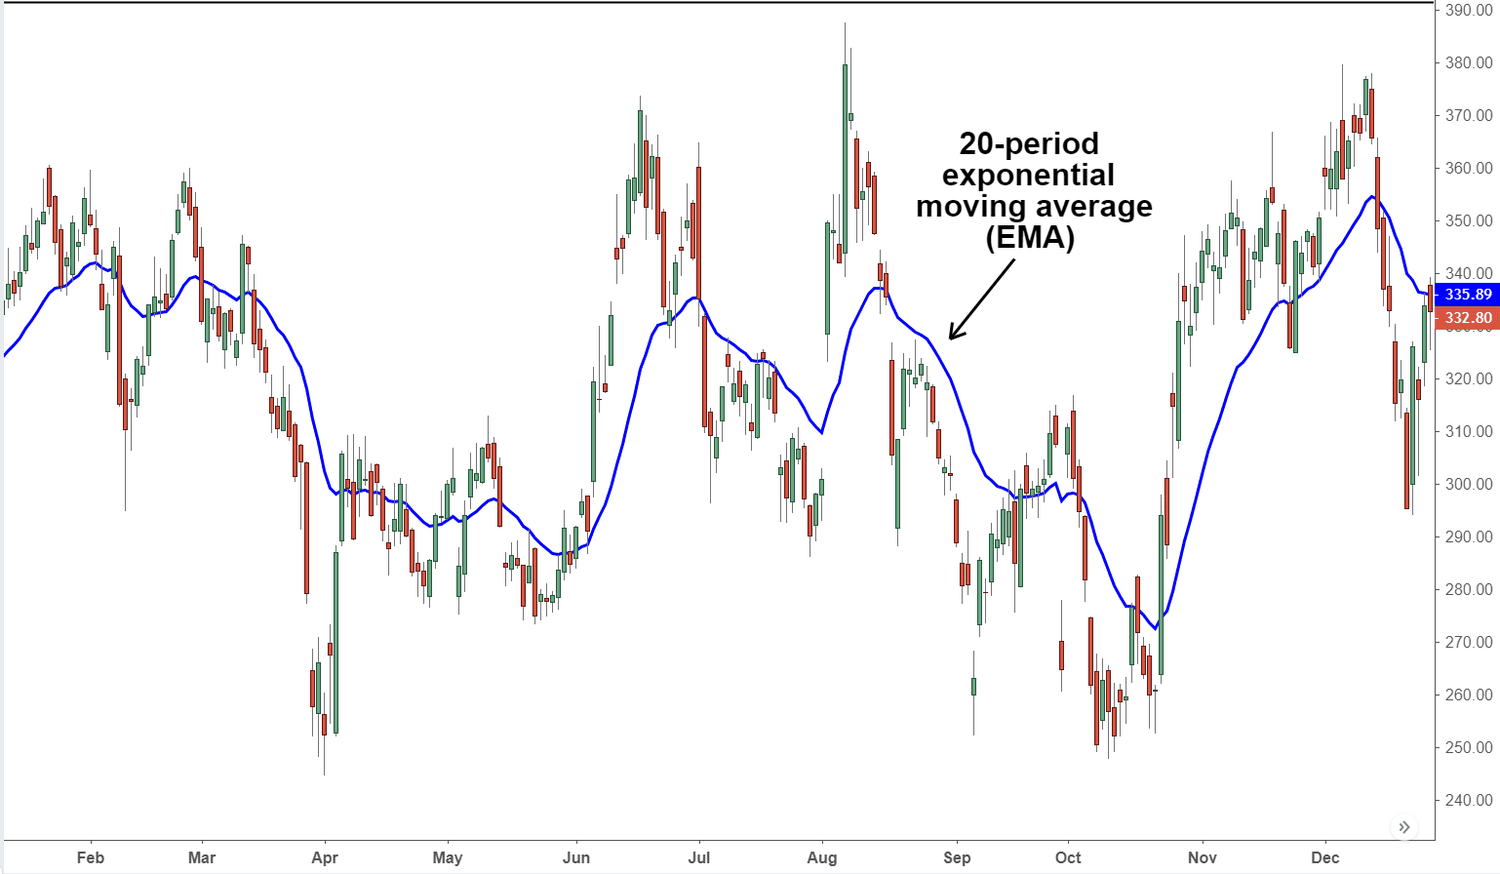
- Moving averages (simple and exponential)
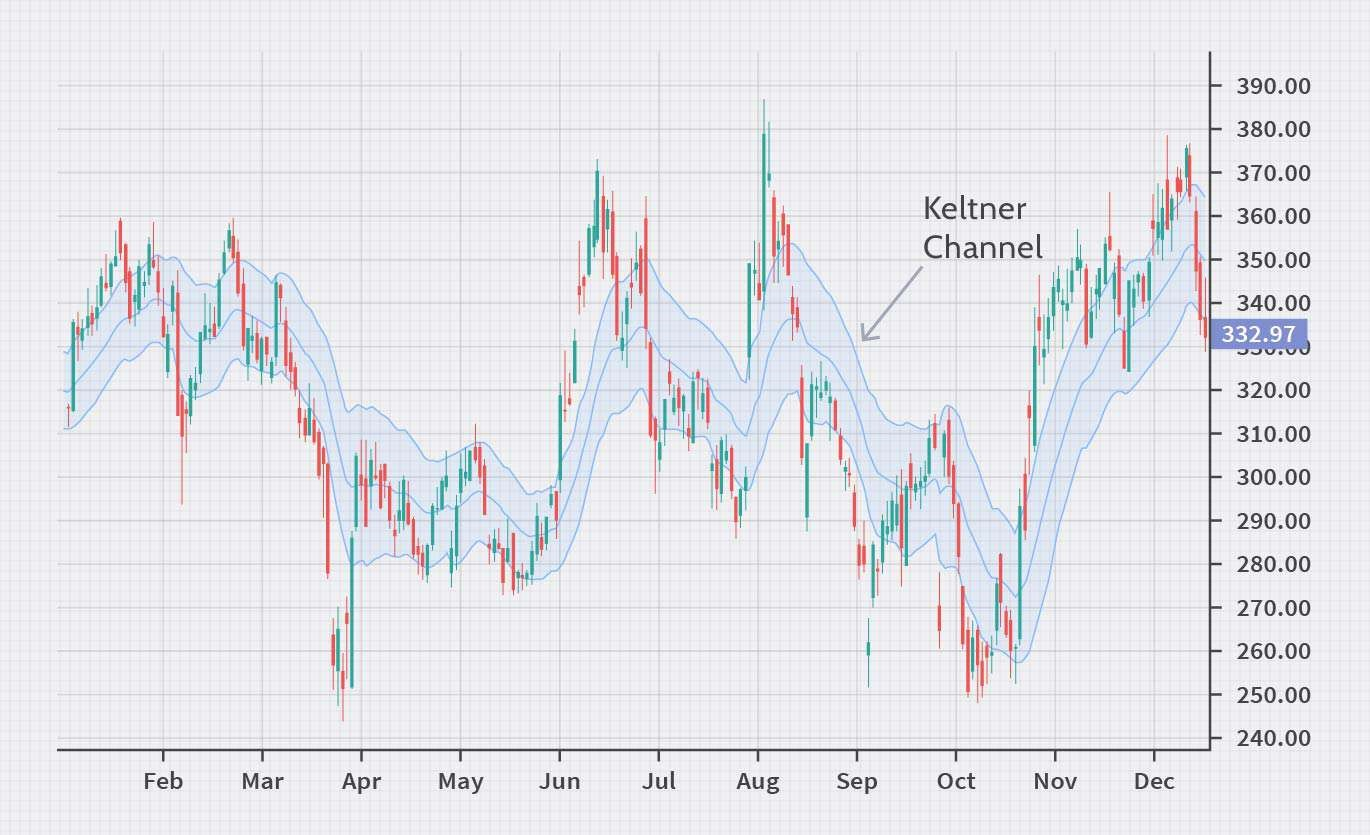
- Keltner channels
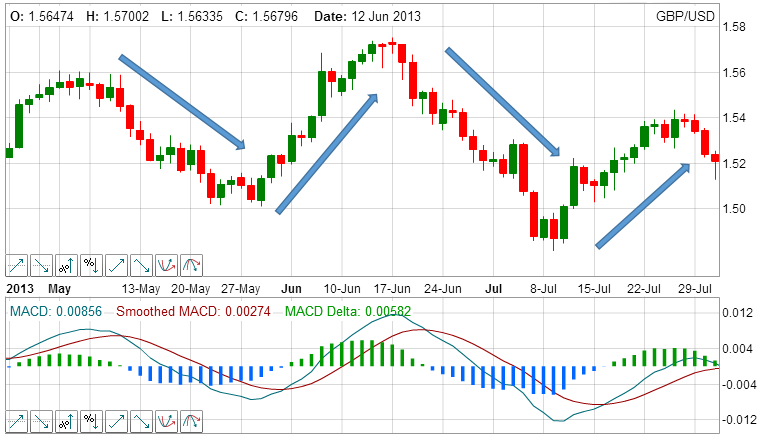
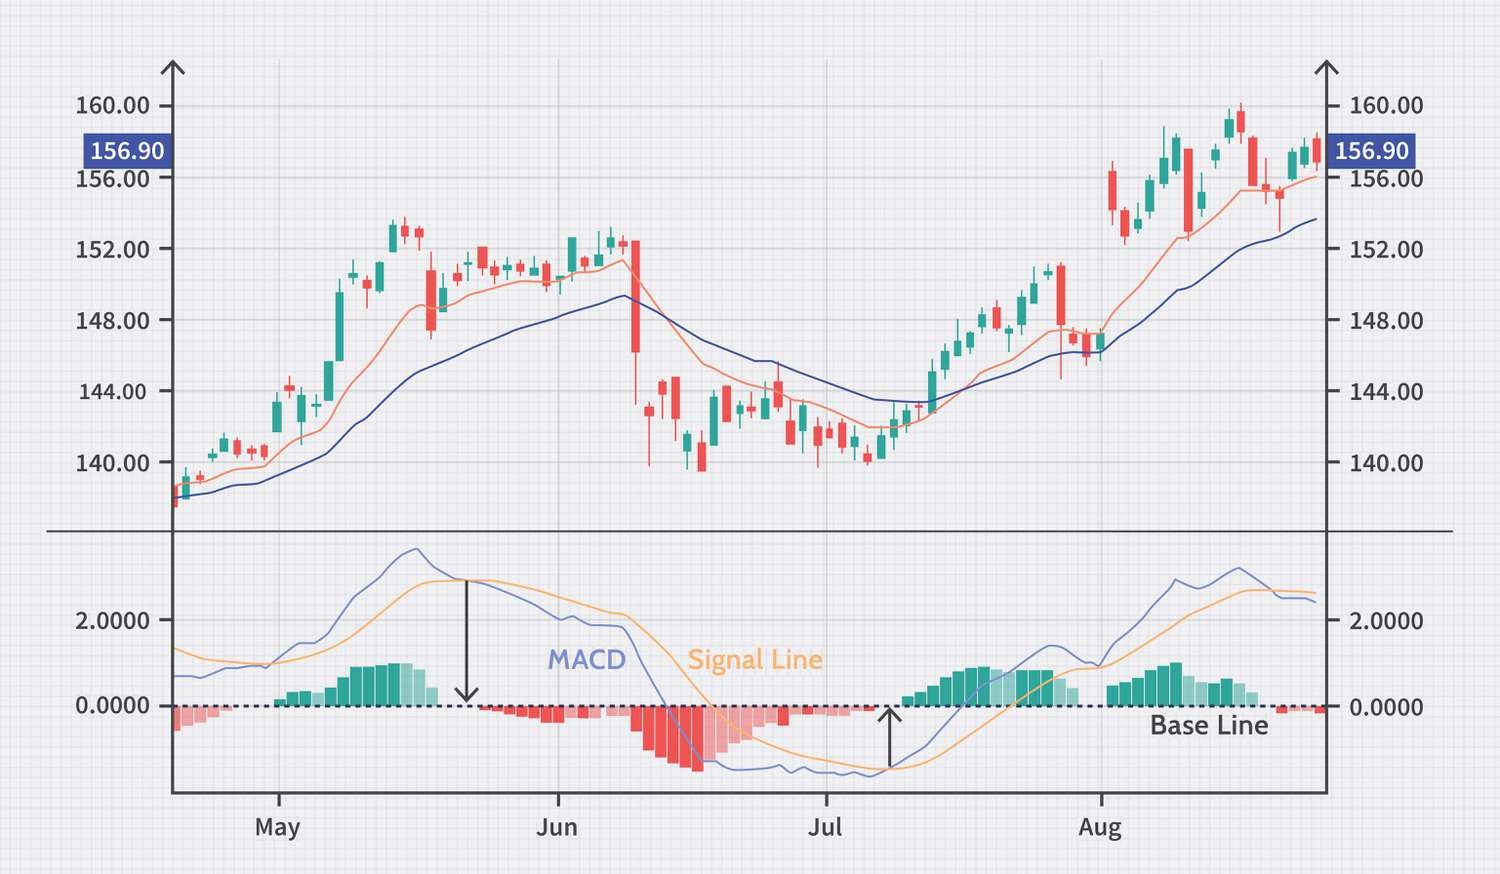
- Moving average convergence divergence (MACD)
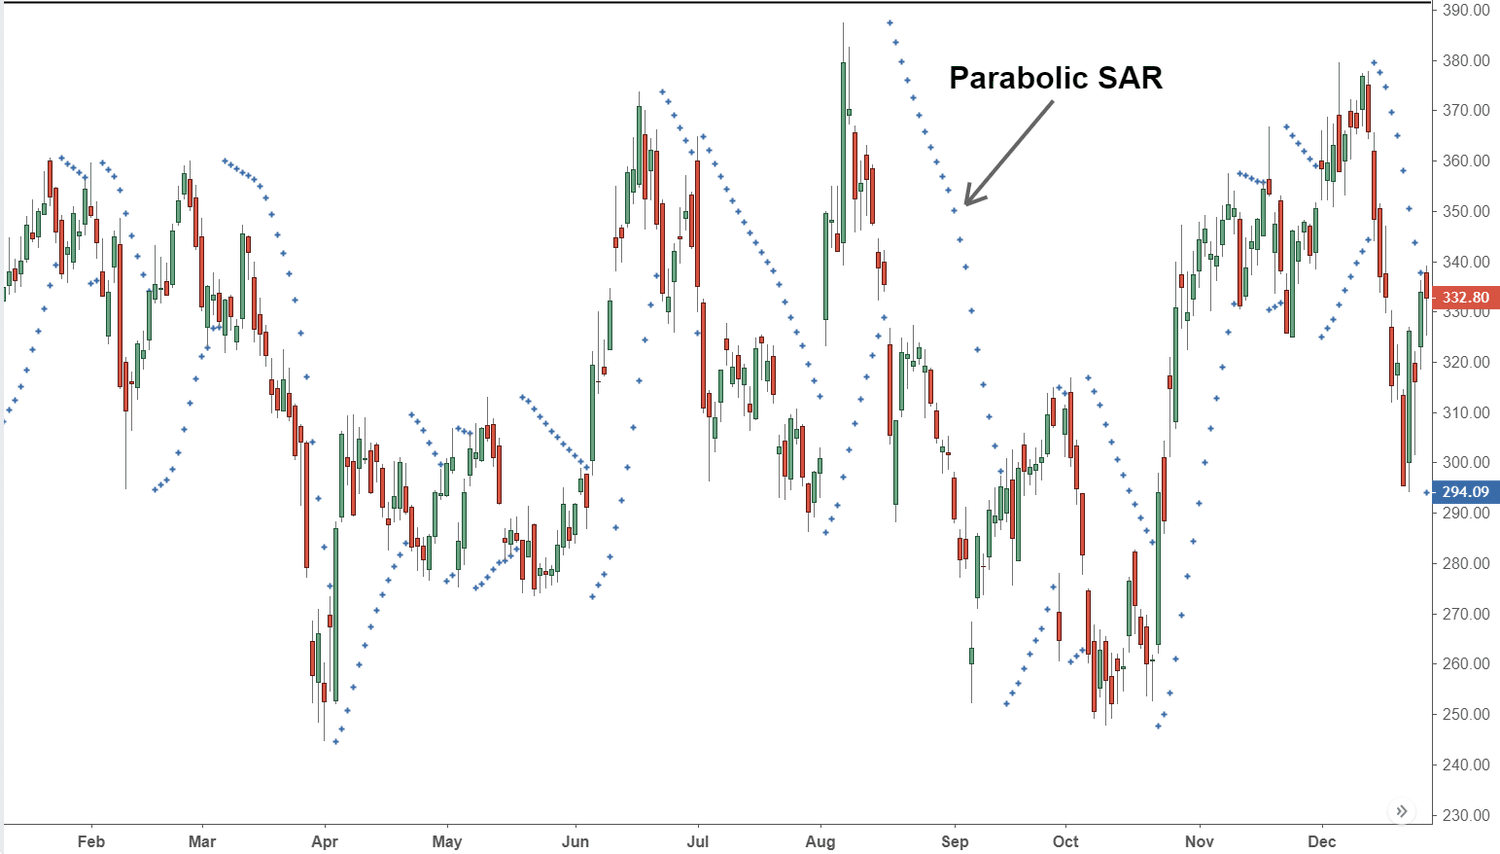
- Parabolic SAR
- Average true range (ATR)
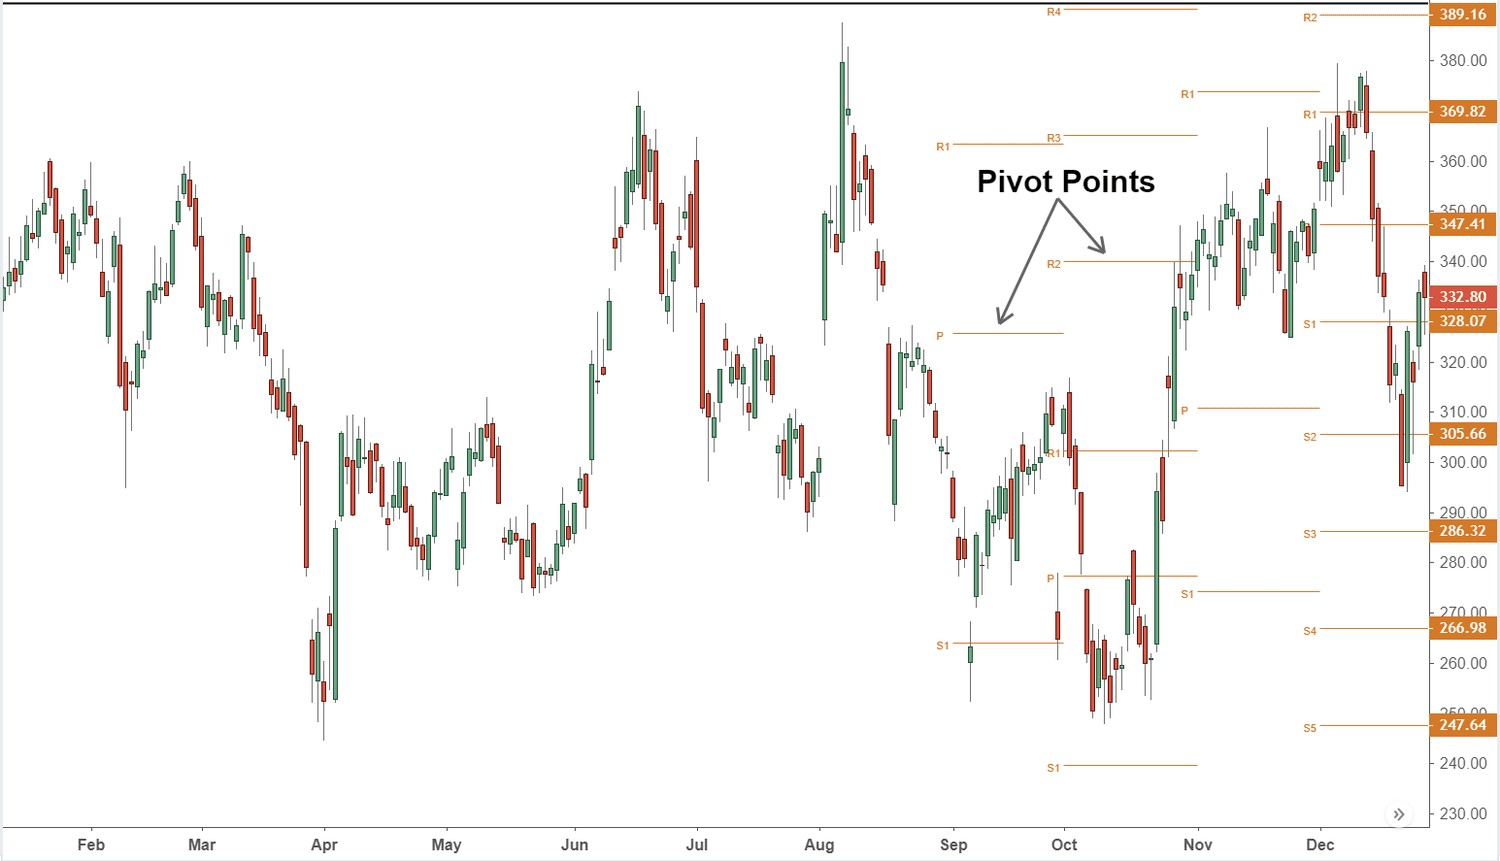
- Pivot points
Keltner Channel Chart
Moving Average Convergence Divergence(MACD) Chart
Parabolic SAR Chart
Average True Range(ATR) Chart
Pivot Points Chart
Exponential Moving Average Chart
The examination of trading charts can be aided by the use of a range of sketching tools by traders. These tools include Fibonacci retracement and extension tools, regression lines, Gann lines, trendlines, and trendlines that can be used to identify significant levels of support and resistance.
Finding likely support and resistance levels is possible using all of these tools. In order to have a better understanding of the market before making trading decisions, traders can also take notes on price activity, use pattern detectors, and use other analytical drawing tools.
Conclusion
Both leading and lagging indicators in trading are very helpful tools for both beginning and seasoned traders. They serve as roadblocks along the trade path. If everyone wants to see future success, they must all honor prior accomplishments. Trading is essentially a means of analyzing data and also grasping measured risks.
Yes, developing and refining a trading approach requires effort and time. Regularly monitoring and evaluating market conditions is essential, as is understanding the underlying factors that can influence stock prices. It is also essential to incorporate both leading and trailing data in order to get a complete picture of market conditions.
In the end, the trader must make decisions based on their analysis. Traders who look for trends using both leading and lagging indicators can execute trades more successfully. But it is important to keep in mind that no single indicator can be depended upon to be 100 percent accurate, which is why it is important to mix a variety of indicators with other types of analysis, such as fundamental and technical analysis.
Hopefully, this post will provide you with some basic information about popular leading indicators and popular lagging indicators in trading.


