
Mean reversion is a well-known trading strategy that is based on the idea that after a brief price spike or sustained price movement, financial markets and asset prices tend to return to their historical averages.
This strategy can be used across several financial instruments, including currencies, stocks, and commodities.
A simple illustration of a mean reversion strategy is to purchase a stock after it experiences a significant price decline.
When a stock has seen a significant decline, there is typically a fair possibility that it will recover and return to its previous level.
Let’s explore the basics of mean reversion trading, its underlying principles, and the ways in which traders can use it to their advantage. Whether you are a newbie or an experienced trader, understanding mean reversion strategies can help you navigate the markets more confidently and possibly increase your returns.
What is Mean Reversion?
Mean reversion is a theory used in finance that suggests that prices and other metrics fluctuate around the long-term mean or average value of the entire data set. In other words, mean reversion assumes that if a price or other metric deviates too much from its historical average, it will probably return to that average over time.
In trading, mean reversion can be used with several market metrics such as volatility, price, and other indicators. For instance, in the case of price, mean reversion traders might search for stocks or other assets that have recently witnessed a sharp price gain or decline as a sign that the stock market may have overreacted to some news or event.
The same concept of mean reversion may be used to describe volatility. Traders may look for occurrences of extremely high or low volatility and use that knowledge to guide their trading decisions. Mean reversion strategies can also make use of other indicators, such as moving averages to recognize overbought or oversold market conditions.
This theory is based on the idea that markets are naturally efficient and price extremes are frequently influenced by short-term factors like market sentiment or breaking news instead of fundamental changes in value.
Mean Reversion: Explained

Mean reverting refers to going back to a condition’s long-run average state. The idea presupposes that a level that deviates significantly from the long-term norm or trend would eventually return, reverting to its recognized state or secular trend.
Many trading strategies have been developed as a result of this hypothesis which involves buying or selling stocks or other securities whose current results have deviated significantly from their historical averages. However, a change in returns can also indicate that a company’s prospects have changed, in which case mean reversion is less likely to happen.
Prices and percentage returns aren’t the only measures taken into account in mean reverting; interest rates or even a company’s P/E ratio may be affected by this phenomenon.
The noteworthy point is that mean reversion focuses mainly on the reversion of very extreme change because normal growth or other variations are predicted as part of the paradigm.
Principles of Mean Reversion Strategy
Mean reversion is founded on several important principles:
- Historical averages: Mean reversion assumes that financial instruments have a long-run average value that acts as an equilibrium point. Several metrics, like price, profits, or dividend yield, can be used to determine this historical average.
- Market efficiency: The notion of mean reversion is closely related to the idea of market efficiency, which asserts that asset prices accurately reflect all information that is currently accessible and that any variations from historical averages are just momentary.
- Reversion speed: Depending on factors such as market liquidity, volatility, and the time frame under consideration, the speed at which an asset price reverts to its mean might change. Some markets can revert to their long-term averages more rapidly, while others may take longer.
Application of the Mean Reversion Theory
Mean reversion can be used as a component of an overall trading strategy as well as in statistical analysis of market conditions. It applies well to the concepts of buying low and selling high, by attempting to recognize unexpected behaviors that will, in theory, return to a regular pattern.
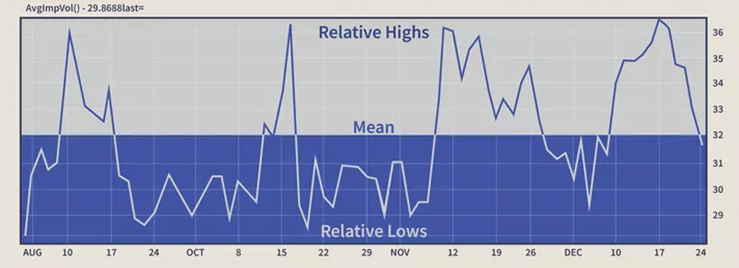
Mean reversion is frequently used in options pricing to reflect the observation that an asset’s volatility will vary around a long-term average. The idea that an asset’s price volatility is mean-reverting is one of the basic tenets of many options pricing models.
The observed volatility of a stock can jump above or below its mean, as shown in the chart below, but it always appears to be limited around its average level. Usually, low-volatility periods come after high-volatility ones, and vice versa. Investors can choose the most profitable trading strategy by combining forecasting methods with mean reversion to find volatility ranges.
Mean reversion trading in stocks aims to profit from dramatic changes in the price of a certain security, expecting that the price will eventually return to its prior state. The concept applies to both buying and selling since it enables a trader to make money on unplanned upswings and to save money on unforeseen lows.
Implementation of a Mean Reversion Trading Strategy
The steps listed below can be used by traders to implement mean reversion strategies:
- Choose appropriate financial instruments: Traders should first choose financial instruments that have a tendency to mean-revert. Statistical analysis tools, like standard deviation and moving averages, can be used to accomplish this using historical price data.
- Calculate the historical mean: Determine the historical mean value for the chosen financial instrument using a specified metric, such as earnings, price, or dividend yield. This mean value will act as the point of reference for the mean reversion trade.
- Keep an eye out for deviations: Track variations from the historical mean and continuously monitor the price of the financial instrument. Significant variations might offer trading opportunities.
- Place trades: Traders can place trades based on the assumption of mean reversion when the price of a financial instrument deviates noticeably from its historical mean. This typically entails purchasing undervalued assets (assets that are priced below the mean) and selling overvalued assets (assets that are valued above the mean).
- Control risk: Like any other trading strategy, it’s essential to manage risk while executing a mean reversion strategy. This can be accomplished by establishing stop-loss orders, controlling position sizing, and following a predetermined risk management strategy.
Mean Reversion Trading Strategies
There are many strategies that can be used to trade mean reversions. Here are some of the most common ones:
Moving Average Mean Reversion Trading Strategy
Using this tactic, traders watch for price deviations from the moving average, which may indicate possible buy or sell opportunities. When the price of an asset is trading below its moving average, it is said to be undervalued, and traders may think about purchasing the asset because it is expected to return to its mean. Similarly, when an asset’s price trades above its moving average, it is thought to be overvalued, and traders may think about selling the asset because it is probably going to return to its mean.
The simple moving average (SMA), which determines the average price of an asset over a certain time frame (such as 50 days, 200 days, etc.) by adding up the prices and dividing by the number of periods, is the most common moving average employed in the moving average mean reversion approach.
Traders are expected to notice that the price tends to oscillate around this line once it has been applied to a chart.
It would be necessary to determine how far the price has historically risen or dropped before reverting to the mean in order to construct a trading system based on an SMA. The next step is to attempt to enter a position when the price moves by that many points again and to exit when the mean is reached.
Some traders may employ other types of moving averages, like the exponential moving average (EMA), which gives a higher significance to recent price data and may react more swiftly to price movements. There are other additional moving averages available to traders. The kind of moving average to choose will ultimately rely on a trader’s preferences and trading style.
Pairs Mean Reversion Trading Strategy
Pairs trading mean reversion strategy involves identifying two related instruments which have historically moved together, such as two equities in the same sector or two currencies in the same area. Traders then determine the historical correlation between the two instruments, for instance, by figuring out the price spread between their stock prices. The spread depicts the price difference between the two instruments and can be determined when one instrument’s price is subtracted from another.
Traders could think about entering a trade when the spread deviates from its historical mean or average. For instance, if the spread extends outside its historical range, traders can think about purchasing the asset that is relatively undervalued to the other and selling the instrument that is comparatively overvalued, with the hope that the spread will eventually revert to its mean. On the other hand, if the spread narrows past its historical range, traders can think about selling the comparatively undervalued instrument and buying the relatively overvalued instrument, with the hope that the spread will eventually expand again to its mean.
The trader would close their position as soon as the price deviation has neutralized.
Pairs trade is also a common arbitrage strategy. It serves as fertile ground for mean reversion trades because you may bet on the spread between two comparable items rather than trying to capitalize on outright movement, which can be riskier.
When a correlation between two markets suddenly vanishes (for example, between Apple and Microsoft or gold and silver), it may be a good time to place a bet that the correlation will reappear.
Volatility Mean Reversion Trading Strategy
This strategy performs the function of identifying periods of high or low volatility using a volatility indicator such as the VIX (CBOE Volatility Index). The VIX index, which calculates the implied volatility of options on the S&P 500 index, is frequently used as a measure of stock market anxiety or unpredictability.
When the VIX is trading above its long-run average or mean, investors may think about shorting the underlying asset or selling options in the hope that volatility will eventually return to its mean. On the other hand, when the VIX is trading below its long-run average, investors may think about going long on the underlying asset or purchasing options in the hope that volatility will eventually rise to its mean.
In order to identify possible mean reversion opportunities, traders may also employ additional volatility indicators, such as historical volatility or implied volatility of specific stocks or other financial instruments.
Sentiment Indicators Mean Reversion Strategy
Some investors will look at sentiment indicators like investor confidence because the market is a reflection of the public. These mean reversion indicators frequently identify promising turning points.
For instance, if 70% of investors are pessimistic, that might indicate a upcoming bull market.
Investor polls in the past have revealed that investors tend to become more pessimistic close to market lows and more optimistic close to market peaks.
The AAII Investor Sentiment Index is represented in the chart below, and it clearly exhibits mean reversion characteristics. The S&P 500 Index (blue) is shown as a comparison point:
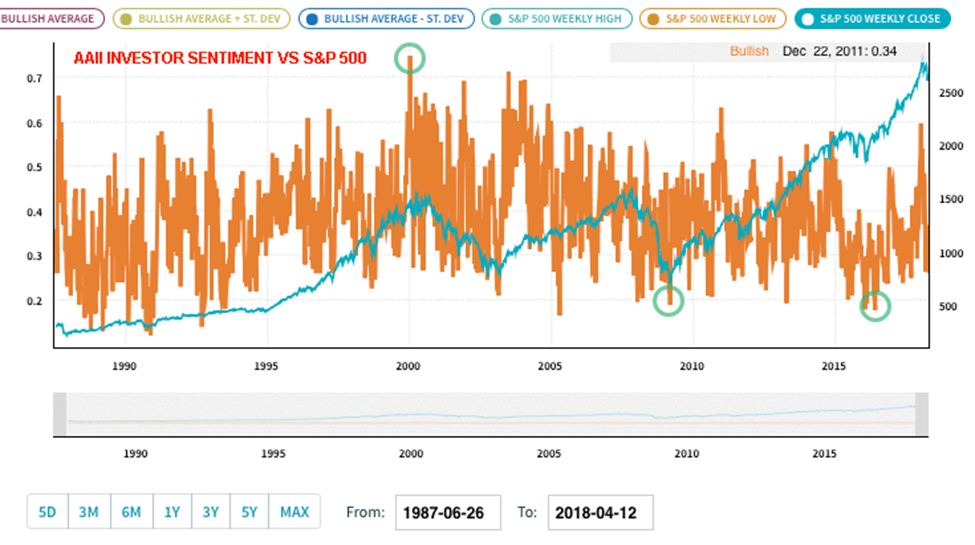
There are investor sentiment peaks close to market highs, like in January 2000. Additionally, troughs are there close to market bottoms, such as in March 2009 and May 2016.
Mean Reversion Trading System Using Technical Indicators
Most mean reversion strategies are also built using indicators. Here are a few examples:
-
Bollinger Bands
Bollinger bands are one of the useful technical analysis tools around which mean reversion works. They employ standard deviations to determine how far the current price is from the average.
A trader can predict that the price will most likely return to its mean the further the standard deviations are from it.
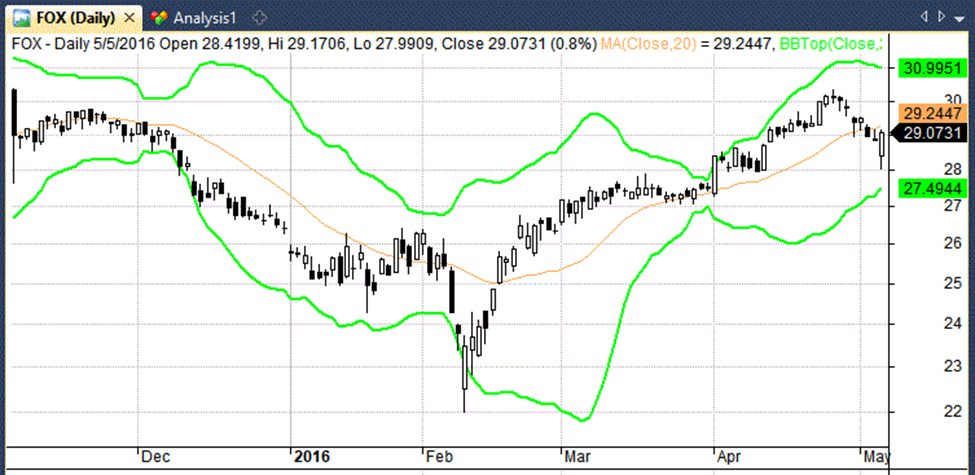
In the above example, FOX closed below the lower Bollinger Band. A stock is more likely to reverse the further it trades from its moving average.
-
Relative Strength Index (RSI)
RSI is a momentum oscillator that assesses the size of recent gains and losses to determine whether an asset is overbought or oversold. The RSI indicator is regarded as overbought or oversold when it reaches a price level such as 70 or 30. These can serve as good entry and exit points for mean reversion trades.
-
MACD
MACD (Moving Average Convergence Divergence) is a trend-following momentum indicator and is an extension of a moving average indicator. It is usually considered the opposite to mean reversion indicator, but knowing which direction the stock market will head next is an important part of mean reversion strategies.
Traders need to be able to predict when the market will return to the mean because it might occasionally take a while for a breakout to correct itself.
The MACD is composed of a zero line, a slow exponential moving average (EMA), and a fast EMA, which simply implies that the most recent values are given more weight than in an SMA. Waiting for the fast EMA to cross over the slow EMA to take a long position or the fast EMA to cross under the slow EMA to open a short position is one of the most popular techniques to trade using the MACD.
It’s important to remember that no indicator is error-free, and traders should employ a variety of indicators to validate their analysis and make wise trading choices.
Limitations of Mean Reversion
Mean reversion trading helps many traders to make crucial buy and sell decisions. It helps companies profit even if their present performance is below par. However, the strategy might not work well in every market or with every trader.
The strategy encourages investors to hold or purchase a cheap stock expecting that it’ll rise in value in the future. But it’s important to keep in mind that a variety of factors, including legal, environmental, and political ones, determine how well a corporation performs. These elements influence the company’s finances and image.
Imagine that a financial problem, such as increased debt, causes the share prices to decline. Rarely will a bankrupt corporation be able to sell off its assets and pay back its equity stockholders.
Consider the example of Enron Corporation. Its shares peaked at $90 in August 2000 and fell to $0.60 at the conclusion of the 2001 fiscal year. The company ultimately ceased operating in 2007 due to bankruptcy. Or use Nokia as an example. It traded at about $62 during the height of its success. Its share price is currently $4.4 after twenty years.
There are plenty of such stories in history. But a long-term investor will consider a variety of factors, draw lessons from mistakes, research history, and make prudent investments. Additionally, not all of the stories available are discouraging. Some also function well.
The efficiency of the approach in various market conditions must be determined by backtesting and studies, and diversification is crucial to controlling risk exposure.
Conclusion
In summary, traders trying to profit on the propensity of prices and other metrics to revert to their mean over time may find mean reversion strategies a powerful tool. They offer stock traders the opportunity to purchase at a lower price and sell at a greater price. Mean reversion traders might enter positions in the hope that metrics will eventually return to the mean by identifying instances where they have deviated noticeably from their historical averages.
Mean reversion trading strategies can, in general, be a valuable tool for a trader’s arsenal. While the idea of mean reversion isn’t new, there are still numerous ways to apply it, from straightforward moving averages to more intricate indicators like Bollinger Bands, MACD, and RSI. It’s crucial to keep in mind that no approach is guaranteed and that past success does not ensure future achievement. Therefore, they should be utilized in conjunction with other trading methods with a clear grasp of the risks involved. Traders can improve their chances of success with mean reversion trade by managing risk effectively and performing trades with discipline and patience.