


The Bollinger Bands indicator was created by John Bollinger. Bollinger Bands help traders understand if a market is oversold or overbought, as well as identify current and potential market volatility, which allows the trader to make appropriate trades. Let’s understand what it all means and how to use it in your trading.
Understanding Bollinger Bands
The Bollinger Bands, one of the most widely used technical indicators in technical analysis, has three components – a moving average, an upper band, and a lower band.
The moving average, representing the average price of a security over a pre-determined number of time periods, serves as the base for the calculation of the upper and lower bands.
The upper band is two standard deviations above the moving average, and the lower band is two standard deviations below the moving average. They define the Bollinger Bandwidth, as a crucial metric for evaluating market volatility. Traders use The Upper and Lower bands also as support and resistance levels.
Bollinger Bands’ Formula
Bollinger bands indicator calculation helps determine market volatility and trading range for a given period.
Each band is calculated by the following formulas:
Upper band = Simple moving average + 2 x standard deviation,
Lower Band = Simple moving average – 2 x standard deviation.
The following is the standard deviation formula:
Standard deviation = √ (measurement period × sum of squared prices – square of the sum of prices) ÷ measurement period × (measurement period – 1)
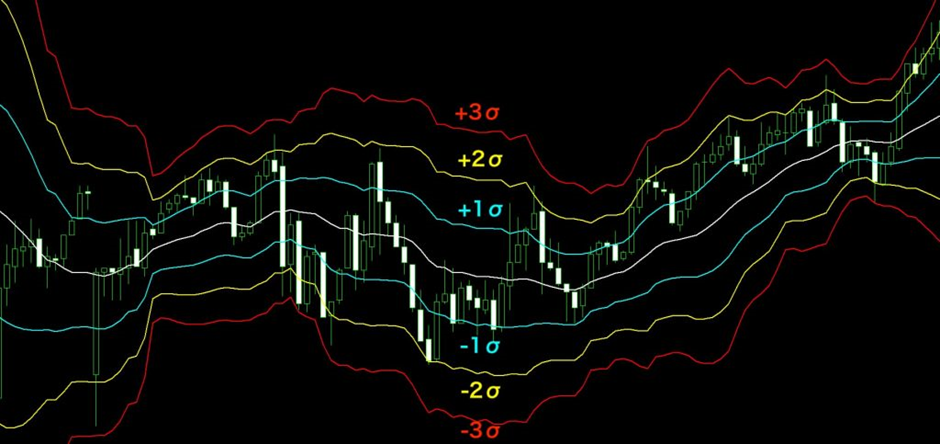
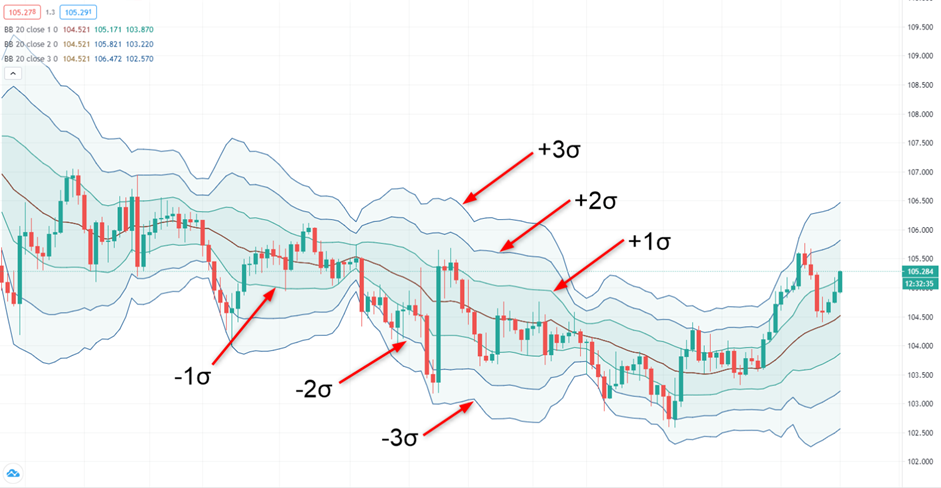
The formula is quite complicated, but in a nutshell, it shows how far the closing prices of the bar are scattered from the average value. The symbol for standard deviation is called σ (sigma).
More closing prices away from the center line have a larger standard deviation, while more closing prices closer to the center line have a smaller standard deviation.
Calculation of Bollinger Bands
The calculation of Bollinger Bands involves the following steps:
- Determine the simple moving average of security price for a given period (SMA): The simple moving average is the average of a set of data points over a specified period of time. For example, a 20-day SMA would be the average of the closing prices over the last 20 days.
- Determine the standard deviation of security price for a given period: The standard deviation is a measure of the amount of variation or dispersion of a set of values. For Bollinger Bands, the standard deviation is calculated using the prices of the underlying security.
- Calculate the upper band: The upper band is calculated by adding two standard deviations to the simple moving average.
- Calculate the lower band: The lower band is calculated by subtracting two standard deviations from the simple moving average.
Bollinger Bands, a well-renowned technical analysis tool, incorporates standard deviation in its calculation to give a comprehensive understanding of market volatility. The use of standard deviation adds an extra dimension to the indicator, enabling traders to gauge the extent of price fluctuation in security.
A higher standard deviation reflects elevated volatility, whereas a lower standard deviation portrays limited price movement. Thus, the incorporation of standard deviation in Bollinger Bands calculation offers valuable insight into market trends, empowering traders to make informed decisions.
PRO tip: Bollinger Bands will generate stronger signals if the SMA is calculated over a longer period. So, a 100 SMA signal will be stronger than a 20 SMA signal. However, the longer the SMA period, the less often the signals will be generated. The choice between the number of trading signals and their “quality” is in your hands.
Interpreting Bollinger Bands
Bollinger Bands are an effective tool to measure market volatility and help traders make informed trading decisions. In this section, we will explore how Bollinger Bands show market volatility and understand the distance between the bands and price action.
How Bollinger Bands Show Market Volatility
The Bollinger Band indicator helps traders and investors gauge the level of volatility in the market. The Bollinger Bandwidth, which is the difference between the upper and lower Bollinger Bands, is the key to understanding this versatile tool.
During volatile market conditions, the distance between the Bollinger Bands widens, reflecting a high level of volatility. Conversely, during stable market conditions, the distance between the bands narrows, indicating lower volatility. With the ability to measure market volatility, the Bollinger Band indicator is a valuable tool in any trader or investor’s arsenal.
The Bollinger Lines provide a visual representation of the market’s volatility and are an important aspect of the Bollinger Band indicator.
Understanding the Distance Between the Bands and Price Action
The interpretation of the interplay between the Bollinger Bands and price action can be an insightful technique for traders and investors to predict potential price movements.
Utilizing the Bollinger indicator to observe price action near the upper band suggests a potential overbought market, while price action consistently near the lower band may indicate an oversold market, indicating the possibility of a price correction or rebound. Thus, the Bollinger Bands, in conjunction with price action analysis, can be a valuable tool for informed trading decisions.
Using Bollinger Bands as Support and Resistance Levels
In addition to measuring market volatility, Bollinger Bands can also be used as support and resistance levels. The upper band acts as resistance, while the lower band acts as support. When the price approaches the upper band, it may struggle to break through and may eventually reverse direction. Similarly, when the price approaches the lower band, it may struggle to go lower and may also reverse direction.
Bollinger Bands in Trading Strategies
Bollinger Bands are commonly used in trading to measure market volatility and identify potential trend reversals. They can also be employed in various strategies such as trend following, breakout trading, and mean reversion.
Trend Following
This strategy involves using Bollinger Bands to identify a trending market and capitalize on the trend by taking trades in the direction of the trend. When the security price is above the Upper band it indicates an uptrend market and trend followers can go long or buy. When a security price is below of Lower band, it indicates a downtrend market condition, and trend followers can go short or sell. Buy/sell trading signals are generated when the price crosses above/below the Upper/Lower bands respectively.
Breakout Trading
This strategy involves looking for price breakouts above or below the Bollinger Bands to identify potential trading opportunities. In this strategy, Upper and Lower bands act as support and resistance levels. The breakout strategy is similar to the trend following but takes into account market volatility for the previous period. The security price should be in a narrow channel before the breakout and the volatility should be increased during the breakout process.
Mean Reversion
This strategy involves using Bollinger Bands to identify overbought and oversold conditions in the market and taking trades in the opposite direction of the market when conditions become extreme. When an asset price touches the Upper band, then it is a sell signal for mean reversion traders and when the price touches the Lower band, it is a buy signal.
How to use Bollinger Bands in conjunction with other technical indicators
The combination of Bollinger Bands with other technical indicators can offer a more robust trading strategy, heightening the precision of trades. Take, for instance, the utilization of Bollinger Bands and the Relative Strength Index (RSI), a potent duo that can distinctly pinpoint instances of overbought and oversold markets.
Considerations when trading with Bollinger Bands
Bollinger Bands are a commonly used tool among traders, but it’s imperative to bear in mind that these bands serve as a lagging indicator, presenting signals only after the market has already shifted direction.
Thus, incorporating Bollinger Bands as a standalone approach in trading decisions can prove to be a mistake, instead, it’s crucial to include it as a part of a holistic trading strategy that blends different types of technical indicators.
Advanced Bollinger Bands Techniques
Advanced Bollinger Bands Techniques are methods that use the Bollinger Bands indicator in a more sophisticated manner to make more informed trading decisions. The two common advanced techniques are Bollinger Bands squeeze and Bollinger Bands walk. These techniques analyze market volatility and price action to identify potential trends and trade opportunities.
Bollinger Bands Squeeze
● The Bollinger Bands squeeze is a technique used to identify potential breakouts in the market by analyzing market volatility
● When the distance between the two bands narrows, it signals a period of low volatility and a possible breakout
Bollinger Bands Walk
● The Bollinger Bands walk is a technique that uses the concept of price walking up or down the Bollinger Bands to determine trend strength
● This technique involves observing the price action relative to the Bollinger Bands and looking for sustained moves outside of the bands that indicate a strong trend
Bollinger Bands Divergence
● Bollinger Bands divergence is a technique that uses Bollinger Bands and other technical indicators to identify potential trend reversals
● This technique involves looking for divergences between the price action and the Bollinger Bands, as well as other indicators, to identify possible reversal points in the market.
Bollinger Bands Tips and Rules
Whatever strategy you use, you should always follow certain basic rules when interacting with Bollinger Bands. They were brought out by the author of the indicator, John Bollinger, and listed in his book. Of these, we chose the most relevant and conveyed their essence in simpler language:
● It is recommended to use Bollinger Bands in conjunction with other technical analysis tools.
● Together with Bollinger Bands, you can use a variety of indicators that determine momentum, market sentiment, activity, inter-market data, etc. In this case, the indicators used should not be related to each other. For example, trends and volatility are used in the design of the tapes. Their use for additional confirmation of price behavior is meaningless.
● Most instruments, timeframes, and trading methods can be traded using the default indicator parameters. But this does not mean that other settings cannot be used. It is important that the moving average always describes the medium-term trend well. If it lengthens or shortens, then the number of standard deviations should be increased or decreased. For example, for fifty periods it is better to use a coefficient of 2.1, and for 10 – 1.9.
● Bollinger Bands are well suited to confirm chart patterns such as triangles, double and triple tops and bottoms, head and shoulders, and other W-bottoms and M-tops.
● With a directional price movement, it can often move along the upper line and, in the case of a bearish trend, along the lower line.
● Closing bars outside the bands statistically more often indicate the continuation of the trend, rather than its end.
● Touching the tape is not in itself a buy or sell signal. Therefore, it should be considered only in combination with the readings of other indicators.
● The moving average in Bollinger Bands is not a substitute for strategies involving SMA, EMA, and other types of averages.
● The Bollinger Bands %b indicator will help you unambiguously determine the position of the price relative to the Bollinger Bands.
● Bollinger Bands should be used in conjunction with the BandWidth indicator. It helps identify the “calm before the storm” and signs of a trend change.
● Bollinger Bands work on any timeframe and any market. An important requirement for the correct use of the indicator is sufficient price activity and calibration of the parameter settings based on the history of its movement.
● Bollinger Bands do not provide unambiguous recommendations on their own. This indicator should increase your chances of avoiding bad trades.
Remember these rules and always stick to them if your trading method uses Bollinger Bands in one way or another.
Conclusion
Bollinger Bands, a sophisticated and useful technical indicator, enable traders to gain profound insight into the flow of market volatility. By combining technical analysis’ different indicators with Bollinger Bands, traders can make better decisions and maximize their profits. As the future of technical analysis looks promising, Bollinger Bands persist in their popularity, steadily maintaining their status as a widely utilized and highly valued indicator.


