


Analysts and traders continuously study patterns and trends when exploring the market in the hope of finding the next most possible price movement. Correctly identifying and spotting and understanding their importance is crucial to profitable trading.
The head and shoulders chart pattern is significant due to its well-established record of reliability among traders and market analysts. The inverse head and shoulders pattern is equally reliable and useful for the arsenal of any trader and adopts the same perspective as the traditional formation.
In this article, we will discuss this pattern closely and how to trade it to gain profit.
The Basics of a Head and Shoulders Chart Pattern
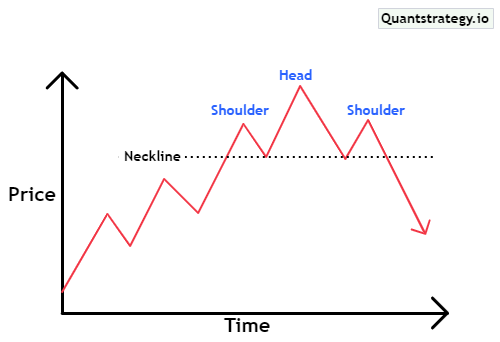
Head and shoulders patterns are particular chart formations used in technical analysis that predict bullish-to-bearish trend reversals. The patterns appear as a baseline with three peaks and troughs between them.
The two outside peaks on either side are ‘shoulders’, while the center peak is the ‘head’, which is the highest out of the three. The three peaks appear as a ‘left shoulder’, ‘head’, and a ‘right shoulder’.
The head peak must be higher than any of the shoulder peaks, however, the shoulder peaks don’t necessarily have to be at the same price level. A trend line that connects the lows of the troughs among the peaks forms a ‘neckline’.
A head and shoulders pattern occurs at the end of a lengthened uptrend and generally signals a reversal. The reason for its formation is a tug of war between bullish investors, who sell at every peak. The bullish sentiment declines, and the price breaks below the neckline after the right shoulder.
Key Components of the Head and Shoulders Pattern
The three mandatory components of a head and shoulders pattern are:
- Head: It is the highest peak of the pattern formation. The head has to be at a higher level relative to the two peaks on either side.
- Shoulders: Two peaks situated on both sides of the head (center peak) are the left and right shoulders. Preferably, they must be symmetrical, meaning they should be near or at the price level. Since they are quite difficult to spot, asymmetrical shoulders are well accepted as well, provided the distance between the two peaks isn’t big.
- Neckline: It is the trend line, which connects the bottoms/troughs of the two shoulders. It is arguably the most significant component of the pattern because its break activates the whole pattern.
Understanding the Head and Shoulders Chart Pattern
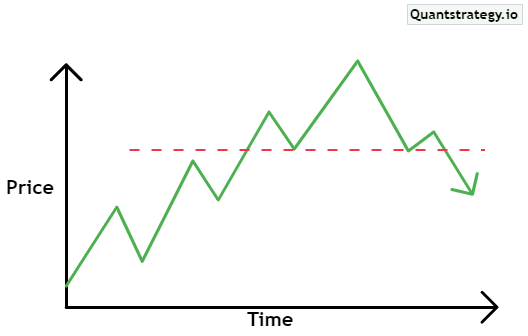
The above chart pattern is a clear picture of the three components of the head and shoulders pattern – two shoulders and a head, which the price crosses through in forming the pattern, indicating a market reversal. Let’s understand each point of the head and shoulders formation in greater detail.
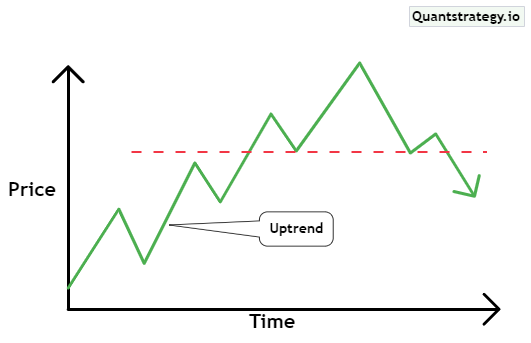
- Uptrend & left shoulder – Head and shoulders patterns should occur at the end of a lengthened uptrend. The peak of this uptrend is the left shoulder that forms before a pullback.
- First trough – The pullback after the left shoulder creates the first trough of this pattern. The low of this trough stays above the trend line of the previous trend, however, this isn’t always the situation.
- Head – Along the course of the first pullback, the upward trend forms a higher peak, which is the head of this pattern.
- Second trough – Following the head, there is another pullback that creates the second trough of the head and shoulders pattern. This trough can break below the trend line of the overall uptrend, which includes the bullish price action that created the head.
- Right shoulder – The right shoulder is formed by another bullish movement. It can be symmetrical in terms of height and width to the left shoulder, however, this isn’t always the situation.
- Neckline – A trend line connecting the lows of the two troughs makes the neckline of the head and shoulders patterns. The neckline can be horizontal or slightly angled up or down, where a down-angled neckline indicates a powerful impending reversal.
- Breakdown – The waning from the right shoulder must break the neckline, which initiates a breakdown. When below the neckline, a breakdown should be backed by an above-average trading volume. Moreover, the magnitude of the likely breakdown is equivalent to the distance between the neckline and the head (which is directly below the head).
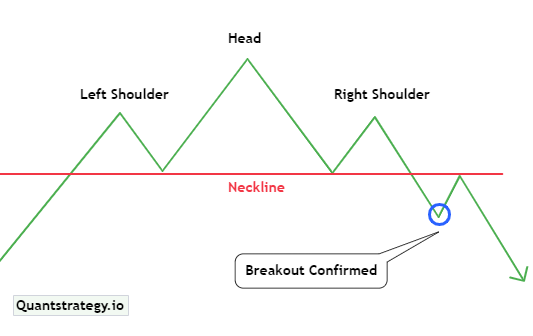
An important thing to remember about this pattern is that it is only confirmed on the break of the neckline. A common misconception among Forex traders is that they assume the pattern is complete when the right shoulder forms. However, it only forms completely and becomes tradeable when the market closes below the neckline support.
The chart above shows that the market closed below the neckline and confirms the pattern, indicating a breakout.
Inverse Head and Shoulders
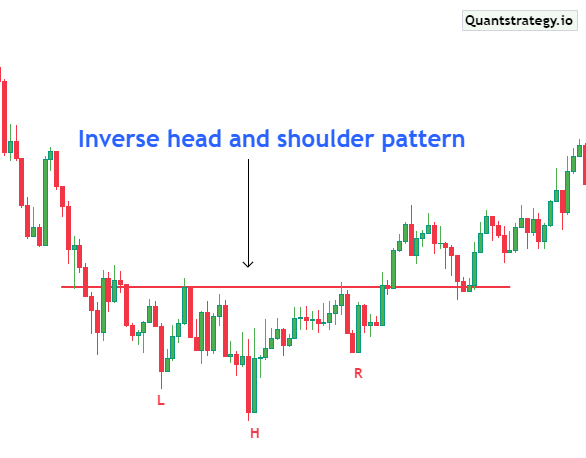
Also called head and shoulders bottom, the inverse head and shoulders is the opposite of the traditional version. It is seen in a downtrend and signals the reversal of a downtrend as higher lows are formed.
The pattern is observable when the price action meets the following traits:
- The price declines to a trough/bottom and then rises.
- Next, the price declines below the prior trough and then rises again.
- After that, the price falls again, yet not as much as the second trough.
- As the final trough forms, the price moves upward towards the neckline, which is found near the peak of the earlier troughs.
The inverse pattern is also a decent indicator, depicting that a downward trend is ready to reverse into an uptrend.
Of these, the right and left shoulder are slightly shallower, and the second trough (the head) is the lowest.
The final rally following the third dip indicates the reversal of the bearish trend and signals that the prices are probable to keep rallying upward.
Trading the Head and Shoulders Patterns
Traders can opt for short positions around a breakdown for trading head and shoulders patterns. Here is how you can trade them.
- Identify the Pattern’s Formation
This is one of the trickiest parts of trading this pattern. The shoulders can be asymmetrical, which makes it tougher to spot them.
Traders should keep two things in mind while looking for this pattern. First, it requires an existing uptrend, as there can be no head and shoulders pattern without a powerful uptrend.
Second, traders should monitor trading volume as ideally the volume will be highest when the left shoulder occurs and lowest when the right shoulder occurs.
Moreover, the volume must rise as the left shoulder falls to the first bottom and the head falls to the second bottom.
- Wait for a Breakdown
The breakdown takes place once the neckline is broken at the end of the head and shoulders pattern. This breakdown must be convincing, taking place in a strong volume and corresponding with momentum indicators directed towards powerful bearish momentum.
- Enter the Trade
Traders may enter a trade once the breakdown is confirmed. Most traders would short the price target to gain from the breakdown as head and shoulders patterns predict a bearish move.
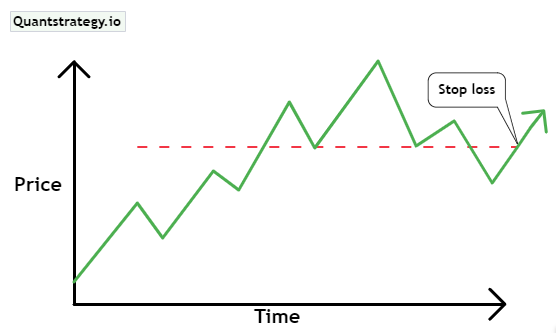
Traders must consider placing a stop loss above the neckline. Moreover, they should remember that the neckline serves as a support for the declining price, so the price can deflect the neckline or retest it after the breakdown commences.
Tips for Trading Head and Shoulders Chart Patterns
Some important points to consider while trading a head and shoulder pattern are:
Needs a Strong Uptrend
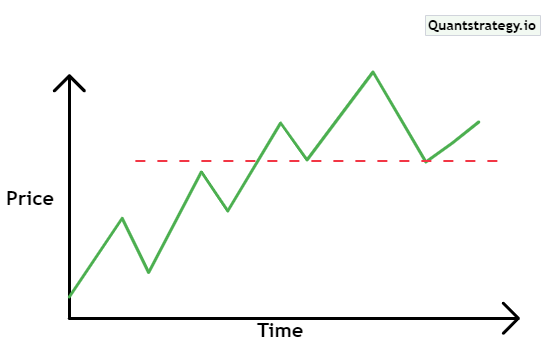
A head and shoulders pattern only forms after a powerful uptrend. While sideways trading movements can look like this pattern in the absence of an earlier uptrend, they will not indicate a bearish reversal in such a case.
Asymmetrical or Tilted Patterns
Head and shoulders patterns are not always well defined because the head, shoulders, and troughs can be asymmetrical or tilted.
In such situations, note that a downward-sloping neckline signals a probable reversal compared to an upward-sloping neckline. Additionally, monitor the momentum indicators and volume as they can provide further proof that a bearish reversal is near.
Convincing Breakdown
Since the neckline of the pattern serves as support, a breakdown below this trend line is convincing. The breakdown must take place on a higher-than-average volume and correspond with momentum indicators directed towards rising bearish momentum.
Always Use Stop Losses
The breakdown may likely fail following head and shoulders patterns, and a stock price can rise back above the resistance (neckline). Traders should keep stop loss handy to prevent such situations. Position a stop a little above the neckline, giving enough space for the price to retest the neckline after the breakdown.
Conclusion
Ultimately, it’s crucial to abide by trades, which respect your risk tolerance and advance your trading objectives. In a notoriously unpredictable market, the head and shoulders pattern has historically been found to be pretty trustworthy.
Moreover, it is one of the most recognizable chart patterns. No chart pattern is 100% accurate at predicting the future, but when the head and shoulders pattern accurately predicts a significant shift in trend, it gives a sizable possibility for profit.


