

Traders deploy charts to study various kinds of patterns in market trends, including the inverse head and shoulders. The pattern, also called head and shoulders bottom, is a candlestick formation that comes about at the end of a downward trend and signals that the prior trend is ready to reverse.
The inverse head and shoulders pattern resembles the standard head and shoulders pattern but is inverted. It is characterized by three bottoms (troughs), where the shoulders and head have peaked. The middle trough is the lowest among all three.
Often related to bullish price reversals, this trend reversal pattern is one of the most effective and accurate patterns in technical analysis.
But how can you identify and trade it? And what are the ways to maximize profitability when using inverse head and shoulders in trading? Let’s learn all the answers to these questions in this article.
Inverse Head and Shoulders Explained
The inverse head and shoulders is a widely used and recognized technical analysis indicator that predicts price trends in a financial market. It is believed to be originated from traders and chartists who employed it to identify possible reversals in downtrends and ascertain entry and exit points of the market. Therefore, it’s a powerful tool for any investor or trader’s arsenal to make investment decisions.
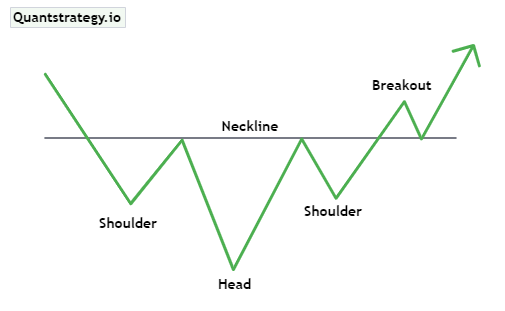
The inverse head and shoulders pattern appears in all time frames and all markets. It has three troughs and peaks. As shown in the figure below, the first and third bottoms are smaller and form two shoulders, whereas the second trough is the deepest and forms the head.
The picture above demonstrates five characteristics of the inverse head and shoulders chart pattern. These in order of occurrence are downtrend, first shoulder, neckline, head, and second shoulder.
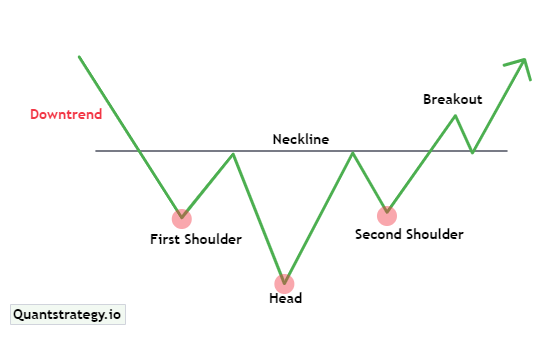
The pattern starts with a downtrend, which is an extended move down that eventually results in exhaustion and a higher reversal as sellers leave and buyer speed up.
This downtrend then meets minor support that creates the first shoulder. As the market initiates to rise, it deflects strong resistance, and the downtrend resumes.
A resistance level forms, which is also called the neckline. It is seen on the charts when downward-sloping trend lines connect the first trough with the second and is an important component of the pattern.
After the market creates a lower low, it discovers a powerful support and forms the head of the chart pattern. The market comes across resistance once more at the neckline and forms the second shoulder. This is the point where the inverse head and shoulders take shape, but the pattern is not confirmed yet.
The Breakout
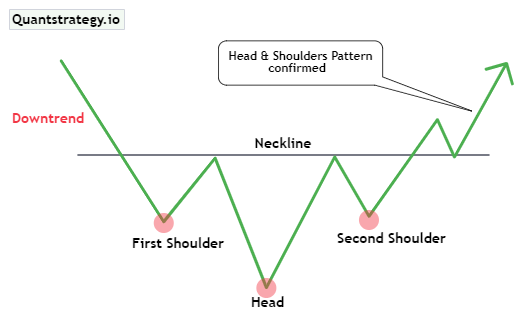
A common misconception among a lot of traders is that they think the pattern is complete once the second shoulder forms.
While the pattern starts taking shape at this point, it is not confirmed till the market closes above the neckline. This means that the final confirmation of the pattern’s completion is dependent on the chosen time frame for analysis and the specific market being analyzed.
The chart below indicates the point at which the inverse head and shoulders are confirmed and also indicates a breakout opportunity. This shows if the pattern forms on a 4-hour chart, it is preferred to wait for a 4-hour close above the resistance level for it to convert into a tradable pattern.
How to Identify Inverse Head and Shoulders Chart Pattern?
Now that you know the characteristics of the inverse head and shoulders pattern, the following steps can help you identify the pattern easily:
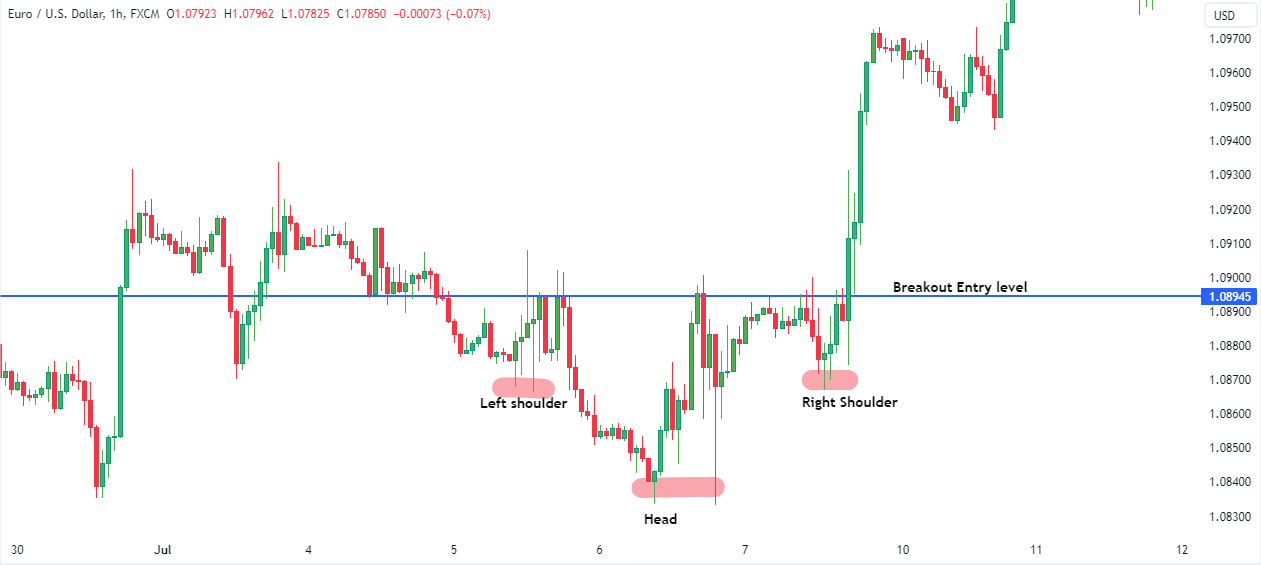
- After a downtrend line, identify three bottom levels – the left shoulder, the head, and the right shoulder.
- Determine the neckline – resistance level.
- Set a buying order once a candle closes above the neckline and watch for the breakout to occur.
- Use a risk-reward ratio and place a stop-loss order below the neckline, preferably at the lowest point of the right shoulder.
Trading the Inverse Head and Shoulders Pattern
Since the inverse head and shoulders pattern is a bullish pattern, it is a must to find the perfect entry point for a long position.
Just like other candlestick chart patterns, an inverse head and shoulders pattern can be traded in various ways and with several techniques.
We will discuss two trading strategies for this pattern below:
- Trade the Breakout
Entering a position immediately when the price breaks above the neckline is the most common way of trading the inverse head and shoulders.
In this scenario, once the pattern is identified with the right shoulder and a clear neckline, the trader can enter a position when the breakout occurs.
Let us consider an example of an inverse head and shoulders breakout.
The AUD/JPY price chart above illustrates that when the breakout occurs the price increase, and there is no retest around the resistance line.
The risk with this approach is that there’s a high chance of experiencing a false breakout ( or a price pullback), and the stop loss will get triggered.
To prevent this, it is advisable to place a stop loss at the lowest level of the right shoulder when a trader enters a position at the breakout.
- Waiting for a Close above the Neckline
The second way is to wait for a close above the neckline. The strategy makes sure that the remaining market is fervent with the breakout, meaning the likelihood of experiencing a false break is lessened.
The traders have two options as to where and how they will enter the market when using this trading strategy. The illustration below demonstrates both entry strategies.
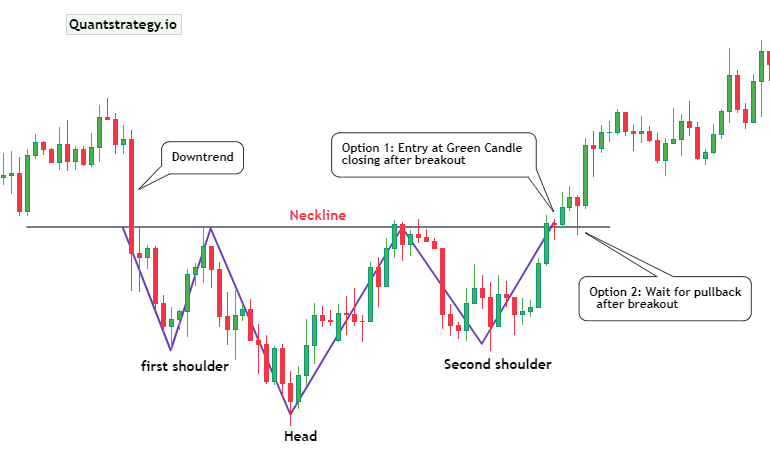
The first option above shows what will be a buy order immediately once the 2-hour candle closes.
As discussed above the 2 hours here is the time frame respecting the key level. In this case, it is the 2-hour chart.
The second and preferred entry strategy demonstrates a pending buy order as new support on a retest of the broken neckline. As per Trading 101, the old resistance turns into a new support level and vice versa, and this is what occurred in the above USDJPY chart.
Difference between Inverse Head and Shoulders Pattern & Head and Shoulders Pattern
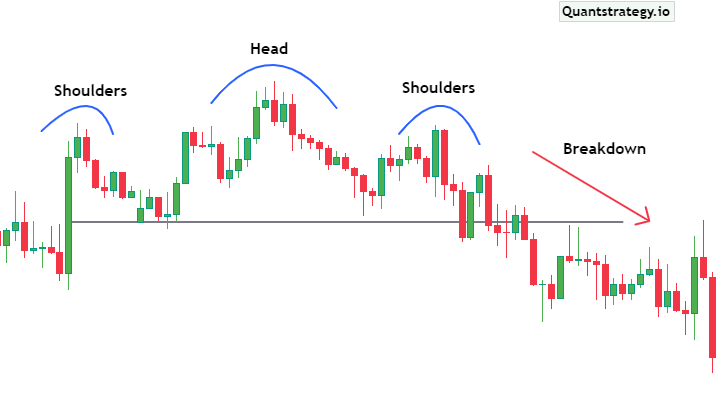
The head and shoulders pattern is the complete opposite of the inverse head and shoulders. It is used to foresee reversals in upward trends.
This chart pattern is recognized when the price action of an asset or security meets the following traits:
- The price rises to a peak and then drops.
- The price moves higher than the previous peak and then declines again.
- Lastly, the price increases again, however, not as much as the second peak.
- After the final peak forms, the price drops down towards the resistance, present near the bottom of the prior peak.
Below is a picture of a head and shoulders pattern.
Pros and Cons of the Inverted Head and Shoulders Pattern
Some of the commonly occurring pros and cons of trading the inverted head and shoulders pattern are:
Pros
- It is a reliable and accurate chart pattern for predicting a trend reversal.
- The take profit levels and stop loss are clearly defined.
- It works well with other technical indicators, such as Fibonacci levels.
Cons
- It can sometimes be complicated for novice traders to identify patterns.
- It occurs in an overall downward trend, which means that there is a greater likelihood for the downtrend to continue. If traders act on a false buy indicator, they’ll experience a continuous downtrend with very less chance for capital recovery.
Conclusion
The inverse head and shoulders pattern is one of the most popular charts in technical analysis. It is preferred by many traders due to its firm and strong signals.
It is a confirmed trend reversal pattern that completes when the price asset rallies through the point where the right shoulder breaks the neck line. Traders must wait for the pattern confirmation i.e. the breakout above the resistance, before carrying out a trade.
Moreover, it is also advisable to get it further confirmed from other technical indicators.


