

Price action trading is founded on the principle that the map is not the territory.
While technical indicators can be helpful maps—imposing structure on chaotic markets—they can also oversimplify or obscure the raw reality they represent: the price movement itself.
This approach involves stripping away the noise of complex indicators to focus directly on an asset’s raw price history and chart patterns. By analyzing the “territory” of the market itself, traders aim to make clearer, more intuitive decisions.
In this guide, we will explore the core concepts of price action trading and detail powerful strategies to help you apply them for more consistent profitability.
What is Price Action?
Price action is the movement of the price of security plotted across time. It forms the foundation of all the technical analysis of a commodity, stock, or another asset chart. Many retail traders, hedge fund managers, and institutional traders exclusively rely on price action and the trends extrapolated from it to predict the future price direction of a financial market or asset.
On the other hand, technical analysis, as a method, is a derivative of price action as it deploys previous prices in computation, which can then be used to guide trading decisions.
Simply put, price action is how a price change, that is, the ‘movement’ of price. It is mostly observed in a market with high volatility or liquidity, however, anything sold or bought in a free market can generate a price action.
Price action trade ignores the primary factors that affect the movement of the particular market and rather primarily observes the historical price of the market, which is its price action, to identify any clues regarding where the market might move next.
Hence price action’s a form of technical analysis, yet what separates it from most types of technical analysis is that it mainly focuses on the relationship of the current price to the recent or past price of a market, in contrast to the second-hand values derived from the history of that price.
It can be said that price action trading is a genuine form of technical analysis as it does not include any second-hand, price-derived indicators.
A price action trader is only concerned with the first-hand data that a market produces about itself, i.e., its price action over time. Additionally, price action traders utilize the history of the price movements of the market and typically target the recent price action in the last 3-6 months, with a lighter focus on the more ancient price history. The price history includes swing lows and swing highs in a market, along with support and resistance levels.
Price action traders can employ a market’s price action to describe the thought process of the human behind a market’s action. Each participant in the market leaves price action “clues” on the market’s price chart while trading. These clues then help anticipate the next move in a market.
Why Remove or Reduce Indicators?
Indicators were created to highlight specific market technical elements (including volume, trend, momentum, and so on). Nevertheless, they leave out important technical considerations in doing so. For this reason, traders frequently blend indicators to fill in any gaps in their technical analysis.
Despite any insights the indicators may offer, they inevitably result in blind spots.
- Moving averages and other lagging indicators can often draw attention away from the market circumstances that are currently developing.
- Some crucial facts may be hidden by indicators created for specific purposes.
- Many indicators might make market scenarios too complex, occasionally producing conflicting readings that can result in the dreaded “analysis paralysis.”
- The quality or sufficiency of market information is not always correlated with the number of indicators.
How to Read Price Action?
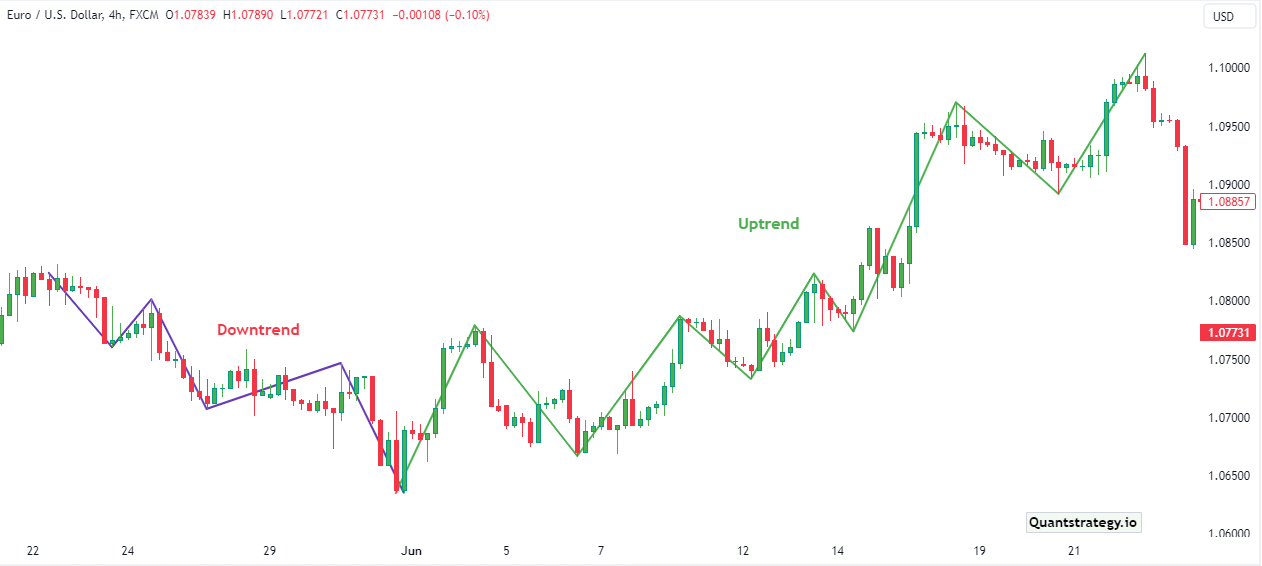
Analyzing trending waves and pullback waves sometimes referred to as impulse and corrective waves, is a key component of price action trading. When trending waves outnumber correcting waves, a trend is said to be progressing.
The length of the trending and pullback waves, also known as ‘swing highs’ and ‘swing lows’, is what traders track to determine the trend’s direction. As per the rule, the price must make higher swing highs and higher swing lows during an uptrend of the trading system. During a downtrend, the opposite is true. On a price chart, the peaks and troughs of trend lines hover between lines of support and resistance.
The overlaid lines in the below Amazon (AMZN) candlestick chart serve to identify the downtrend and uptrend reversal as well as the major up and down waves.
Price waves may also create patterns like ranges (up and down equal-size waves), expanding ranges (lower swing lows and higher swing highs), and triangles (price waves becoming smaller and smaller).
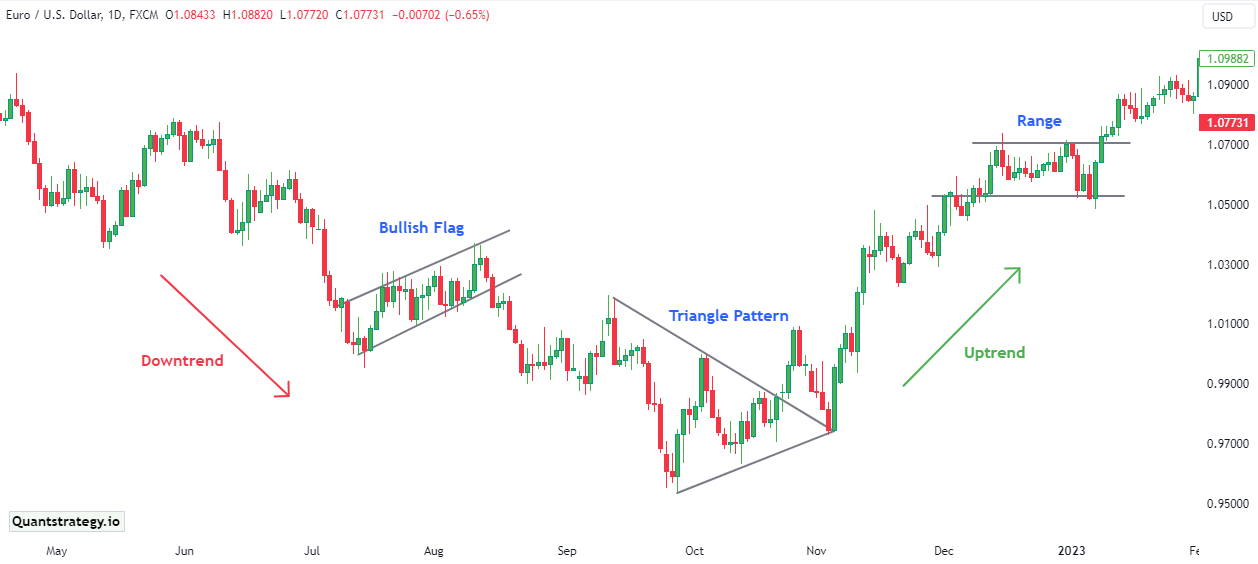
Patterns and trends form the basic structure of trade price action. Additionally, traders also observe patterns on candlestick charts and supply and demand levels.
Tools for Trading Price Action
Because trading price action is related to past price movements and recent price history, all technical analysis tools such as charts, price bands, trend lines, technical levels (of consolidation, support, and resistance), high and low swings, etc., are taken into consideration according to the price action strategy and choice of the trader.
Breakouts
When the price of an asset moves with a particular tendency and breaks that tendency, it notifies traders of a possible new trading opportunity. For example, let us assume a stock trades between 11-10$ in the last 20 days and then moves beyond 11$. This shift in tendency notifies the traders that the sideways movement has probably ended and a likely move to 12$ (or higher) has started.
Breakouts take place due to several different patterns, which include triangles, ranges, flag patterns, and head and shoulders. Breakouts do not mean that the price will continue moving in the predicted direction, and most often, it does not. In that case, it’s called a ‘false breakout’ and provides a trading opportunity in the breakout’s opposite direction.
Remember that a breakout can be small or big. When a trader is looking for short periods or small consolidations where the price moves sideways, a breakout in a trend may offer great profit potential.
Trends
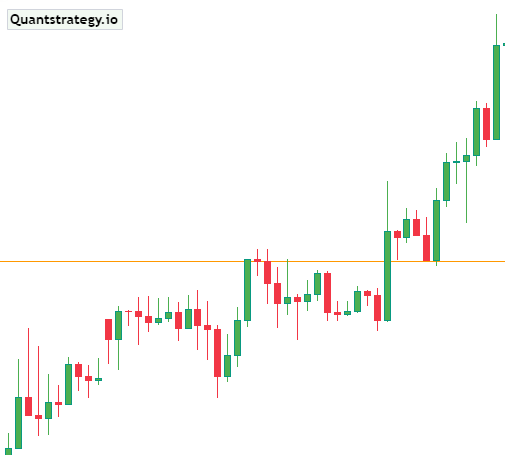
Assets can be traded for the whole day, with prices constantly climbing or falling. These fluctuations are referred to as a ‘bullish’ trend by traders when the price is increasing or as ‘bearish’ trends when the price is declining.
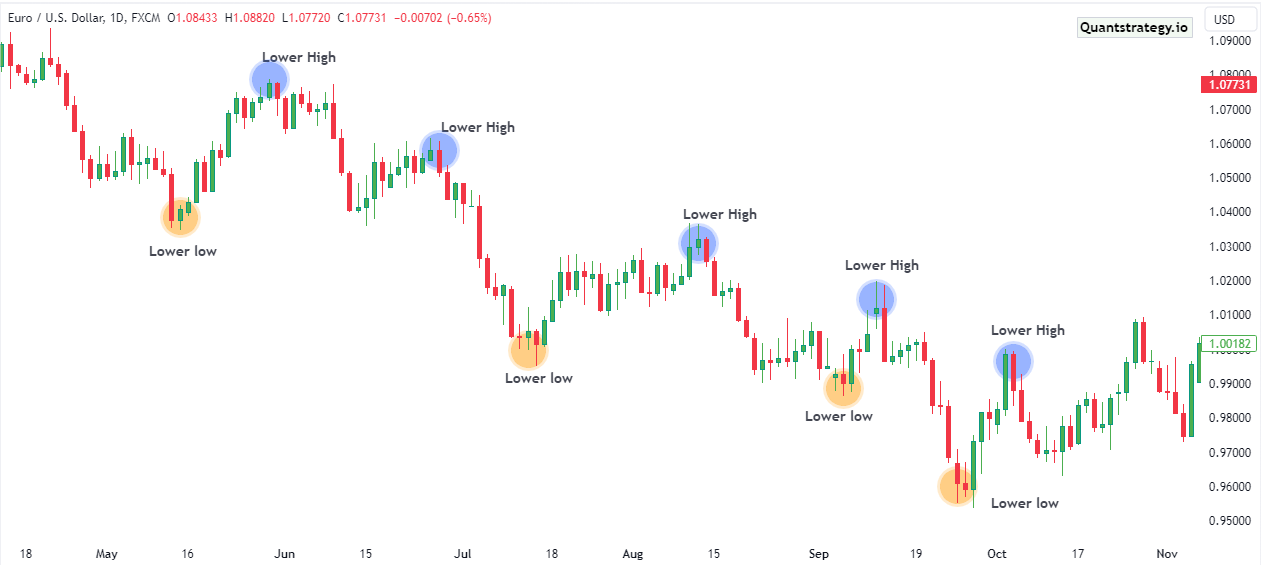
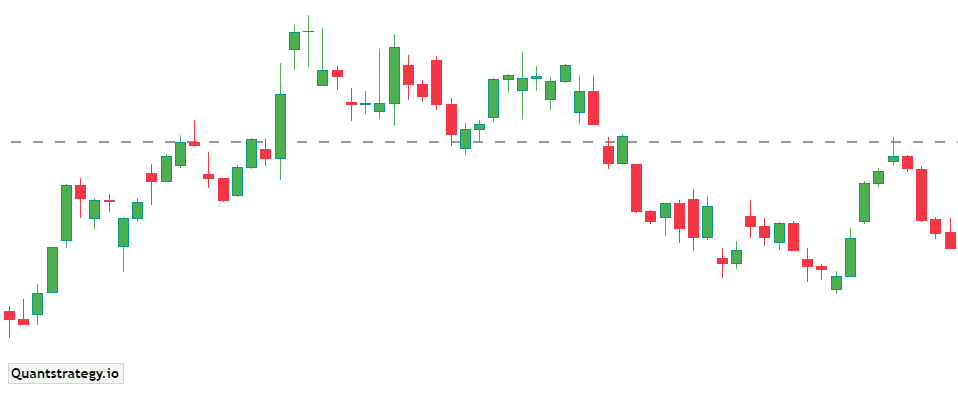
The chart below illustrates a typical price action chart depicting price action trends. It displays only the prices without indicators. There are marked places on the chart which had a considerable direction change for easier orientation. The price is moving in a downward trend, in this case, based on a sequence of lower highs and lower lows.
Candlesticks
A candlestick is a graphical representation of charts that demonstrate the open, close, trend, low, and high of an asset. They are employed by traders in different trading strategies, for instance, some traders use the engulfing candle trend strategy when using candlestick charts.
Support and Resistance
Traders sometimes use price resistance and price support areas to identify useful trading opportunities. Support and resistance regions occur where price reverses in the past. These levels can become applicable again in the future.
In the above downtrend example, we can identify some supports and resistances. See below.
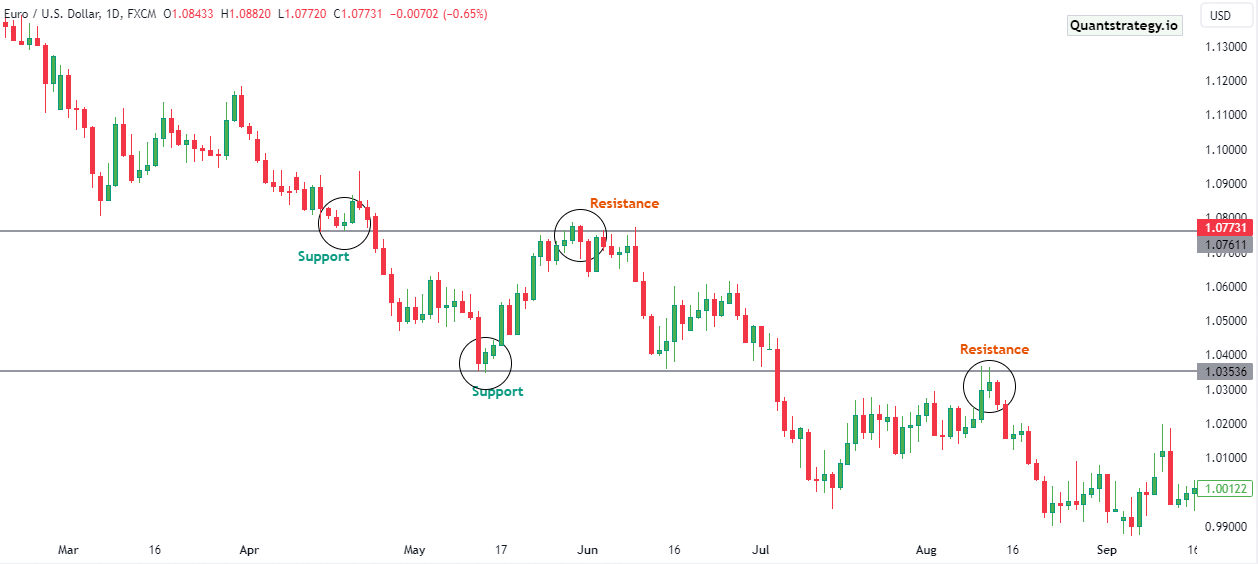
The noticeable point in the above chart is that if support is broken it turns into a new resistance, and the same is true in the opposite direction when a broken resistance turns into a new support.
Moreover, behavioral and psychological interpretations and successive actions decided by the traders also form a critical aspect of a price action trade. For instance, whatever may come, a stock floating at 580 crosses the personal set 600, and the trader assumes a further upward movement to pick a long position. Once 600 is hit, other traders can have a different point of view, they may assume a price reversal and pick a short position.
Two traders won’t have the same price action analysis of a certain price movement because each one will have their interpretation, different behavioral understanding, and defined rules for it. On the contrary, technical analysis scenarios, such as 15 DMA crossing 50 DMA, will generate similar action (long position) and behavior from many traders.
Price action trading is a systematic trading technique, supported by recent price history and technical analysis tools which provides the trader the freedom to take their decisions regarding trading positions within a given scenario according to their strategy and psychological state.
Price Action Trading Strategies
The majority of price action trading strategies circulate patterns. Let us take into consideration the most commonly deployed price action patterns and the trading strategies based on them.
Price Action Continuation Trading
A continuation pattern occurs during an ongoing trend and signals that the market will possibly move in the same direction. In an uptrend, the price has a greater chance to break out to the upper side as the trend is upward. The same applies to a downtrend.
The price action trading strategy behind continuation trade is waiting for the formation of the pattern and then trading only when the price breaks out of the pattern in the trend direction.
Let us assume that a bull flag pattern is formed. This occurs when an uptrend market goes into a consolidation period between the support and resistance line before breaking out to the upper side again.
The original upward trend is flagpole tailed by consolidation, all of which form the flag together.
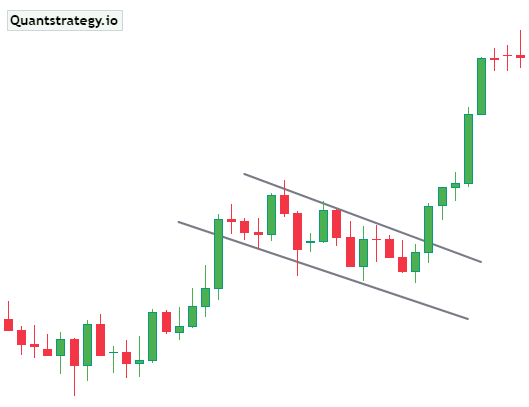
Price action traders wait for the breakout before entering a trade to keep the false signal at bay. They then find the lowest point of the consolidation range and use it as their stop loss level.
Price Action Breakout Trading
The main concern of a price action trader when a breakout occurs is to ascertain if the new trend is a real or a false signal. It informs us that market participants are ready to guard the breakout and progress with the newly formed trend. A secondary breakout usually follows an inside bar, which confirms that the new movement is advancing.
In the below example, there is a red breakout bar, a secondary breakout, and two inside bars. Price action trader enters the lowest range of the inside bar in the market and sets up a stop loss at its top for risk management.
Price Action Retracement Trading
The price action retracement trading strategy involves employing trend lines to locate entry points in the trending markets.
A trend line would be formed on the chart from one swing low to the next in an uptrend, and the line would be drawn past the current price. This is referred to as “trendline support” is what is referred because it should increase or fall by the trend, unlike traditional support levels.
To ensure that one of the entry orders automatically enters the market at a more beneficial price should the market retrace back down, it is a good idea to place a few entry orders along the trend line at various prices.
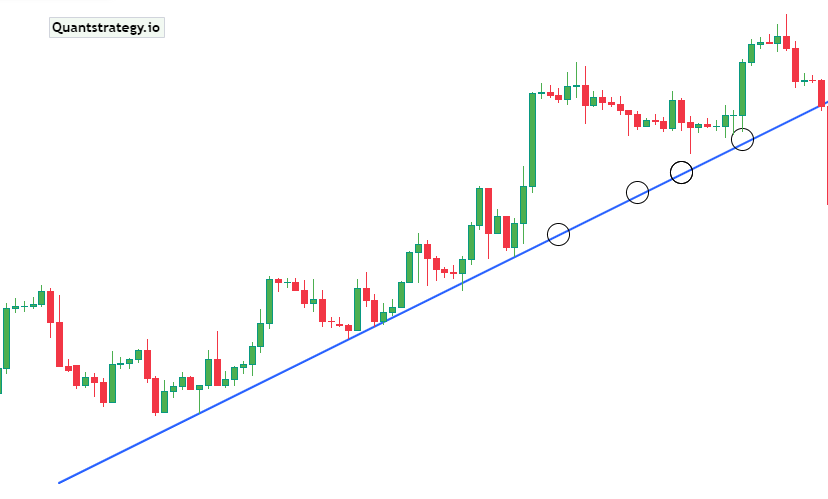
The trendline in this illustration is drawn from a low up to a second swing low. The trader would have a trade ready to unite the uptrend if entry orders had been placed regularly along the line, where the circles are on the chart.
In range markets, horizontal trend lines can also be employed to define areas of support and resistance.
It’s crucial to remember that strategies merely based on trend lines don’t always work because they don’t give precise directions for where to put entry orders. Typically, trendlines and other patterns, such as Fibonacci retracements, are used by traders to confirm the entry positions.
Advanced Price Action Strategies
A few price action strategies happen to be more advanced than others as the patterns upon which they are built either occur very fast or demand a greater amount of market monitoring time. Let’s look at some examples.
Price Rejection Trading Strategy
When the market price tries to cross a support or resistance level but is unable to do so because there is an insufficient force to keep the trading momentum going, price rejection occurs. Since they generate a swift move in the opposite direction, rejections are regarded as advanced moves.
A pin bar pattern, or candle with a long wick, is the foundation of a price rejection trading method.
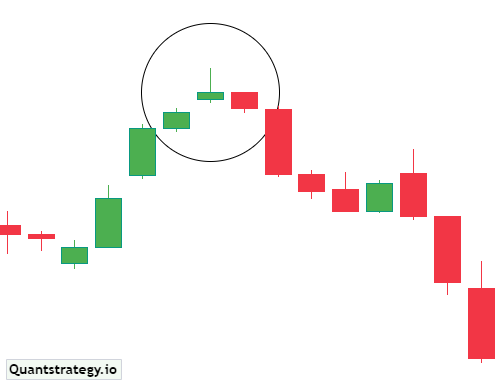
A candle having a long upper wick indicates that throughout the period, purchasers had tried to drive the market price higher and had some success, however, sellers later returned to the market and were able to drive prices back down to nearly the opening price.
A price action trader will typically support the selling once again when a bearish pin bar forms because they think it’s a sign the market would reject the move higher. They can either move in right away or can wait for a confirmation signal in the following candle. The next candle in the previous example is bearish.
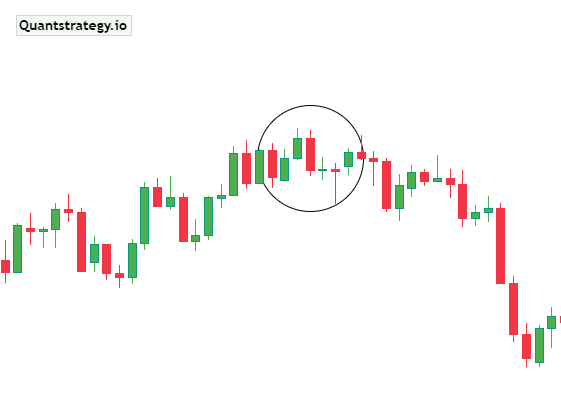
Head and Shoulders Reversal Strategy
One of the most prevalent reversal chart patterns is the head and shoulders pattern that is seen during uptrends. Due to the time it takes for the pattern to develop, which necessitates close market monitoring on the part of traders, it’s frequently regarded as being more advanced.
It consists of a lower peak (shoulder), a higher peak (head), and then another high (shoulder). A ‘neckline’ is drawn by joining the lowest points of the two troughs.
A price action trader would anticipate a price reversal from an earlier uptrend with this formation. To automatically enter the new downtrend, the entry order would be set below the neckline.
Depending on risk tolerance, traders can set a stop loss at or above the peak of the last shoulder.
The profit target can be determined by subtracting the same amount from the entry-level and measuring the distance from the high point of the head to the neckline.
This distance is roughly how far the price will decline after breaking through the neckline.
Conclusion
Like with every trading strategy or tool, profitability depends on how it is applied. Price action trading has proven to be profitable for many successful traders. However, traders who only look at price charts and disregard fundamental factors risk missing important events that have a big impact on the price of their shares.
Price action trading is a potent tool and is the foundation for several strategies deployed by traders throughout the world. However, it takes time to comprehend price action and recognize patterns, trends, and reversals.
Instant Backtests
At QuantStrategy, we believe in validation through data.
That’s why we’ve built a library of backtests on foundational tools like the industry standard indicators.
Curious about the specific win rate, maximum drawdown, and overall performance of strategies on the 6000+ stocks?
We’ve done the heavy lifting.
Click here to explore the full backtest report and turn your market curiosity into a strategic edge.


