

The bull flag pattern is the proven signal professional traders rely on to anticipate massive price continuation. This essential bullish flag pattern signals a temporary pause before the rally resumes, often resembling a tiny flag attached to a sharp flagpole.
Mastering this formation allows you to discover high-probability entry points right before explosive breakouts. Identifying precisely what does a bull flag look like is crucial, but knowing where to place your entry and stop-loss defines success. Are you ready to unlock the secrets to trading this potent bullish flag? We will transform your understanding of the bull flag chart pattern by detailing the exact steps and strategies needed to trade it reliably and consistently across any volatile market.
What is a Bull Flag Pattern?
A bull flag pattern is a continuation pattern that appears when a stock experiences a strong uptrend. Since we are in an uptrend, it’s called a bullish flag. Besides, it is a flag pattern because it resembles a flag on a pole.
The flag formation occurs as the stock pauses for a brief time in the trend following a strong price move higher, pulls back somewhat, and then continues to rise.
Moreover, the pattern must exhibit orderly traits to be considered a complete bull flag pattern. The bull flag consolidation must contain a sequence of lower highs and lower lows. The upward trend must resume after the flag has finished its consolidation phase to be regarded as a bullish flag pattern. If this isn’t fulfilled, the pattern fails. This return should be accompanied by increased volume (demand).
This technical analysis pattern can form in any time frame, from a 1-minute time frame and progressing to the monthly chart. Furthermore, it is a universal pattern that can appear in all markets.
The bullish flag pattern works incredibly well for both swing trading and day trading. Trading with flag patterns is advantageous in a strong trending market or after a breakout.
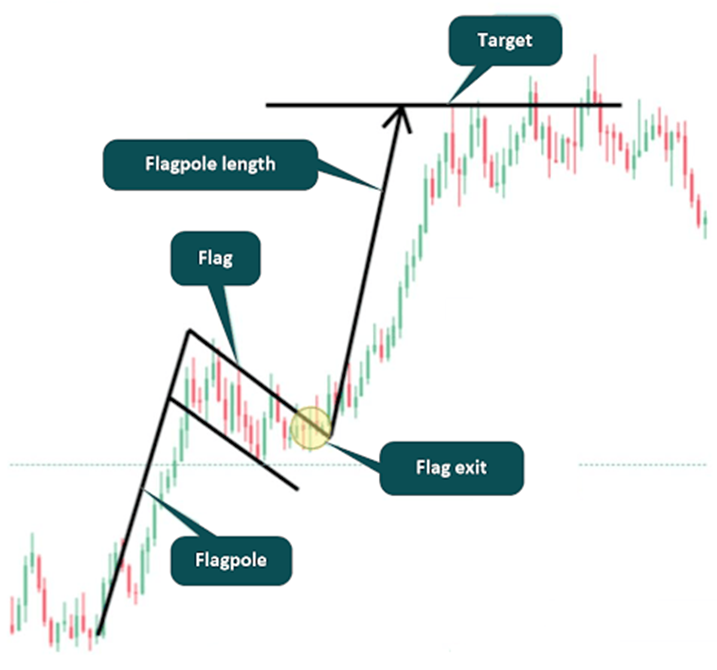
In other words, the bull flag pattern’s primary goal is to enable you to profit from the market’s current momentum. As a result, you may use the data it offers to identify entry points with low risk compared to potential rewards. From a visual standpoint, this pattern consists of a preceding strong upward movement (the pole) and a consolidation that resembles a flag. Its target can be determined by estimating the length of the flagpole and extending it upward from the breakout point.
What does a Bull Flag Pattern Look Like?
The following 15-minute BTCUSD chart is a great illustration example of the key components that make up the bull flag pattern.
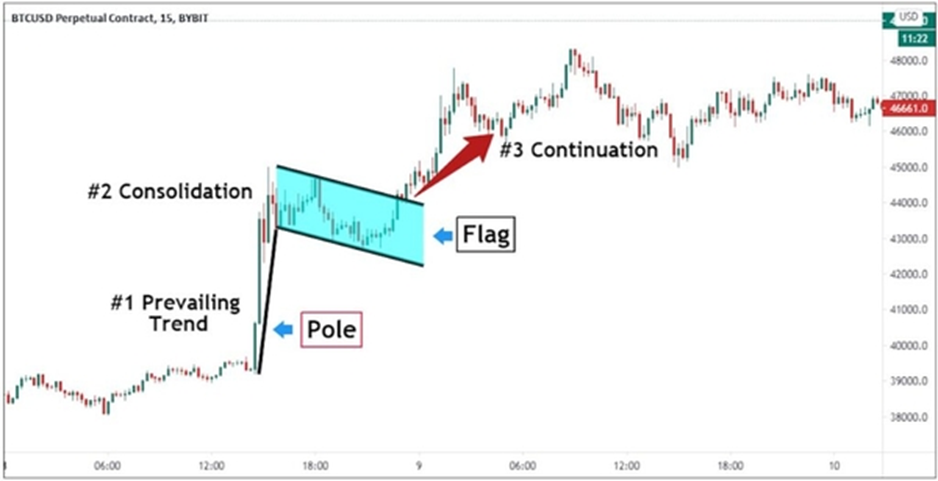
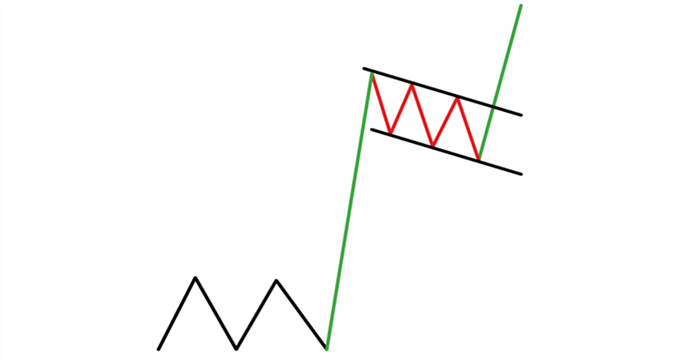
The bullish flag formation essentially has three characteristics:
- The pole, or current upward trend
- Consolidation with a downhill slope frequently called a flag
- The continuation after the resistance in the upper channel was broken
How to Identify a Bull Flag Pattern?
Finding a bull flag on a chart might be challenging because the pattern has multiple distinctive elements. Traders will require a correct understanding of these elements for a successful bull flag pattern trading.
Step 1: Recognize the Trend
Determine the overall trend of the asset you’re researching before looking for the bull flag chart pattern. The pattern should appear during an uptrend when prices are often rising. It is irrelevant if the purchase is in a downtrend or heading sideways.
Step 2: Find the Flag pole
Next, find the flag pole or the price gain that occurred suddenly and sharply during the upswing. The flag pole symbolizes a spike in buying activity.
Step 3: Outline the Flag
Draw a trendline by linking the low points of the price movement during the consolidation period following the flag pole once the flagpole has been located. This trendline denotes the lower boundary of the flag.
Step 4: Determine the Upper Boundary
Outline another trend line that connects the price action highs during the consolidation phase. This trend line denotes the upper boundary of the flag.
Step 5: Verify Volume Behavior
Consider the trading volume during the consolidation phase for additional confirmation. It should fall as the flag pattern develops and rise again during the breakout.
Step 6: Finding a Breakout
After recognizing the pattern, keep an eye out for a breakout above the flag’s upper boundary. A flight takes place when the price convincingly closes above the upper trendline. A trader can think about opening long (buy) positions after this breakout, which frequently indicates that the uptrend will continue.
How to Trade a Bull Flag Pattern?
Now that you know about bull flag patterns, let’s learn some trading strategies. The breakout and pullback techniques are two fundamental attack methods that will be covered below.
Before we continue, it’s crucial to stress that bull flag patterns work with uptrends. So, the “buy” or “long” side of the market is the focus of our trading tactics. The goal is the exact opposite of what the bearish flags indicate.
The Bull Flag Breakout Strategy
The bull flag breakout is a great way to trade the bull flag chart pattern. It seeks to profit from a swift, clear shift in price action. This indicates that, in the case of the bull flag formation, we are interested in buying into the market in expectation of a substantial extension of the current uptrend.
The bear flag pattern, which emphasizes downtrends, is the reverse of this pattern. Breakouts typically work best when an increase in traded volumes accompanies them.
We first identify a bull flag to catch a bull breakout. You should employ technical analysis to identify a bull flag pattern on price charts. Watch for a sudden increase in price (flagpole) followed by a period of consolidation that takes the form of a parallelogram or rectangular shape (the flag).
Before making trade decisions, confirm the pattern with additional technical indicators or investigations. Look for declining trading volume during the flag formation and rising importance during the breakout for extra confirmation.
After that, set the entry trigger. An entry trigger is a breakout located above the upper bounds of the flag (resistance level) when the flag forms a significant multi-candle consolidation period. Traders frequently wait for the price to close above the flag’s top border convincingly before taking a long (buy) position. A buy order is placed above the flag once an increase in volume has been verified.
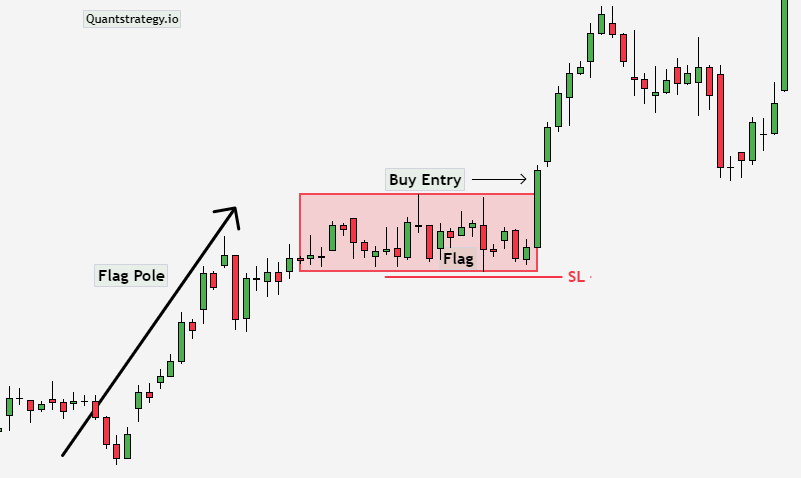
Next, choose your stop-loss level to manage future losses, Set a stop-loss order immediately below the support level (lower border of the flag). The stop-loss order will automatically close the trade to reduce losses if the price swings against your position and breaks below the lower edge of the flag.
The bull flag breakout method is advised to have a risk-to-reward ratio of at least 1:1. As a result, your profit target price will be at least the flag’s range. Please calculate the flag pole’s length (from base to high point) and extend it upwards from the breakout point.
When trading trend continuation patterns on longer time frames, bigger ratios, such as 1:2, 1:3, or 1:4, are acceptable alternatives.
Bull Flag Pullback Strategy
Usually, the flag component of the bull flag pattern does not move in an exact horizontal manner. It often pulls back from the flag pole’s high point. In this situation, purchasing a pullback can increase the likelihood of a trade’s profitability.
It is a good idea to use another technical analysis tool to buy a pullback using bull flag patterns. The Fibonacci retracement is a fantastic tool for this purpose. If a bull flag and a Fibonacci retracement level line up, the market may be worth buying.
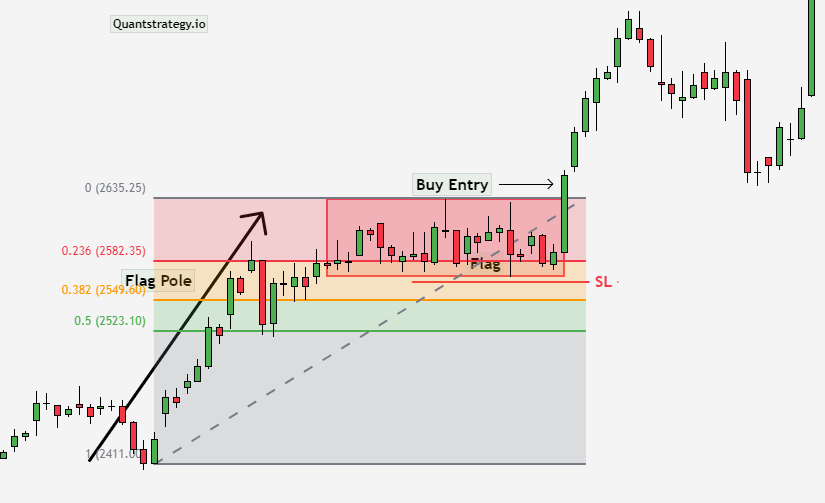
The above chart shows that the bull flag pattern and the 38% Fibonacci level are congruent. In this scenario, one can purchase above the 38% mark and join the prevailing uptrend.
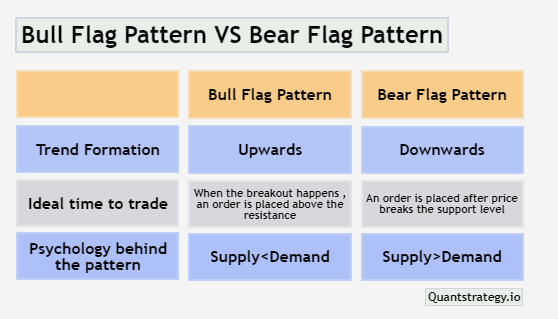
Bull Flag Chart Pattern vs. Bear Flag Chart Pattern
The bull flag and bear flag denote the same chart patterns but only mirrored. The bear flag pattern is a countertrend consolidation within a downtrend, whereas the bull flag pattern is a countertrend consolidation within an uptrend.
Here is how they appear.
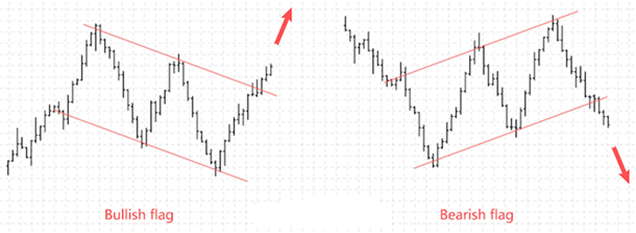
As can be seen from the above image, the context is crucial when comparing a bull flag pattern to a bearish flag pattern. Despite this, they should be treated nearly identically because they are highly similar and only differ in the context of current trends.
A bear flag chart pattern must resume the downward trend in the price markdown of a stock. However, the consolidation should appear the same. In other words, a bear flag rally should consist of higher highs and lows along with lower volume (a weak rally). After that, it should break out downward.
Besides, both the bear and bull flag chart patterns determine the target price as an extension employing the length of the flagpole.
Benefits and Risks
Some key benefits and risks of the bull flag pattern are as follows:
Benefits
- Early Recognition of Continuation: The pattern enables traders to recognize the possible continuation of an upswing that has already begun. A bullish trend that is still going strong can present excellent prospects for profit.
- Well-defined Entry and Exit signals: The pattern offers clear entry and exit indications. Traders can take a long (buy) position once the price breaks above the flag’s upper border and can use the flag’s lower boundary as a stop-loss level.
- Clear Price Targets: Traders may calculate price targets deploying the length of the flagpole, which can serve as a reference for trade planning and profit-taking.
Risks
- False Breakouts: The pattern, like any technical pattern, is not foolproof. Losses could occur from false breakouts if the price moves in the opposite direction.
- Market Volatility: Sudden market volatility or unanticipated news events may interfere with the pattern’s ability to predict price movement.
- Subjectivity: Finding the pattern needs subjective analysis, and several traders may have different interpretations of the pattern. This subjectivity may result in varying trading choices.
Conclusion
Bull flag patterns are an excellent setup for novice traders to learn since they are simple to identify and trade if you get the principles behind them.
Like most chart patterns, volume should be present on the breakout. This validates the pattern and raises the possibility of a successful breakout.


