Think about attempting to navigate the United States using state-by-state maps. You may discover the most efficient approach through each state, but without understanding how everything connects, you’re unlikely to choose the optimal path to your destination.
Individual timeframes do not give traders the full picture; they rely on chart patterns, technical indicators, and trend lines to make decisions. For instance, a long-term support trend line could exist but not be apparent on a short-term chart. One of the most frequent errors made by new traders is failing to take into account multiple timeframes since there is insufficient context in one chart to make decisions.
Using multiple timeframes helps you learn more about the market dynamics and the general trend. When trading, multiple time frame analysis employs a top-bottom strategy and enables traders to assess the longer-term trend while identifying profitable entry points on a smaller time frame chart. Traders can use technical analysis employing multiple time frames to validate or refute their trading bias after determining the suitable timeframes to analyze.
The overall purpose of this post is to see what multiple time frame analysis is and how to understand it to improve your trading.
What is Multiple Timeframe Analysis?
Multiple timeframe analysis or multi-timeframe analysis is an analytical method in trading that can be quite effective when applied correctly. It involves monitoring the same security over a range of frames (or time compressions). The idea is to monitor various time scales on the same instrument under analysis to spot market patterns and behaviors that would enable us to understand what is happening at various time frames. Typically, we look for data from a higher timeframe to inform our trading time frame decisions.
Multiple time frame analysis applies to any liquid financial instrument, including forex, stocks, futures, and cryptocurrencies. While there’s no absolute limit regarding how many timeframes can be observed or which particular ones to select, there are general rules that most professionals will follow.
Using three separate periods often provides a broad enough reading on the market, while employing fewer than this may result in significant data loss, and utilizing more, frequently produces redundant analysis. A straightforward approach is to use the “rule of three” when selecting the three-time frames. This implies that picking a medium-term time frame – which should serve as a benchmark for how long the typical trade is held – should come first.
The next step is to choose a shorter-term time frame, which should be at least one-fourth of the intermediate period (for instance, a 15-minute chart for the short-term timeframe and a 60-minute chart for the intermediate or medium timeframe). According to the same calculation, the long-term time frame should be at least four times bigger than the intermediate one (in the previous example, the 240-minute or four-hour chart would complete the three-time frames).
It is crucial to pick the appropriate time frame when deciding on the range of the three timeframes. A 15, 60, and 240-minute combo will be of little help to a long-term trader who maintains positions for months. However, a day trader who only ever maintains positions for a few hours at a time or rarely longer than one day would find little benefit in daily, weekly, and monthly deals. This is not to imply that the long-term trader is not going to benefit from monitoring the 240-minute chart, and the short-term trader would not profit from keeping a daily chart in the toolbox, but these must occur at the extremes instead of holding the whole range.
As you are aware, there is no single trading approach, which can answer all of our queries, and the same is true with multi-timeframe analysis. Uncertainty will always exist. Because of how efficient today’s markets are, traders need to take every advantage they can to stay one step ahead of the competition.
Multi-time frame analysis enables traders to improve their statistical trading edge. A fundamental trading principle is always to try to trade with the trend whenever feasible. But which trend, exactly? And that is what multiple timeframe analysis assists you to answer. Additionally, the trading edge can further be improved with better market timing, and that is another advantage that can be obtained through comprehensive multiple-time frame analysis.
Top Bottom Approach
One of the most common errors traders make when conducting a multiple time frame analysis is starting their analysis on the smallest of their time frames and working gradually upwards to the higher time frames. This will be referred to as a bottom-up approach.
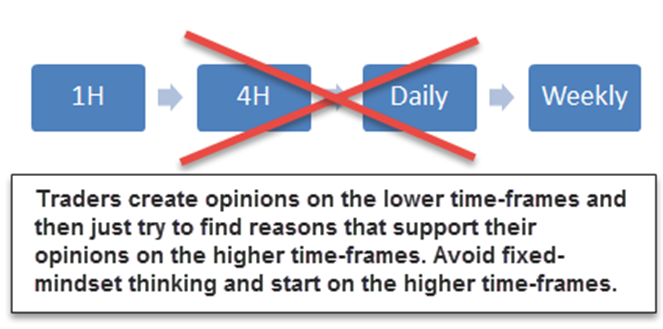
Beginning your analysis on the lower period where you execute trades leads to a highly constrained and one-dimensional perspective and ignores the purpose of multiple timeframe analysis. Traders would often adopt a particular market stance or opinion on their lower time frames and then hunt for opportunities to support it in the higher time frame.
Beginning your analysis on the lower period where you execute trades leads to a highly constrained and one-dimensional perspective and ignores the purpose of multiple timeframe analysis. Traders would often adopt a particular market stance or opinion on their lower time frames and then hunt for opportunities to support it in the higher time frame.
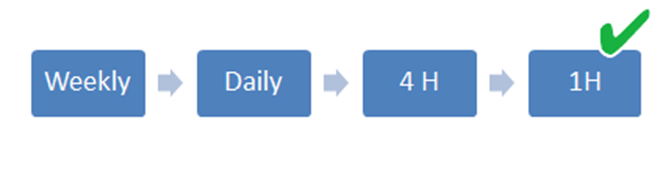
We advise using a top-bottom approach. Traders who use a top-bottom method begin their analysis on a larger timeframe to gain an understanding of the market sentiment, and the context of the overall trend and become aware of significant price obstacles and crucial levels. The trader then searches for trading possibilities on the lower timeframe using the perspective of the higher timeframe. The trade then seamlessly integrates into the general chart narrative.
What Time Frames Work Best?
Finding the correct timeframe is a problem that day traders frequently face. A lack of awareness about this has led to many people giving up on their ambitions to become traders.
When choosing the ideal time frame, there are a few aspects to take into account. First, consider the market’s volatility. For instance, if an asset appears in a range on a daily chart, focusing it on an hourly or 30-minute chart will reveal how volatile it is.
The visibility of trends in the market should be examined next. Your trading style will ultimately be the most crucial factor. Due to its significance, this part will be somewhat lengthier than the previous two.
Are you a day trader, long-term trader, or swing trader?
Swing Traders
Individuals who often initiate trades and keep them for a few days are known as swing traders. Their objective is to spot patterns, after which they can buy or short a stock for some time.
Swing traders typically employ hourly, four-hour, or even daily charts. Using a weekly chart is typically not a good idea.
Day Traders & Scalpers
Day traders are those who open and close trades in a day. There are primarily two categories of day traders.
First, there are scalpers, who start a trade and then end it quickly after making a modest profit. The timeframe of the charts used by these traders is less than 10 minutes. Therefore, the 15-minute, 10-minute, 5-minute, and then 1-minute charts can all be examined in their multiple time frame analysis.
Second, some day traders aim to hold a position for several minutes. Their main objective is to make sure all trades are closed before they go to bed. In this situation, looking at a daily chart, a four-hour chart, and then an hourly chart might be considered in their multiple-time frame analysis.
Long-term Traders
Third, some long-term traders concentrate on acquiring or shorting a stock and hold the trade for several days or months. To analyze these, monthly, weekly, daily, and eventually hourly charts may be used.
You must first understand the type of trader you are and then select the appropriate charts.
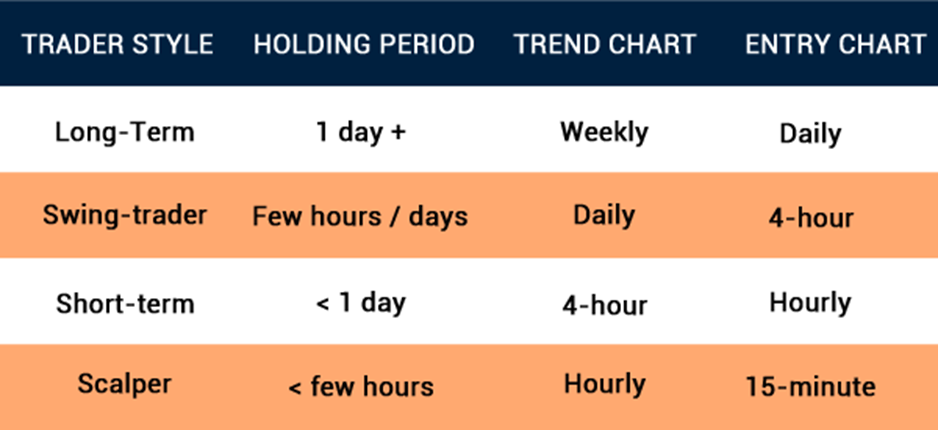
The most frequent timeframe combinations are displayed in the table above. It is advised to choose one combination and stick with it for a considerable amount of trades to increase the consistency of your trading strategy. By doing so, you can get experience with the particular timeframe combination and determine whether it is appropriate for your trading style.
You should avoid switching between different timeframe combinations because it increases noise and causes inconsistencies in your trade.
Stick with one combination for at least 30 to 50 trades before switching time frames.
Multiple Time Frame Analysis Strategies for Day Trading
It is possibly reasonable to state that one of the most popular methods of multiple time frame analysis involves using daily charts to determine the general trend and hourly charts to locate trading opportunities.
As mentioned earlier, day traders can trade within very short time frames because they typically have the entire day to examine charts. These can last anything from one minute to fifteen minutes or even an hour.
When day traders locate their trade setups on the 1-hour time frame, they can then magnify the 15-minute timeframe to find the best market entries.
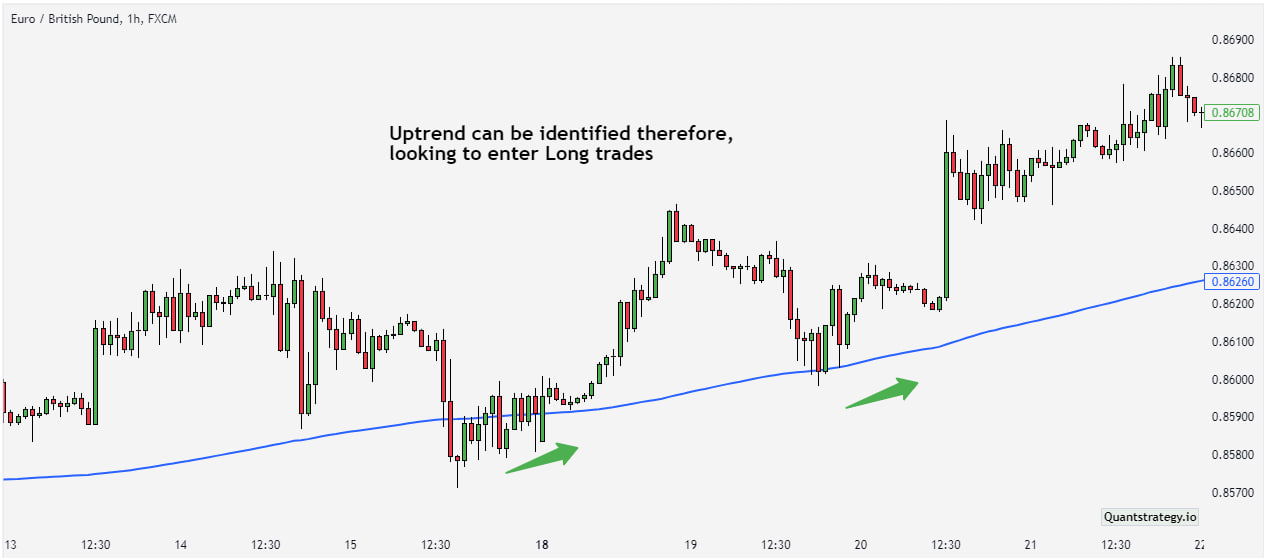
Trend timeframe: 1-hour chart
Entry timeframe: 15-minute chart
Day traders can determine the trend by looking at the one-hour chart. The price is rising and primarily trading above the 200 MA, hence the long trade bias. The 15-minute chart can then be magnified by day traders to identify the best entry points. After that, day traders might enlarge the four-hour chart to find the best entries.
An upward bias may be seen in the EUR/GBP hourly chart.
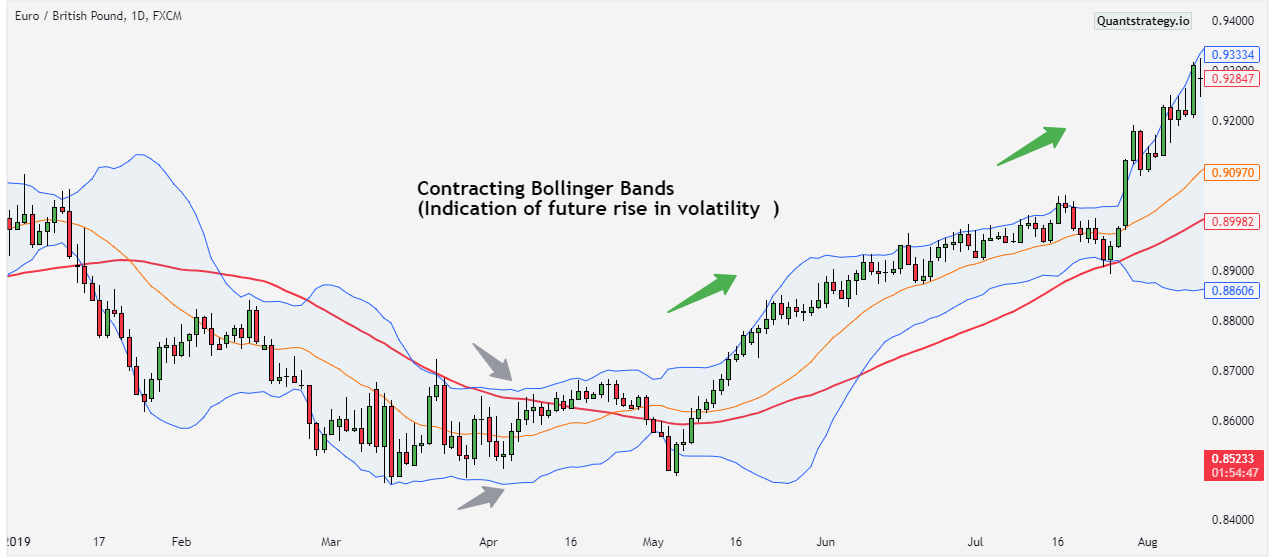
Day traders can examine price movement on the lower time frame more closely using the 15-minute chart. This chart likewise shows an uptrend, which supports the upward bias. The two black arrows indicate the Bollinger band ®, which is shrinking and frequently signals an increase in volatility. Traders can take a long position and use the lower band or the 20-day moving average as a dynamic stop once the price breaks through the upper band.
The below 15-minute EUR/GBP chart displays the best entry point into the market.
Multiple Time Frame Analysis Strategies for Swing Trading
Swing traders have considerably less time to examine charts when compared to day traders – maybe one hour or less. Therefore, swing traders will focus on the daily chart to see the general trend before zooming in on the four-hour chart to find entry points.
Trend timeframe: Daily chart
Entry timeframe: 4-hour chart
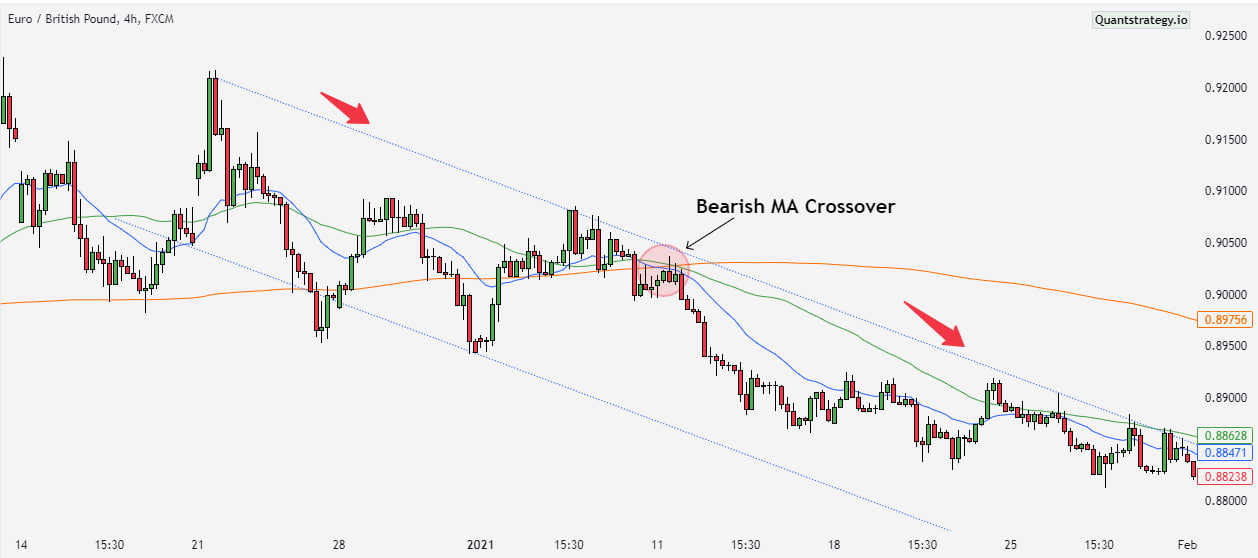
Trading EUR/GBP on the Daily time frame enables traders to identify the downtrend, but where is the best place to enter the market? Zooming in on the 4-hour window clarifies this.
The below daily EUR/GBP chart shows a downward trend.
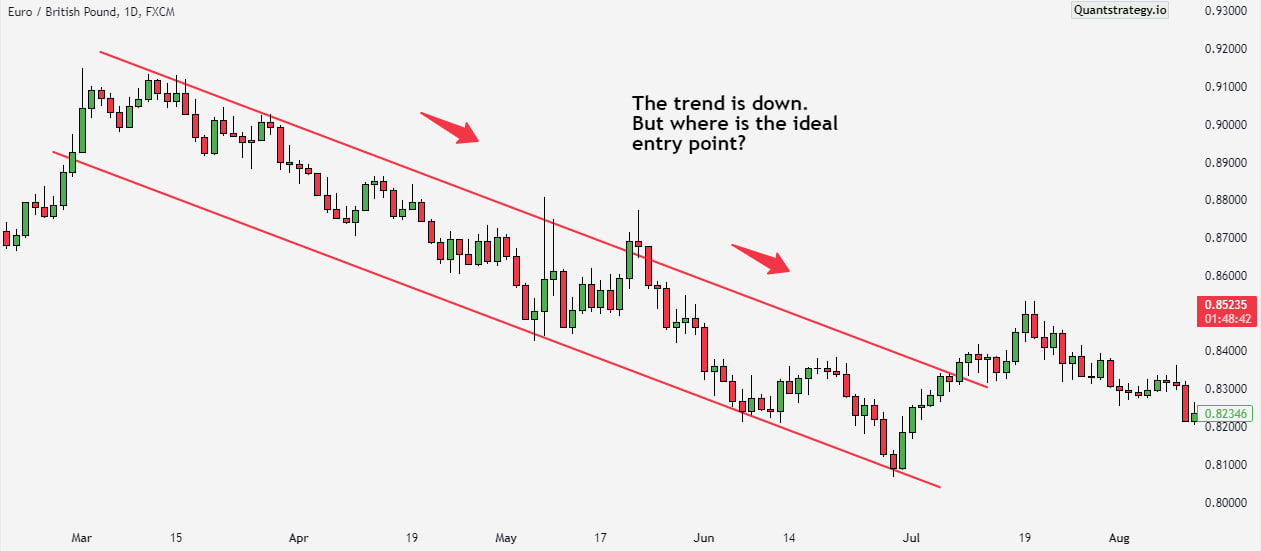
Trading professionals can search for short signals by magnifying the 4-hour chart. It is noteworthy that the upper and lower channel lines have become faint dotted lines to keep the chart tidy. Price returns to the trading range following a failed breakout. A failed upward movement strengthens the case for the short trade.
Price is currently trading below the 200-day SMA. Once back inside the range, there’s a bearish crossover when the 20 MA (green line) crosses under the 50 MA (blue line), which serves as the entry trigger.
It can be seen that trades are filtered on the 4-hour EUR/GBP chart in favor of short positions.
Benefits of Multiple Time Frame Analysis
Multiple time frame analysis has many benefits. Some of them are as follows:
Confirmation of Trends
Trends are the most vital part of trading. Anyone who can find trends early can succeed in investing and trading. Monitoring three timeframes enables you to confirm when a trend is forming.
For instance, you can be more certain that an uptrend is taking place if the trend looks to be moving upward on both the hourly and daily charts. This multi-frame confirmation may assist you in avoiding false signals, which can manifest in a single time frame.
Improved Entry and Exit Points
Your entry and exit points can be improved by using multiple time frames. Let’s imagine the daily chart indicates an upward trend, but you’re not sure when to enter the trade. Then, you may look at the hourly or 15-minute chart to see shorter-term retracements (brief price reversals) within the longer-term uptrend and utilize these as possibilities to enter the trade at a better price.
Finding Support and Resistance Levels
Support and resistance levels are crucial components of technical analysis. You can locate these levels more precisely by utilizing multiple time frames. The strength of a support or resistance level depends on how frequently a price strikes it in various time frames before rebounding.
Risk Management
Improved risk management is another benefit of multi-time frame analysis. You can obtain a clearer sense of the larger picture and avoid getting sucked into damaging short-term volatility by monitoring longer timeframes. For instance, you might spot a selling chance, but checking the daily or weekly chart might reveal a strong uptrend that suggests it’s not a good time to sell.
Conclusion
The multi-timeframe analysis combines a variety of factors to create an opinion. It aids in gaining a wider perspective from larger timeframes. A trade set-up can be found at a lower timeframe, and entry-exit planning can be done at a still lower time frame. This aids the trader in determining in advance what and how he will trade. The larger timeframes can be used to recognize the market direction and the lower timeframes for finding suitable entries for your trade.
The biggest mistake traders make when employing multiple time frames is failing to keep an appropriate spread between the chart time frames examined. Trading results are more consistent when traders maintain a 4:1 or 6:1 ratio between longer-term trend charts and shorter-term signal charts.