

If you are a trader, you need to understand the basics of support and resistance levels. It is one of the essential concepts in technical analysis, as it can help you identify potential entry and exit points for your trades.

This article will explain what Support and resistance levels are, how they work, and how to use them in your trading strategy.
What is Support and Resistance Level?
When it comes to trading, the support and resistance level is one of the essential concepts that you need to understand. Support and resistance are vital levels traders use to make buy and sell decisions on a price chart.
Support refers to a level where the price of a security has historically had difficulty falling below. In contrast, resistance refers to a level where the price of a security has traditionally had a problem rising above.
These levels are identified by analyzing past prices and used as potential price levels where a reversal or break in price trend may occur. One of the best ways to identify support and resistance levels is by using a technical indicator called the moving average convergence divergence (MACD). This indicator can help you see when the market is about to make a reversal.
Image Source

How to Identify Support and Resistance Levels?
Support and resistance levels are important technical indicators used by traders to assess the price movement of a particular asset. When determining support and resistance levels, it is essential to look at various factors, including recent price action, volume, and volatility. One way to identify support and resistance levels is by using a trendline. A trendline is created by connecting two or more price points on a chart.
The line can slope up, down, or sideways. If the line is sloping up, then the security is in an uptrend, and the line represents the potential support level. If the line is falling, then the security is in a downtrend, and the line represents possible resistance levels. There is no guarantee that the price will behave as expected at these levels, but they can help provide insight into when to enter or exit a trade.
Why Support and Resistance Levels Exist
Support and resistance levels exist in financial markets due to basic human behavior. They are areas where large numbers of traders enter and exit the market, causing prices to stall or reverse. As such, they are often seen as critical areas of decision-making for traders, as they can provide significant levels of price stability or reversals in the market.
For example, if the price is in a sustained uptrend and reaches a resistance level, this could be an indication that the trend is ready to end and the price will reverse direction. On the other hand, if the price is in a sustained downtrend and reaches a support level, this could indicate that the trend is ready to end, and the price will bounce off the support and move back up.
A support line is a price level at which a security’s price stops falling and starts to rise. This is the price level where buyers come into the market to support the price and prevent it from further decline.
Applications of Support and Resistance Levels
Support and resistance levels are widely used in technical analysis of financial markets to identify potential levels at which a security’s price may experience upward or downward momentum. These levels are often determined by analyzing historical price data and identifying patterns in price drops. Some typical applications of support and resistance levels include:
-
Identifying entry and exit points for trades
-
Determining stop-loss and take-profit levels:
-
Identifying trends
-
Setting price targets
-
Risk management
Tips for Trading with Support and Resistance Levels
When it comes to trading with Support and resistance levels, there are a few things you need to keep in mind. First and foremost, you must identify the critical Support and resistance levels. Once you have recognized these key levels, you need to monitor the price action closely to see if the market can break through these levels.
Suppose the market does break through a critical level of Support or resistance. In that case, this is typically seen as a powerful signal, and you should look to enter into a trade in the direction of the breakout. But it’s equally crucial to remember that false breakouts can occur from time to time, so you need to be careful not to enter into a trade too early.
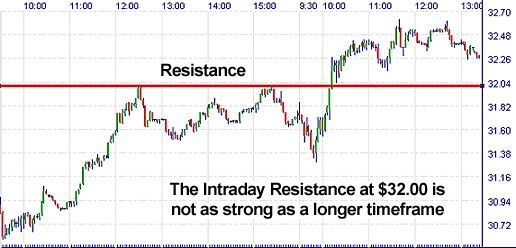
Utilize multiple time frames. Using multiple time frames, you can identify trends that may not immediately appear on a single chart. For example, a 15-minute chart might show one support level, while an hourly chart could show another.
Best indicators for support and resistance trading strategy
When it comes to trading support and resistance levels, several indicators can help traders better identify the proper levels and make better trading decisions.
Moving averages are one of the most popular support and resistance trading indicators. Moving averages help traders identify a trend by plotting the average price of a security over a specific period.
The longer the time frame, the smoother the resistance line and the easier it is to identify a trend. By plotting two or more moving averages, traders can spot crossovers, which can signal when a trend may be reversing or strengthening.
Another popular support and resistance trading indicator is the Relative Strength Index (RSI). This indicator compares the magnitude of recent gains to recent losses to measure momentum and identify potential reversals.
Plotting Support and Resistance Levels
Support and resistance levels are essential tools traders use to help them decide when to enter and exit trades. These levels are based on past price action and are used to try and predict future price action.
There are a few different ways to plot these levels, but using a simple moving average is the most common. To do this, you take the security’s average price over a certain period (usually 20 days) and then plot that line on your chart. These levels are often identified using historical data and chart patterns.
Once traders have identified support and resistance levels, they can begin identifying possible trade entry and exit points. By understanding where these levels are located and how they affect the price of an asset, traders can gain an edge in their trading strategies.
Why knowledge about support and resistance levels is important for traders
Support and resistance lines are important for traders to understand to trade the markets successfully. Knowing when to enter and exit positions are crucial for success, and having knowledge of support and resistance levels can help you make more informed trading decisions. Major Support and Resistance levels should be noted when there is a fall in price.
Support and resistance levels indicate the levels at which the price of an asset is likely to find support or resistance. Knowing when these levels are likely to occur can give you a significant advantage in predicting price movements. By understanding when support and resistance levels might be tested, you can better time your entry and exit points and identify potential profit and loss areas.

Knowing when to enter and exit positions based on support and resistance levels can also help avoid costly mistakes, such as entering a trade too soon or exiting too late. Support and resistance levels can provide a solid framework for building an effective trading strategy that maximizes profits while minimizing losses.
What Are the Advantages of Using Support and Resistance Levels?
Support and resistance levels can provide traders and investors with important information about the potential future direction of a security’s price. The main advantage of using these levels is that they can help traders identify critical levels at which a security’s price may experience a significant change in direction.
This can be useful for short-term traders looking to make quick profits and long-term investors looking to identify potential entry or exit points. Additionally, support and resistance levels can be used with other technical indicators to help confirm possible trade signals and make more informed trading decisions.

Support and resistance trading ranges or zones
Support and resistance levels don’t always have to be exact prices. Sometimes, they can be ranges or zones. These are areas in which buyers and sellers may cluster together and be expected to cause price movement. A supporting range is where buyers will likely enter and push the price up. Conversely, a resistance range is an area where sellers are likely to enter and push the price down.
Traders typically look for wide ranges with many levels of support and resistance zones. These ranges indicate a large amount of buying and selling activity. If a range is too small, there’s not enough room for a trend to form or for a successful trade to be executed. However, if the range
is too extensive, it can be challenging to identify entry and exit points.
When the price falls, it can be a difficult situation to manage. The price reaches a key resistance level and fails to break through; this can signal that the downward momentum is weakening, and there could be an opportunity for a short-term reversal.
Conclusion
Support and resistance levels are essential to technical analysis, and understanding them is critical to successful trading. By recognizing these levels, traders can identify areas where a stock might find Support or resistance and use this information to inform their trading strategies. While the concept may seem intimidating initially, with some practice, it’s not difficult to master. With a better understanding of Support and resistance, you’ll be able to make more informed decisions as a trader – leading to higher profits.


