


There are many technical indicators available to identify potential entry and exit points, decipher market trends, and make informed trading decisions. However, only a few can match the Williams %R (Williams Percent Range) and Relative Strength Index (RSI) when used correctly. Both serve as momentum oscillators, providing insights into overbought and oversold conditions and enabling traders to identify entry/exit and potential reversal points. However, they differ in their interpretation and calculation methods.
In this blog post, we shall cover the details of the Williams %R and the RSI indicator and explain their strengths and limitations to determine which can better fit your trading strategy.
Understanding Relative Strength Index (RSI)
The RSI is a momentum indicator that gauges the speed and magnitude of recent price shifts of a stock to asses undervalued or overvalued conditions in that stock’s price.
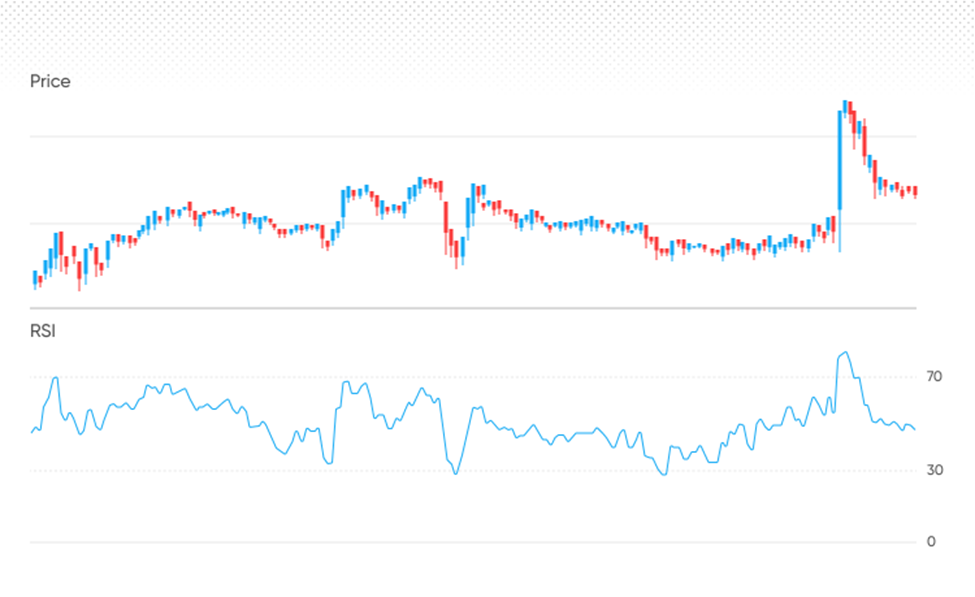
The indicator is demonstrated as an oscillator (line graph) that oscillates between two extremes on a scale of 0 to 100. It was created by J. Welles Wilder Jr. and is capable of more than just identifying overbought and oversold stocks. Additionally, it can point to stocks that might be ready for a correction or trend reversal. It may indicate when to sell and buy. Traditionally, the RSI reading reflects the weakness or strength of the price momentum of the security.
- An RSI reading of 30 or below indicates an oversold area, indicating that the security can be undervalued and a price comeback could be imminent.
- An RSI reading of 70 or above indicates an overbought area, indicating that the security may be overvalued and a price correction could be on the horizon.
Additionally, the RSI can be computed at various periods. Though some traders like to utilize bespoke RSI indicator settings, such as 2, 9, or 50 periods, the conventional default is 14 periods. For example, traders might change the settings to short lookback periods, like 7 or 10 periods, to boost RSI’s sensitivity to recent price fluctuations and optimize it for day trading.
Calculating the RSI
The Relative Strength Index can be calculated by the following formula:
RSI = 100 – (100 / 1 + RS)
Where
RS = Avg. Gain / Avg. Loss
The average gain or average loss used in this computation is the average percentage gain or loss in a look-back period. Moreover, the average gain is calculated by dividing the total upward price changes over the last n periods (usually 14, per Welles Wilder’s recommendation) by the number of periods required to reach the average.
The average loss is calculated by dividing the total downward price changes over the same number of periods by that same number of periods.
The Relative Strength factor (Average Gain / Average Loss) is then converted to an RSI reading between 0 and 100 to generate the RSI formula.
Exploring the Williams %R Indicator
The Williams %R, also called %R, is a momentum indicator that determines overbought and oversold conditions in a market. It oscillates between 0 and -100 and indicates how close the current price is to the highest high in the last n periods, where n is generally 14.
- A reading from 0 to -20 is considered overbought and can be due for a pullback.
- A reading from -80 to -100 is considered oversold and can be due for a bounce.
Williams %R was developed by Larry Williams and is quite similar to the Stochastic indicator. However, the Stochastic oscillator determines the close relative to the lowest low for the lookback period and William %R measures the close relative to the highest high for the lookback period.
An overbought or oversold value doesn’t imply the price will reverse. An overbought simply implies that the Williams %R has a high value and the price is close to the upper extreme of the range. An oversold means that the indicator has a low value and the price is close to the lower extreme.
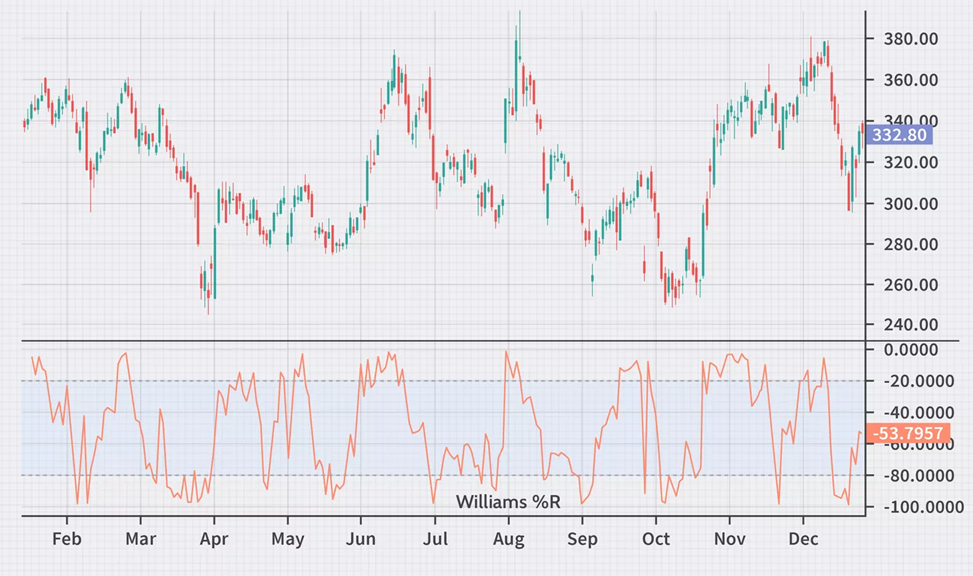
The Williams %R is a tool used by traders to assess the strength of market moves and spot possible trend reversals. Traders frequently place sell orders at -20% and buy signals at -80% as an indication for entry and exit positions. They can improve their overall trading tactics by making well-informed decisions on when to enter and exit the market by examining the values of the indicator.
The formula for Williams %R is:
Williams %R = (Highest High – Close) / (Highest High – Lowest Low) x (-100)
Where
Highest High = Highest price in the look-back period, usually 14 days
Close = Most recent closing price
Lowest low = Lowest price in the look-back period, usually 14 days
Differences between the Williams %R Indicator and the RSI Indicator
Although the Williams %R and RSI are momentum indicators, traders should consider their unique characteristics when employing them in their analysis. Let’s see how the two indicators differ from one another:
- Calculation Method: Williams %R and RSI differ substantially in the way they are calculated. While both are momentum indicators, the Williams %R determines the difference between the current close and the highest high over a certain period, whereas the RSI measures the magnitude of recent gains and losses.
- Scale: Another difference is that RSI oscillates on a scale of 0-100, whereas Williams %R oscillates on a scale of 0 to -100.
- Range Limits: The range limits for overbought and oversold levels are also different for the two indicators. The threshold levels for Williams %R are -20 and -80, and for RSI are 70 and 30. This variation can affect the interpretation of market conditions and possible trading signals among investors.
- Sensitivity to Price Variations: Because RSI averages price changes over time, it is often smoother than the Williams %R. In trending markets, this smoothing effect might offer clearer indications; yet, it might lag in rapidly shifting market conditions. Conversely, Williams %R is more sensitive to recent price swings and may offer early signs of trend reversals.
- Application in Various Markets: Both indicators are applicable in various financial markets, such as stocks, forex, cryptocurrencies, and commodities. However, traders can find that one indicator works better in particular time frames or market conditions than the other.
Which is Better?
Determining whether Williams %R is better than RSI hinges on trading style, preferences, objectives, and particular market conditions you are analyzing. Some can favor the smoothness and simplicity of RSI, whereas others may like the responsiveness of %R to recent price variations.
Besides, traders often employ multiple indicators in combination to confirm indications and decrease the possibility of false positives. Combining RSI and Williams %R with other indicators, like MACD or moving averages can offer a deeper analysis of market dynamics and enhance trading strategies.
Conclusion
In conclusion, neither RSI nor Williams %R is inherently better than the other. Both of them have their advantages and disadvantages, and their effectiveness relies on the way they are used within your broad analytical framework. In a nutshell, we can say that experimentation, continuous refinements, and backtesting of trading strategies are necessary for finding the right balance of indicators that best fit your objectives and risk tolerance.


