


The Williams Percent Range (%R) indicator also known as the Williams %R is a popular technical analysis tool used by traders to identify potential buy and sell signals in financial markets. Named after its creator, Larry Williams, the %R is a momentum oscillator that measures the level of an asset’s recent price performance relative to its trading range over a specified period of time.

In this blog post, we will explain how to use the Williams R indicator in trading strategies. We’ll cover what the %R is and how it works, as well as different trading strategies that use the indicator. We’ll also compare the %R to other technical indicators, discuss common trading rules for the %R, and provide tips on how to choose the best settings for your trading strategy. By the end of this post, you’ll have a better understanding of how to incorporate the Williams %R indicator into your trading strategy to potentially improve your performance.
What is the Williams Percent Range (%R) Indicator?
The Williams Percent Range indicator is a technical analysis tool used to measure the momentum of an asset’s price. The momentum indicator can help determine whether a stock is in overbought or oversold territory, by providing an overbought or oversold reading. The Williams %R is similar and the inverse of the Fast Stochastic Oscillator. It has the same calculation formula and meaning but inverse scale.
Williams %R Formula
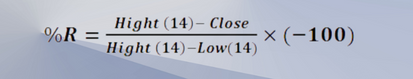
The %R is calculated using the following formula:
%R = (Highest High – Close)/(Highest High – Lowest Low) * -100
Where:
Close: the asset’s closing price for the most recent period
Highest High: the highest high price for the specified lookback period
Lowest Low: the lowest low price for the specified lookback period
The %R is commonly used in technical analysis to identify potential buy and sell signals. When the %R crosses above the -80 level from below, it is considered a buy signal. Conversely, when the %R crosses below the -20 level from above, it is considered a sell signal. Traders also use the %R to identify divergences between the price of an asset and the William r indicator, which can signal potential trend reversals.
How Does the Williams %R Indicator Work?
In technical analysis, traders often use momentum indicators like the Williams Percent Range (WPR) to identify overbought or oversold readings, which occur when an underlying security’s price has moved too far in one direction and is likely to experience a correction. To determine whether an indicator is considered overbought or oversold, traders will typically set an overbought threshold and an oversold threshold, with readings above the overbought threshold indicating overbought territory and readings below the oversold threshold indicating oversold territory.
These thresholds are typically based on the look-back period of the indicator, which measures the high-low range of the underlying security over a certain number of periods.
Traders use the Williams %R in two ways:
Trend-Following Indicator
As a trend-following indicator, traders use the %R to identify overbought or oversold conditions and enter trades in line with the current trend.
Contrarian indicator
As a contrarian indicator, traders use the %R to identify potential trend reversals and enter trades against the prevailing trend.
When a stock is overbought, it means its price is close to the upper end of its recent range, while oversold refers to a situation where the price is near the lower end of its recent range. They also monitor divergences between the %R and asset prices, which can indicate a potential market trend shift.
How to Use the Williams %R Indicator in Trading Strategies
There are a variety of trading strategies that incorporate the Williams percent range indicator. Here are three common approaches:

Trend-following strategy
In this strategy, traders use the %R to identify overbought or oversold conditions and enter trades in the direction of the prevailing trend. For example, if the %R is below -80 and trending higher, traders may look for long positions in anticipation of a trend reversal. Conversely, if the %R is above -20 and trending lower, traders may look for short positions in anticipation of a price correction.
Reversal strategy
In this strategy, traders use the %R to identify potential trend reversals and enter trades against the prevailing trend. For example, if the %R is diverging from the price of an asset and trending lower, traders may look for long positions (buy signals) in anticipation of a price rebound. Conversely, if the %R is diverging from the price of an asset and trending higher, traders may look for short positions (sell signals) in anticipation of a trend reversal.
Divergence strategy
In this strategy, traders use the %R to identify divergences between the %R and the price of a security , which can signal potential trend reversals. For example, if the price of a security is making higher highs while the %R is making lower highs, it may indicate that the trend is losing momentum and a reversal may be imminent. Traders may then look for long or short positions depending on the direction of the reversal.
When trading with the %R, it’s important to use other indicators and tools to confirm potential buy and sell signals. Traders may also want to incorporate risk management strategies, such as stop-loss orders and position sizing, to minimize losses and maximize profits.
Williams %R Trading Strategy
One popular trading strategy that uses the Williams %R indicator is the “Percent R Retest” strategy. This strategy is a trend-following approach that aims to identify potential trend reversals and enter trades in the direction of the prevailing trend. Here’s how the strategy works:

Identify the trend
Determine the direction of the prevailing trend by using other technical analysis tools, such as moving averages or trend lines.
Wait for a retracement
Once the trend is identified, wait for a retracement or pullback in price to the 50-period moving average. This retracement should be at least 50% of the previous price swing in the direction of the trend.
Look for a %R retest
Once the retracement occurs, wait for the %R to cross below -80 (in an uptrend) or above -20 (in a downtrend) and then cross back above -50. This is known as a “Percent R retest” and is used as a signal for a potential trend continuation.
Enter the trade
Once the %R has retested and crossed back above -50, enter a long position in an uptrend or a short position in a downtrend. Use a stop-loss order to limit losses in case the trade goes against you.
Exit the trade
Take profits when the price reaches the previous high (in an uptrend) or the previous low (in a downtrend) before the retracement occurred.
Here’s an example of how the Percent R Retest strategy might work in practice. Let’s say you’re trading the EUR/USD currency pair and have identified an uptrend on the daily chart. You wait for a retracement to the 50-period moving average and then look for a %R retest. On August 20, the %R crosses below -80 and then crosses back above -50. This is your signal to enter a long position. You place a stop-loss order below the most recent swing low and take profits when the price reaches the previous high before the retracement occurred.
Of course, as with any trading strategy, there is no guarantee of success. Traders should use the Percent R Retest strategy in conjunction with other indicators and tools to confirm potential buy and sell signals. It’s also important to manage risk appropriately by using stop-loss orders and position sizing.
Williams %R Indicator vs. RSI Indicator
The Williams %R and the Relative Strength Index (RSI) are both momentum indicators used in technical analysis. This momentum indicator has some similarities, but there are also some differences as well.
The Williams percent range indicator is a bounded oscillator that ranges from -100 to 0, with overbought and oversold levels at -20 and -80, respectively. It’s calculated based on the highest high and lowest low over a given lookback period, typically 14 days. In contrast, the RSI is an unbounded oscillator that ranges from 0 to 100, with overbought and oversold levels at 70 and 30, respectively. It’s calculated based on the average gain and loss over a given lookback period, typically 14 days.
One of the strengths of the Williams %R is that it’s more sensitive to short-term price movements than the RSI. This can make it useful for identifying potential reversals in the market. However, it can also lead to more false signals, especially in ranging markets. The RSI, on the other hand, is generally better at identifying the strength of a trend and can be used to confirm potential buy and sell signals.
Williams %R Indicator Settings
The most commonly used setting for the Williams %R indicator is a lookback period of 14, which means the calculation is based on the highest high and lowest low over the past 14 periods. However, traders can adjust the lookback period to suit their specific strategy better. For example, a shorter lookback period may be more suitable for day traders, while a longer lookback period may be more suitable for swing traders.
When choosing the best settings for the Williams %R, traders should consider the volatility of the asset they’re trading, their trading time frame, and risk tolerance. It’s also important to test different settings and evaluate the indicator’s performance over a period of time before making any final decisions.
Traders should experiment with different settings and find the combination that works best for their individual trade strategy.
The Williams %R indicator can be useful for identifying overbought and oversold conditions in the market. This rule suggests that traders should not enter a trade unless the %R has moved above -20 or below -80 and then crossed back through that level. Other trading rules for the Williams %R indicator include using overbought and oversold levels as buy and sell signals or looking for bullish and bearish divergences between the indicator and price.
It’s important to remember that trading rules should be used in conjunction with a trader’s own analysis and discretion. It’s also important to use proper risk management techniques to minimize losses and maximize gains.
Conclusion
The Williams Percent Range (%R) is a technical indicator used in financial analysis, which calculates the distance between the current closing price and the high/low range over a given period. Traders can use this indicator to identify potential buy and sell signals and improve their trading strategies. However, the %R should not be used in isolation, but rather combined with other technical indicators to confirm potential trading opportunities.
In addition, it’s important for traders to use proper risk management techniques when incorporating the %R into their trading strategies. By considering the %R alongside other technical indicators and implementing appropriate risk management measures, traders can increase their chances of success in the markets. Overall, the Williams %R indicator can be a useful tool for traders looking to improve their trading performance and identify potential opportunities in the markets.


