Technical divergences are powerful signals that can help traders identify potential reversals in a trend. Bullish divergences occur when the price of an asset makes a lower low while the corresponding technical indicator makes a higher low.
This suggests that momentum is shifting and a bullish reversal may be on the horizon. Bearish divergences occur when the price of an asset makes a higher high while the corresponding technical indicator makes a lower high. This suggests that momentum is weakening and a bearish reversal may be on the horizon.
In this blog post, we will discuss how to use bullish and bearish technical divergences in trading strategies. We will explore the different types of divergences, how to identify them, and how to incorporate them into trading strategies.
Divergence and reversal
Divergence and reversal are two terms used in technical analysis to describe different aspects of price action and indicator behavior.
Divergence occurs when the price of an asset and an indicator, such as the Relative Strength Index (RSI), move in opposite directions. For example, the price of an asset may be making lower lows, while the indicator is making higher lows. This divergence can be an indication that the momentum of the price trend is slowing down, and a potential reversal may be on the horizon.
Reversal, on the other hand, refers to a change in the direction of the price trend. A reversal can occur after an uptrend or a downtrend, and it can be identified by a series of higher highs and higher lows or lower highs and lower lows. For example, a downtrend may reverse into an uptrend when the price starts making higher highs and higher lows, indicating a shift in the momentum and a potential trend reversal.
While divergence and reversal can be related, they are not the same thing. Divergence can be a signal that a reversal may be coming, but it does not necessarily mean that a reversal has already occurred. Reversal, on the other hand, is a change in the direction of the trend, regardless of whether or not there was any divergence before it.
Types of Divergences
There are two main types of divergences that traders should be aware of: Bullish divergences and Bearish divergences.
Bullish Divergences
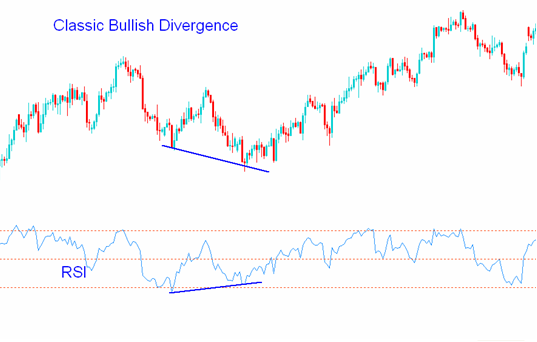
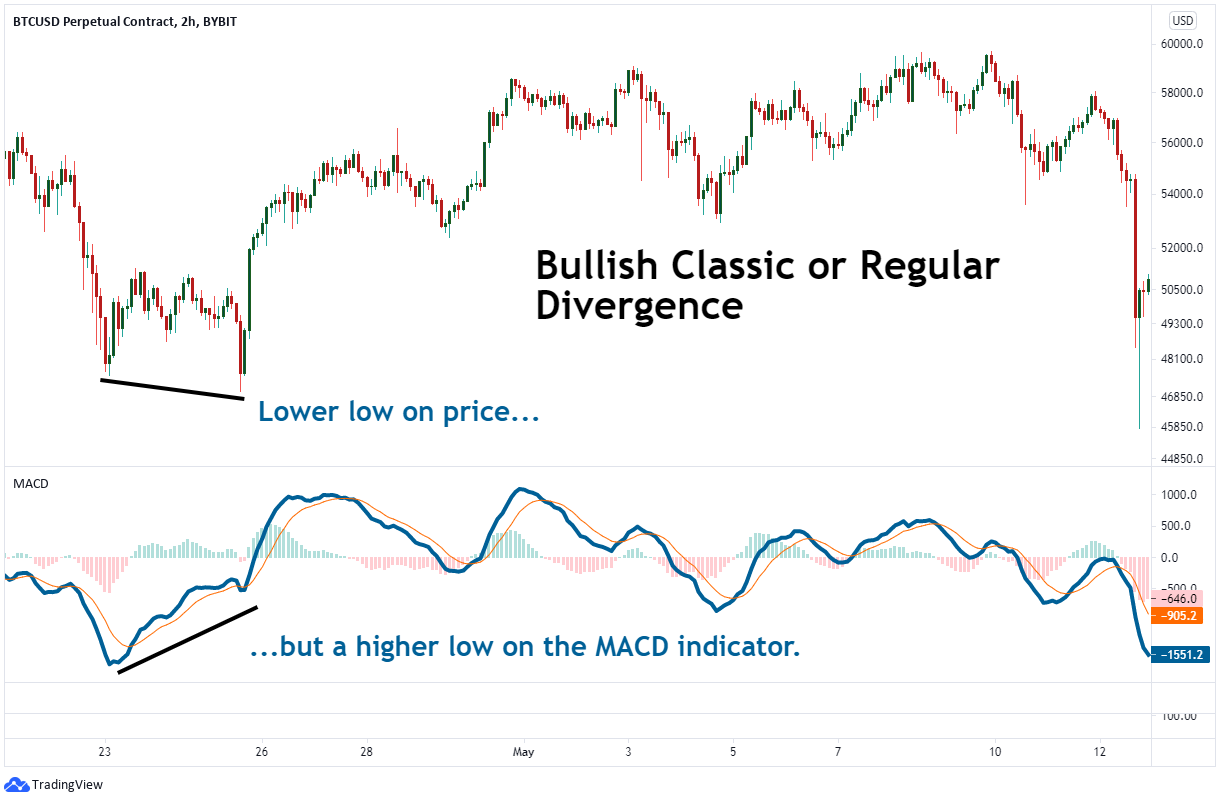
Bullish divergences occur when the price of an asset makes a lower low while the corresponding technical indicator makes a higher low. This suggests that momentum is shifting and a bullish reversal may be on the horizon.
There are three main types of bullish divergences:
- Classic Bullish Divergence: Occurs when the price of an asset makes a lower low while the corresponding technical indicator makes a higher low.
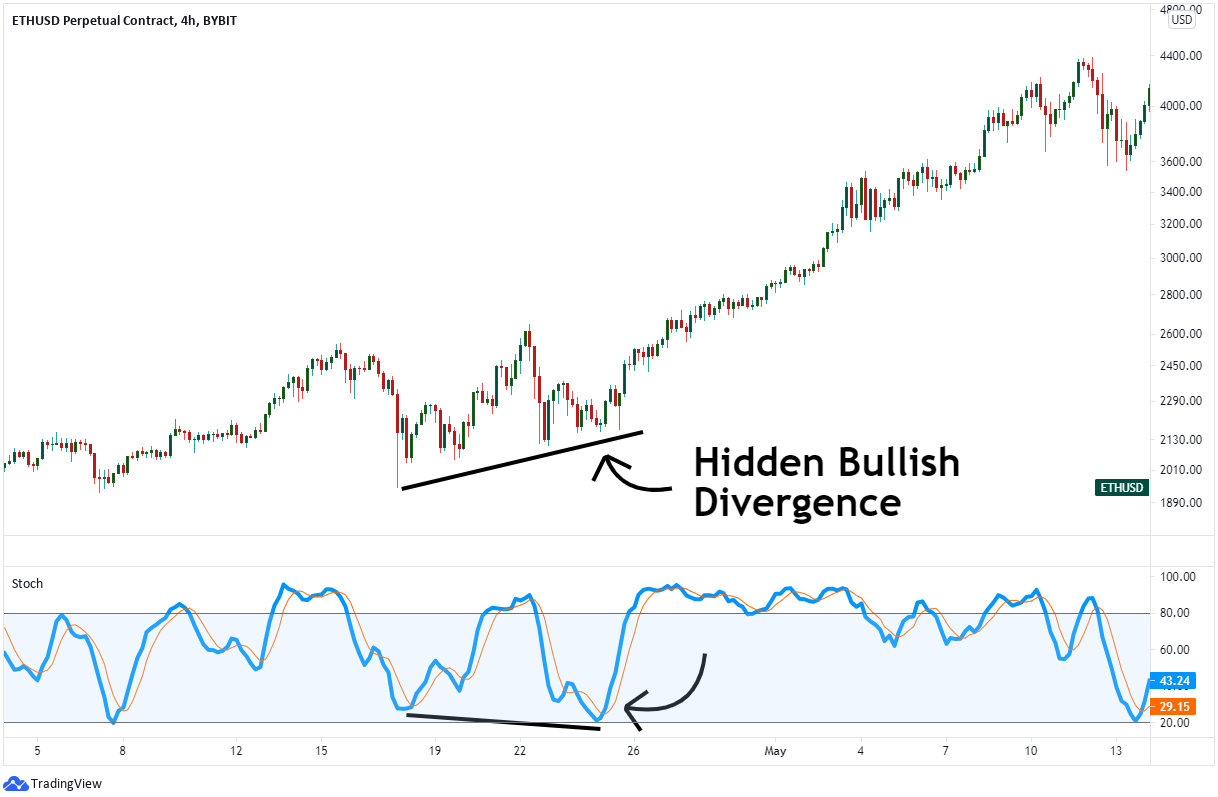
- Hidden Bullish Divergence: This occurs when the price of an asset makes a higher low while the corresponding technical indicator makes a lower low.
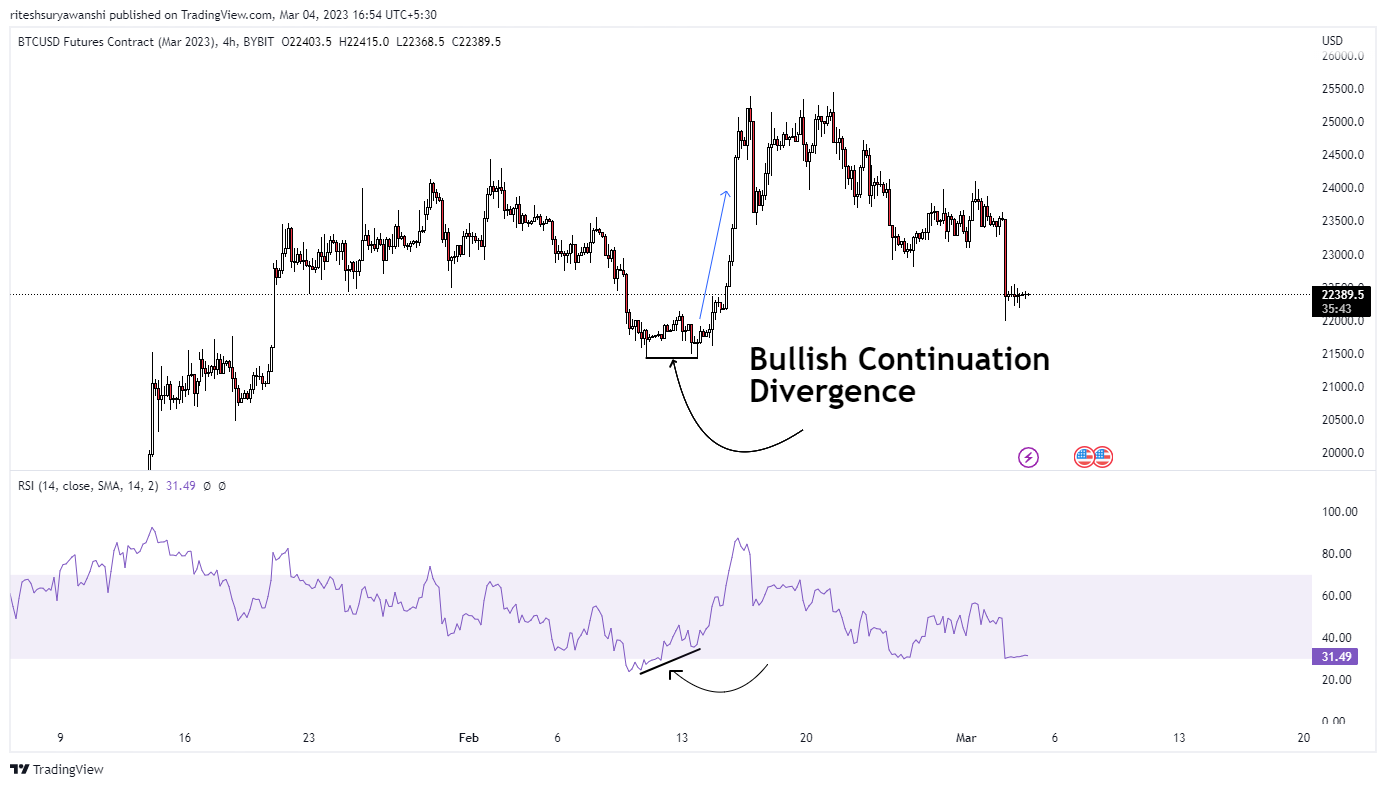
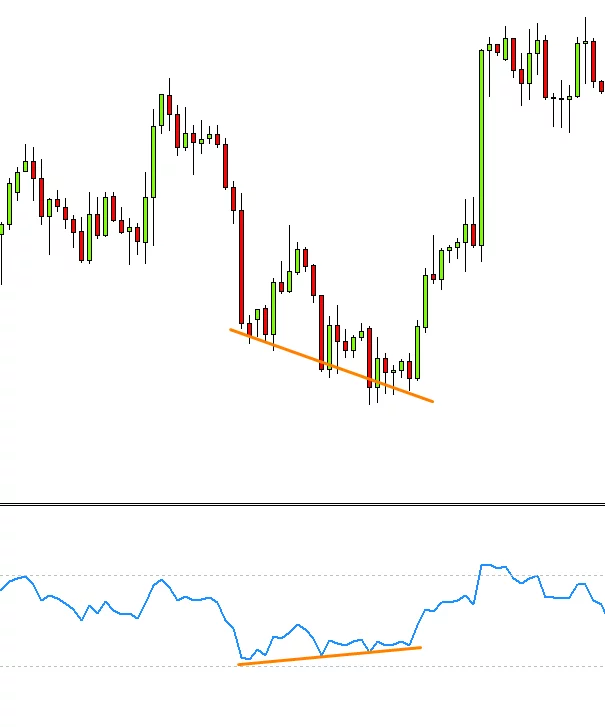
- Bullish Continuation Divergence: This occurs when the price of an asset makes a sideways consolidation while the corresponding technical indicator makes a higher low.
Bearish Divergences
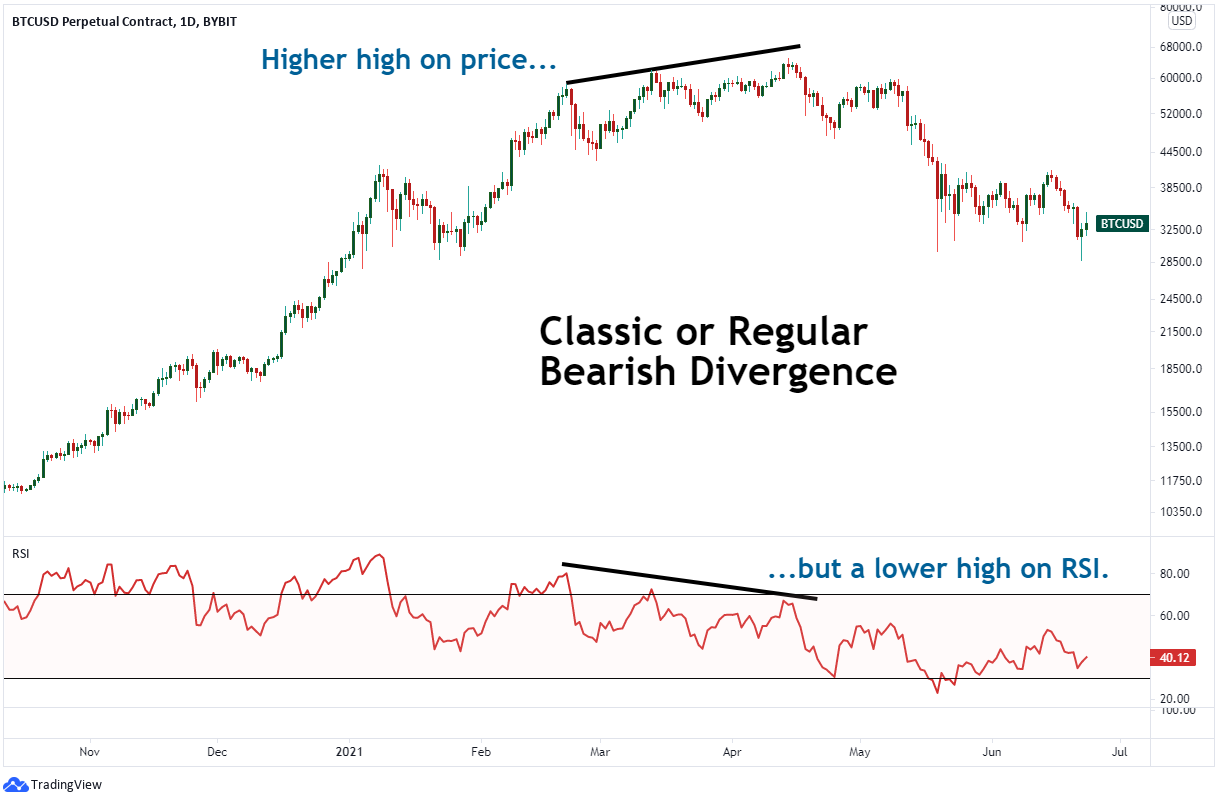
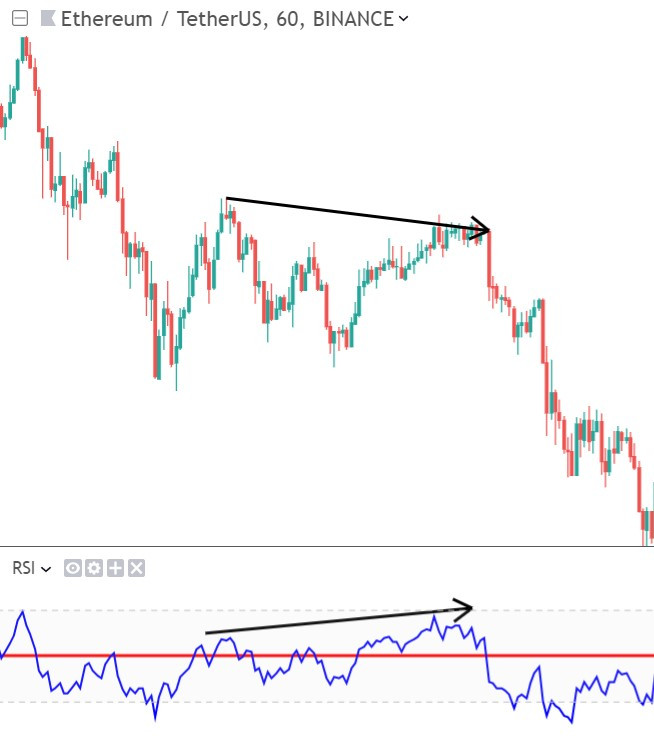
Bearish divergences occur when the price of an asset makes a higher high while the corresponding technical indicator makes a lower high. This suggests that price momentum here is weakening and a bearish reversal may be on the horizon.
There are three main types of bearish divergences:
- Classic Bearish Divergence: Occurs when the price of an asset makes a higher high while the corresponding technical indicator makes a lower high.
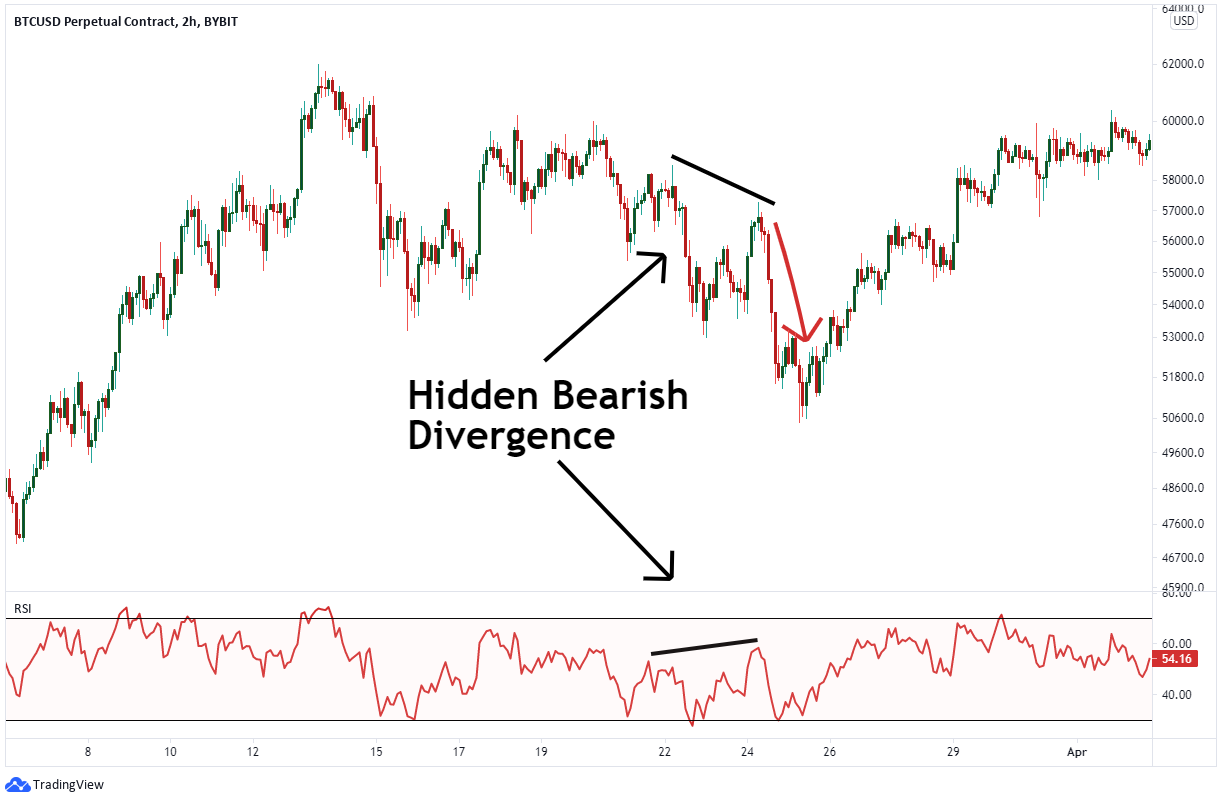
- Hidden Bearish Divergence: Occurs when the price of an asset makes a lower high while the corresponding technical indicator makes a higher high.
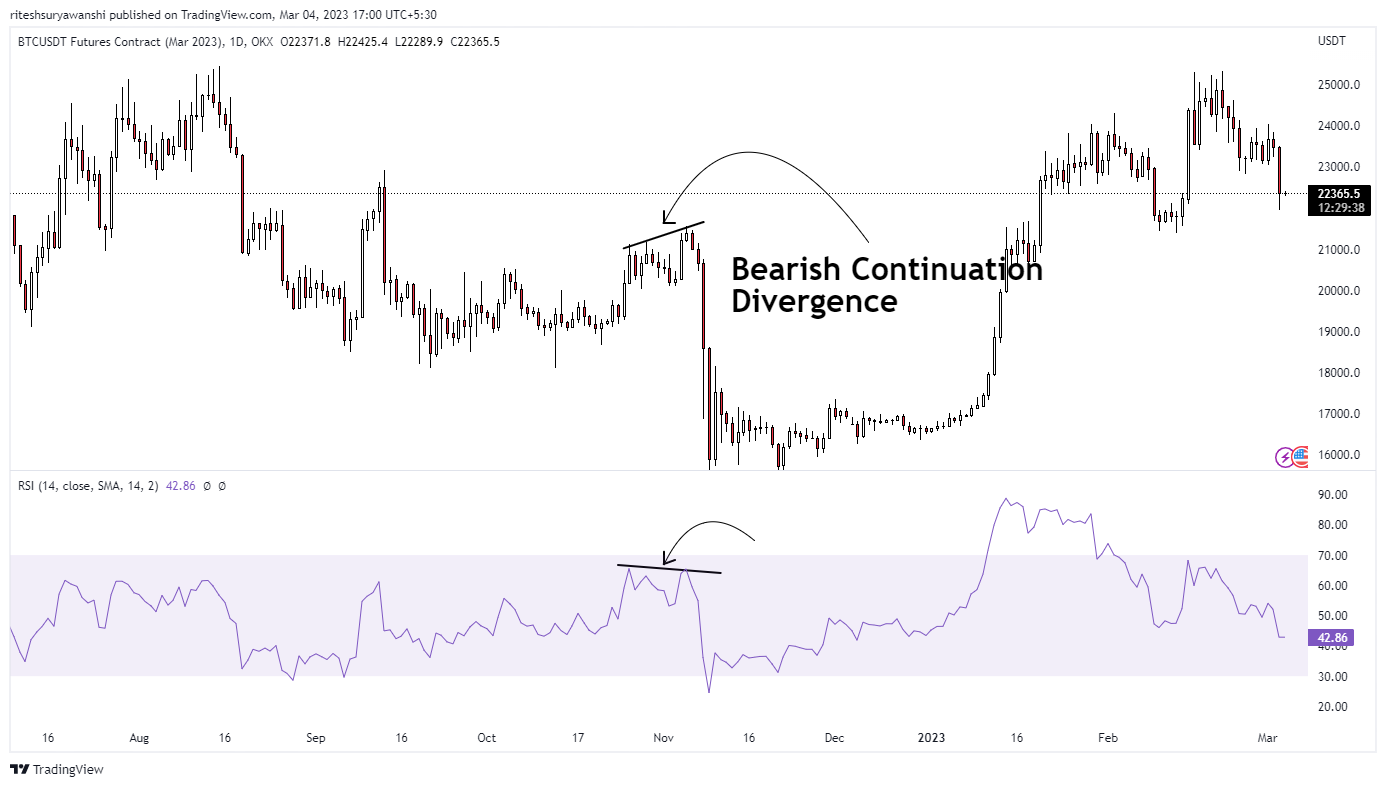
- Bearish Continuation Divergence: This occurs when the price of an asset makes a sideways consolidation while the corresponding technical indicator makes a lower high.
Identifying Divergences
Identifying divergences can be a bit tricky, but there are several key things to look for. First, traders should pay attention to the price action and the corresponding technical indicator.
If the price of an asset is making lower lows while the technical indicator is making higher lows, this is a potential bullish divergence.
If the price of an asset is making higher highs while the technical indicator is making lower highs, this is a potential bearish divergence. It is also important to confirm the divergence with other technical indicators and fundamental analysis.
For example, a bullish divergence may be confirmed by an oversold condition in the RSI or a positive earnings report. Similarly, a bearish divergence may be confirmed by an overbought condition in the RSI or negative news about the company or industry.
Incorporating Divergences into Trading Strategies
Once a divergence has been identified, there are several ways to incorporate it into a trading strategy. Here are a few examples:
Trade the Divergence
One strategy is to enter a trade based on the divergence signal. For example, if a bullish divergence is identified, a trader may enter a long position, anticipating a potential bullish reversal.
Similarly, if a bearish divergence is identified, a trader may enter a short position, anticipating a potential bearish reversal. However, it is important to use the proper risk management and to have a plan in place in case the trade does not go as expected.
Use Divergence as a Confirmation Signal
Another strategy is to use the divergence signal as a confirmation for other technical analysis tools. For example, if a trader identifies a potential trend reversal based on a support level or a trend line, they may use a bullish divergence signal as confirmation to enter a long position.
Similarly, if a trader identifies a potential trend reversal based on a resistance level or a trend line, they may use a bearish divergence signal as confirmation to enter a short position.
Combine Divergence with Other Technical Indicators
Divergence signals can also be combined with other technical indicators to increase the probability of a successful trade.
For example, a trader may use a bullish divergence signal in combination with an oversold condition in the RSI to confirm a potential bullish reversal.
Similarly, a trader may use a bearish divergence signal in combination with an overbought condition in the RSI to confirm a potential bearish reversal.
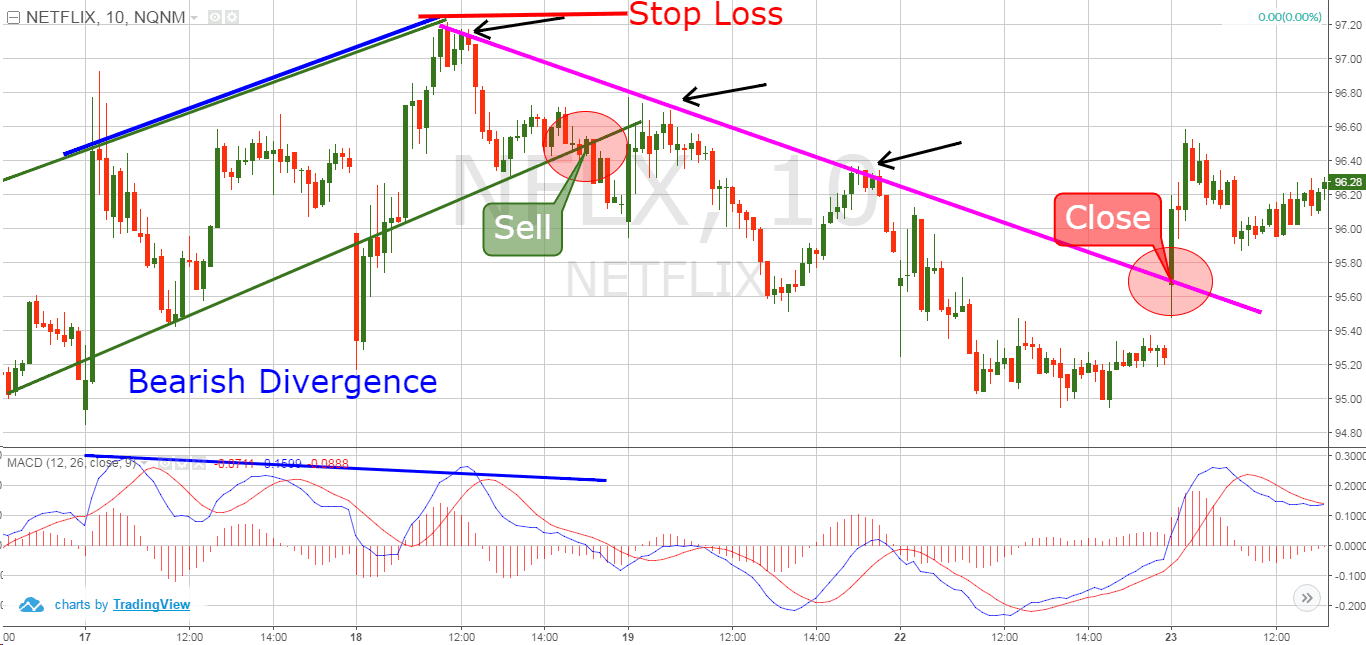
Place Your Stop Loss
If your trade resembles the larger pattern you have seen in the past, then your trading parameters should be determined. Divergence patterns can indicate an imminent trend change but are less reliable if there are timing problems with these patterns.
Therefore, you should be able to breathe in a business atmosphere. If the markets move normally, it will not stop the market from moving.
Immediately after you see any hidden divergencies, put the stop loss at the lower price level of the swings. When the bullish hidden divergence occurs place the stop loss near the high point on the swing when the sell signals show.
Common Mistakes with Divergences
While divergences closing price down can be powerful signals, there are several common mistakes that traders should avoid:
Failing to Confirm the Divergence – It is important to confirm the divergence signal with other technical indicators and fundamental analysis before entering a trade. Failing to do so can result in false signals and losses.
Ignoring the Overall Trend – Divergence signals should be used in the context of the overall trend. For example, if the overall trend is bullish, a bearish divergence signal may not be as reliable as a bullish divergence signal.
Overreliance on Divergence Signals – Divergence signals should be used in conjunction with other technical analysis tools and fundamental analysis. Overreliance on divergence signals alone can result in missed opportunities and losses.
Conclusion
Bullish and bearish divergences are powerful signals that can help traders identify potential reversals in a trend. By understanding the different types of divergences, how to identify them, and how to incorporate them into trading strategies, traders can increase their probability of success.
However, it is important to confirm the divergence signal with other technical indicators and fundamental analysis and to avoid common mistakes such as ignoring the overall trend and overreliance on divergence signals.
As with any trading strategy, proper risk management and having a plan in place are crucial for success.
FAQs
What are the three types of divergence?
Divergence is defined as regular, extended, and hidden. You could use CCI, MACD, Stochastic, and a similar oscillator.
Does bullish divergence always work?
Diverging prices can cause serious reversals, and sometimes prices go straight into sideways consolidation following this diverging trend. A divergent trend does not necessarily mean an overall trend shift.
Which indicator is best for divergence?
Among the most useful indicators of divergence patterns. MACD, RSI/CCI can be used to spot divergences.
What is bullish and bearish divergence in RSI?
A bearish reversal occurs when the RSI generates an overbought reading followed by a lower high, which appears in the uppermost price range. The RSI remained below its lows while the price fell above lower lows.