Hidden divergence is the secret weapon professional traders use to confirm powerful trend continuations, rather than mere reversals. You have likely heard of regular divergence, which signals a possible change in direction, but the essential difference lies here: hidden divergence alerts you when the existing trend is gaining strength. This proven pattern, often spotted using key indicators like RSI hidden divergence, breaks down into two critical setups: the highly sought-after hidden bullish divergence and the equally powerful hidden bearish divergence. Ready to discover the precise entry and exit points that transform good trades into great ones? Understanding the crucial nuances of hidden divergence vs regular divergence is paramount. We will unlock exactly how to spot this critical pattern and execute it flawlessly to maximize your profitability.
What Is Hidden Divergence?
Like regular divergence, the hidden divergence also is categorized as bullish hidden divergence and bearish hidden divergence.
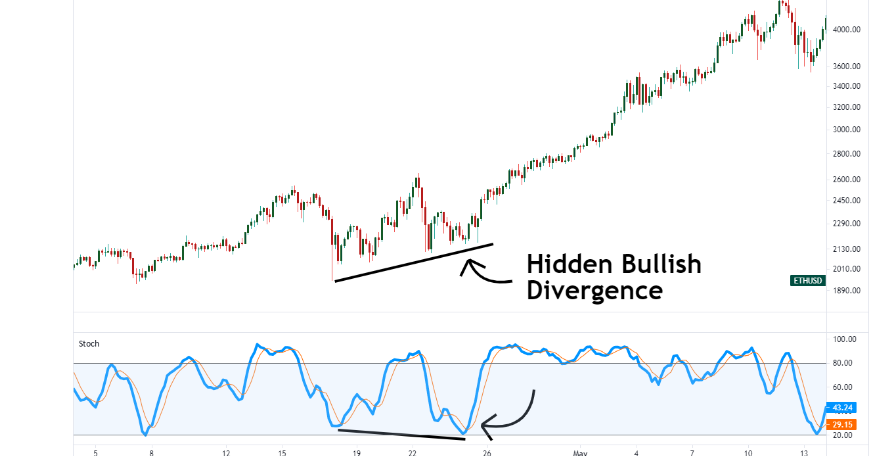
Bullish hidden divergence is formed when the price of a security makes a higher low, while the indicator makes a lower low.
Bullish Hidden Divergence
Bullish divergence happens during a correction of an uptrend when a security price makes a higher low, But the momentum oscillator makes a lower low. This usually indicates the uptrend continuation.
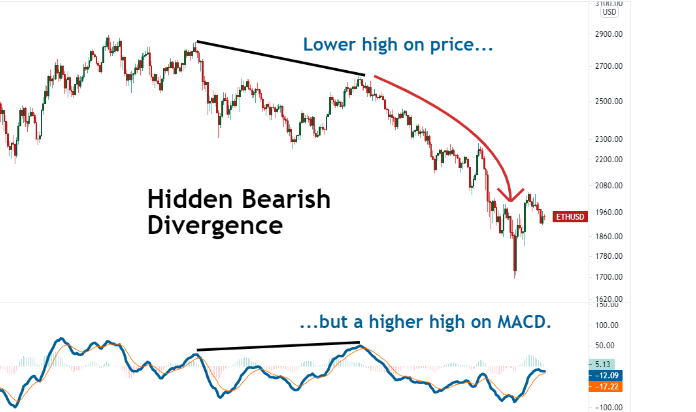
Bearish Hidden Divergence
Bearish hidden divergence is the opposite of bullish hidden divergence. An asset price makes a lower high, but the momentum oscillator makes a higher high. This indicates a downtrend continuation.
How Is Hidden Divergence Different From Regular Divergence?
Hidden divergence is different from regular divergence due to the location of the pattern. While regular divergence occurs at end of the trend and indicates the trend reversal, hidden divergence tends to appear within an existing trend. It signals the end of a consolidation phase within the larger trend. We call it “hidden” because it isn’t obvious to the untrained eye.
Above, we can see a strong uptrend within Bitcoin’s price. There are two instances of bullish hidden divergence in the middle of this uptrend. The first appears on February 4, 2021. The RSI indicator creates a lower low, while Bitcoin’s price creates a higher low. This signals the end of the small consolidation as Bitcoin rallies higher.
Then, between February 10 and February 14, another consolidation occurs. Again, RSI is forming a lower low, while Bitcoin’s price creates a higher low. This hidden RSI divergence signals the end of that small correction and Bitcoin rallies further.
Identifying and Hidden Divergence Trading
To find signs of hidden divergence and the possible continuation of a trend, you first need to make use of a momentum oscillator to identify that a trend is going on. After this, you should look for a trend consolidation period where hidden divergence patterns can appear.
Common indicators for spotting hidden divergences are the Relative Strength Index, the stochastic indicator, and the Moving Average Convergence Divergence. However, you can use almost all momentum oscillators to find hidden divergence.
RSI indicator to identify Hidden RSI Divergences
Here is an example of using RSI for identifying RSI hidden divergence.
MACD indicator to identify Hidden MACD Divergences
Here is an example of hidden MACD divergence identified with MACD.
Stochastic oscillator to identify hidden Stochastic divergence
Here is an example of hidden divergence identified with a stochastic oscillator.
You should remember that divergences should not be traded as a signal, they should be traded as a confirmation of the main signal from other technical indicators.
You should use any trend indicator like the moving average to know the primary trend and get confirmation from divergence to enter a trade.
How Reliable Is Hidden Divergence Strategy?
Although hidden divergence is a powerful pattern indicating a continuation of a market’s movement, it cannot be used in isolation. New traders should focus on regular divergence before incorporating hidden divergence strategy into their trading practices.
Remember that hidden divergence does not always result in a trend continuation. According to one analyst, hidden divergence patterns sometimes are meaningless and cannot predict major price action changes.
By using two or three indicators simultaneously, traders may form a more robust strategy to trade.
Sometimes, when using two or more different indicators, the indicator signals may differ from one another.
In such cases, it’s best to take a step back and examine whether the conflicting signals are obvious and strong. If they are, it’s a good idea to stay away from the asset for a while.
Tips on using the Hidden Divergences
To reduce false signals, hidden divergences should be used on longer timeframes. With longer time frames, the market does not move as fast, and it’s easier to determine the patterns of highs and lows. The drawback is that longer time frames result in fewer trades and fewer divergences.
Can a regular divergence and a hidden divergence occur at the same time?
In shorter time frames, there is a possibility that bearish regular divergence and bullish hidden divergence (or bullish regular divergence and bearish hidden divergence) may appear at the same time. In such cases, if there are no other strong entry signals, a trader should avoid entering the market for a while.
Remember that regular divergence signifies a change in the trend’s direction and should be traded at the end of the trend, while hidden divergence suggests strength coming into the trend and should be traded at the beginning of the trend. When trading divergence, there should be obvious ups or downs on the price chart for an existing trend.
Conclusion
Bullish and bearish hidden divergences are very powerful patterns seen at the end of consolidation. They signal a continuation of the original trend.
These patterns are frequently found within Bitcoin, Ethereum, and other crypto markets, making them easy to learn.
However, spotting them in real time is challenging. Additionally, if hidden divergence is discovered late in the trend, the trade tends to be less rewarding.
The key to success in trading hidden divergence is to filter your trades in the direction of the larger trend.
Pre-Built Backtests
Forget guessing how an indicator might perform; our instant backtesting data gives you the answers.
We’ve done the heavy computational lifting so you can focus on making informed decisions.