

In trading, there are technical tools and indicators that traders use to make informed decisions. One of these is the Percentage Price Oscillator (PPO), which compares a security’s two exponential moving averages to identify key inflection points in price trends and intraday price movement.
PPO calculates the difference between two moving averages as a percentage of the long-term moving average. It is a popular trading instrument, and understanding how it works and how to use it correctly is critical for trading success.
With that in mind, the purpose of this blog post is to offer a thorough explanation of PPO. We will look at what PPO is, how to use it in trading, and its benefits and drawbacks in comparison to other technical analysis indicators. Moreover, we will address typical mistakes traders make while utilizing PPO and offer advice on how to prevent them.
Now, let’s have a look at PPO and see how it can be used to improve trading tactics.
What is Percentage Price Oscillator (PPO)
The Percentage Price Oscillator (PPO) is a momentum indicator that indicates the relationship between long-term and short-term exponential moving averages in percentage values. Usually the EMAs have 12 and 26 periods.
The PPO is used to measure security performance and volatility, identify divergences between price and indicator, generate trade signals, and define trend direction.
Usually, the PPO also contains the signal line. It is a 9-period EMA of the PPO.
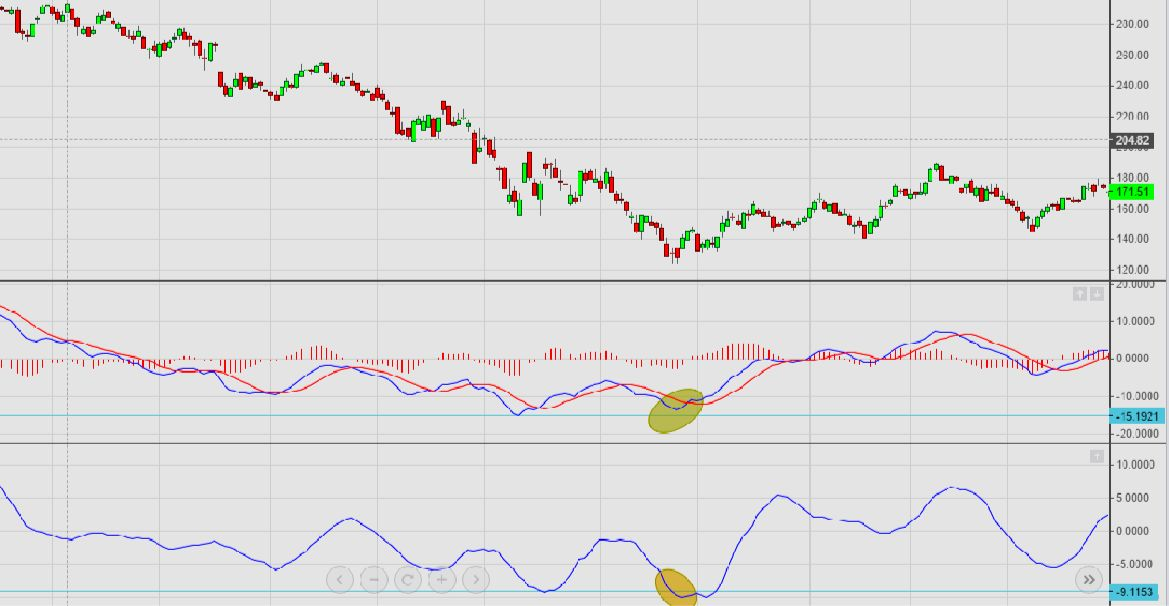
Traders use the PPO line and signal line crossovers as buy and sell signals. When the PPO line crosses the signal to line up, it indicates a buy signal, conversely, when the PPO line crosses the signal line down, it indicates a sell signal. Traders can identify trend direction by using PPO line readings.
When the PPO is positive it indicates a bullish trend, when it is negative, indicates a bearish trend.
The Percentage Price Oscillator Formula
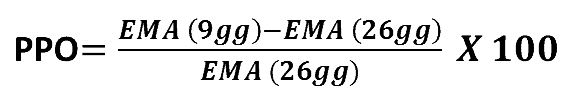
The PPO is the adjusted difference between short-term and long-term EMAs. Here is the formula for PPO:
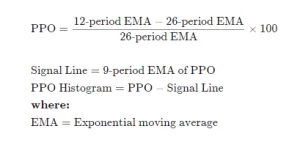
PPO line = 100 * ( 12-period EMA – 26-period EMA ) 26-period EMA
PPO signal line = 9-period EMA of PPO line,
PPO histogram = PPO line – PPO signal line.
How to Calculate PPO?
To begin, compute the 12-period and 26-period Exponential Moving Average (EMA) of the asset’s price.
Then, using these EMA values in the PPO calculation, you may calculate the current PPO value. The difference between the 12-period EMA and the 26-period EMA is divided by the 26-period EMA, then multiplied by 100.
PPO Signal Line
If you have at least nine PPO readings, you can construct the signal line. This entails computing the 9-period EMA of the PPO readings. The signal line smoothes out the PPO data and makes it easier to analyze. Also, signal line and PPO line crossovers generate buy and sell signals.
Histogram
If you want a visual depiction of the difference between the PPO and signal line, you may construct a histogram reading. Just subtract the current signal line value from the current PPO value. A positive histogram indicates that the PPO is above the signal line, while a negative value shows that PPO is below the signal line.
How to Use price percentage oscillator in Trading
PPO may be utilized in a variety of ways to provide buy and sell signals. One method is to search for centerline crossovers. When the PPO line crosses over the zero line, a buy signal is generated. When the PPO line crosses down the zero line, a sell signal is generated.
When the PPO Line crosses over the Signal Line, a bullish signal is generated, signaling a potential purchasing opportunity. When the PPO Line crosses below the Signal Line, a bearish signal is generated, signaling a potential selling opportunity.
Divergence Buy and Sell Signals
Looking for divergences between the PPO Line and the price chart is another approach to using PPO.
If an asset’s price makes lower lows but the PPO line fails to make lower lows, it is a positive or bullish divergence, indicating that the price trend can reverse.
If an asset’s price makes higher highs but the PPO line fails to make higher highs, it is a negative or bearish divergence, indicating that the price trend can reverse.
To confirm and support these divergences, a trader must use other technical indicators in conjunction with the price percent oscillator.
PPO vs. MACD
It works similarly to the Moving Average Convergence Divergence (MACD) indicator, but with a slight difference. The MACD displays the absolute difference, but the PPO displays a relative value since it is adjusted. This normalization enables a simple comparison of various securities with PPO, even when their prices range significantly.
PPO vs. RSI
The Percentage Price Oscillator (PPO) is the percentage difference between two exponential moving averages (EMAs). Meanwhile, the Relative Strength Index (RSI) represents a technical momentum indicator that gauges recent price movements in the market. The RSI’s usage lies in the determination of overbought and oversold conditions, and as a tool to identify divergences between price and indicator. Due to the distinct manner these indicators are calculated and interpreted, they provide varying insights to traders who utilize them.
Common Mistakes When Trading With PPO
While PPO can be a powerful tool for traders, there are some common mistakes that can be made when using this indicator. Avoid these common mistakes:
Using PPO in isolation
As mentioned earlier, PPO should not be used in isolation. It should be used in conjunction with other technical analysis tools and indicators to confirm signals and improve accuracy.
Ignoring the bigger picture
To make better trading decisions, the trader must consider other key aspects, such as economic news, geopolitical events, and the market mood.
Using the wrong parameters
Using the wrong periods can lead to inaccurate signals and false positives. Traders should experiment with different periods to find the optimal parameters for their trading strategy.
Overtrading
Traders must avoid overtrading and only enter trades with high confidence in their signals. Careful assessment of market conditions, using PPO alongside other technical analysis tools, can ensure informed decision-making and maximize returns. While a powerful technical momentum indicator, PPO has limitations, and traders must use it judiciously to achieve the best possible results.
Failing to adjust to changing market conditions
The ever-changing market conditions can make it difficult for traders to consistently rely on what worked for them in the past. Therefore, being agile and adaptable in one’s approach is of paramount importance when it comes to the dynamic and unpredictable world of trading. Price trends change frequently and rapidly, and traders must be ready to adapt their strategies accordingly.
Limitations of PPO
Traders should be aware that PPO generated zero line and signal line crossover signals can be false signals.
For example in the case when price is rising and then consolidates in range, the PPO likely will generate zero line crossover and signal line crossover false signals.
As a result, PPO generated multiple signals without a significant price move will be multiple losing trades.
The PPO indicator is used to identify divergences and the divergence won’t always result in a price reversal.
The indicator calculation is based on historical data and not necessarily indicate what will happen in the future.
Conclusion
The PPO is a technical analysis tool that helps traders identify trend momentum and make informed trading decisions. It measures the difference between two exponential moving averages as a percentage of the long-term moving average, making it useful for short-term trading strategies. Traders should use the Price percent oscillator in conjunction with other technical analysis tools and indicators and avoid common mistakes such as overtrading and using the wrong parameters. Always practice proper risk management and trade responsibly to succeed in trading.


