

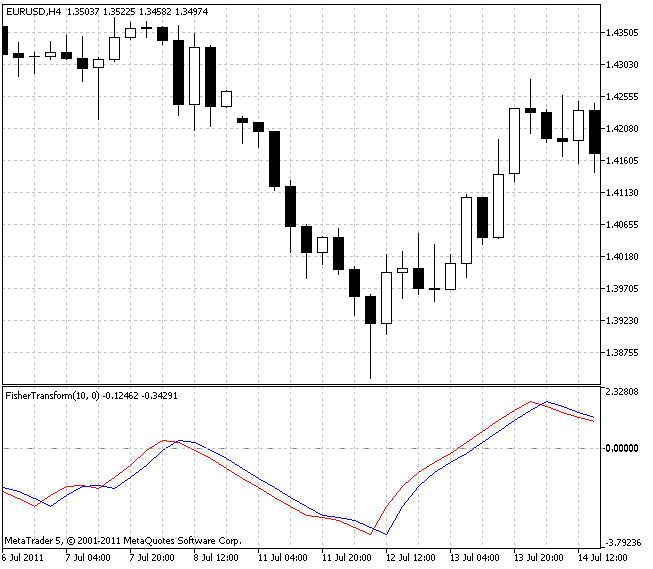
The Fisher Transform Indicator is a technical analysis tool that can help traders identify potential price reversals in financial markets.
This indicator is based on the assumption that the probability distribution of asset prices is not normal and uses a mathematical formula to transform the price data into a more Gaussian-like distribution.
In this blog post, we will explain what the Fisher Transform Indicator is, how it works, and provide a step-by-step guide on how to trade using this indicator.
What is the Fisher Transform Indicator?
The Fisher Transform Indicator was developed by John Ehlers, a well-known technical analyst, and trader. The purpose of this indicator is to transform non-Gaussian data into a Gaussian-like distribution, which makes it easier to identify potential price reversals.
The Fisher Transform Indicator oscillates between -1 and +1, with values below -0.5 indicating oversold conditions, and values above 0.5 indicating overbought conditions.
Despite the complex mathematics, Fisher Transform tends to give clear overbought and oversold signals since the extremes of the indicator are rarely reached.
How does it work?
The Fisher Transform Indicator is based on the assumption that the probability distribution of asset prices is not normal.
This means that the distribution of price data is skewed and has fat tails. The Fisher Transform Indicator uses a mathematical formula to transform the price data into a more Gaussian-like distribution. The formula is as follows:
The Fisher Transform Formula
Fisher Transform = 0.5 * ln((1 + x) / (1 – x))
Where:
x = (price – minimum price)/(maximum price – minimum price)
ln denotes the shorthand form of the natural logarithm.
The Fisher Transform Indicator oscillates between -1 and +1, with values below -0.5 indicating oversold conditions, and values above 0.5 indicating overbought conditions.
How to Trade with the Fisher Transform
Trading using the Fisher Transform Indicator can be a profitable strategy when used correctly. Here are the steps to follow:
Step 1: Identify the trend
The first step in trading using the Fisher Transform Indicator is to identify the trend. The Fisher Transform Indicator can be used to identify both uptrends and downtrends. If the indicator is above 0.5, it indicates an uptrend, and if it is below -0.5, it indicates a downtrend. If the indicator is between -0.5 and 0.5, it indicates a sideways market.
Step 2: Identify potential entry points
Once you have identified the trend, the next step is to identify potential entry points. The Fisher Transform Indicator can be used to identify potential entry points when the indicator crosses the zero line. When the indicator crosses the zero line from below, it is a potential buy signal, and when it crosses the zero line from above, it is a potential sell signal.
Step 3: Confirm the signal
Before entering a trade, it is important to confirm the signal using other technical analysis tools. The Fisher Transform Indicator should not be used in isolation but in combination with other technical analysis tools such as moving averages, trend lines, and support and resistance levels.
Step 4: Place a stop loss
Placing a stop loss is an important risk management technique that helps to limit potential losses. The stop loss should be placed below the previous low for long positions and above the previous high for short positions.
Step 5: Take profit
The take profit level should be based on the risk-reward ratio. The risk-reward ratio is the ratio between the potential profit and the potential loss. A good risk-reward ratio is usually 1:2 or higher.
Trade Examples of the Fisher Transform
Fisher Transform signals can come in the form of touch or breach of a certain level. For those who take this approach, the thinking is that if one waits for evidence that the indicator has peaked, one has likely missed any potential reversal in the price of the asset itself.
What this particular level happens to be will be dependent on the market being traded, the timeframe to which the indicator is applied, and is up to the discretion of the trader.
Or prospective trade signals can come from a reversal in the indicator itself. Instead of abiding by a certain breach of a level, one could simply take a trade after the Fisher Transform changes direction.
Ideally, like all indicators, this signal wouldn’t be traded in isolation, but due to a confluence of supportive factors, such as the alignment of other technical indicators, price and candlestick patterns, and/or fundamental analysis.
We will look at how the indicator would have worked on a daily chart of the S&P 500.
We’ll take trade signals based on the following rules:
Long trades
- Fisher Transform must be negative (i.e., the more negative the indicator is, the more “stretched” or excessively bearish the price is)
- Taken after a reversal of the Fisher Transform from negatively sloped to positively sloped (i.e., rate of change from negative to positive)
Short trades
- Fisher Transform must be positive (i.e., price perceived to be excessively bullish)
- Taken after a reversal in the direction of the Fisher Transform
But as we can see below, if we use the indicator in isolation on this particular market – the S&P 500 mapped onto a daily chart – it doesn’t work that well. Buy (“long”) and sell (“short”) trades are marked between the white vertical lines.
The close of the candle marked by the white line to the left marks the opening of trade while the close of the candle denoted by the white line on the right marks the exit of a trade.
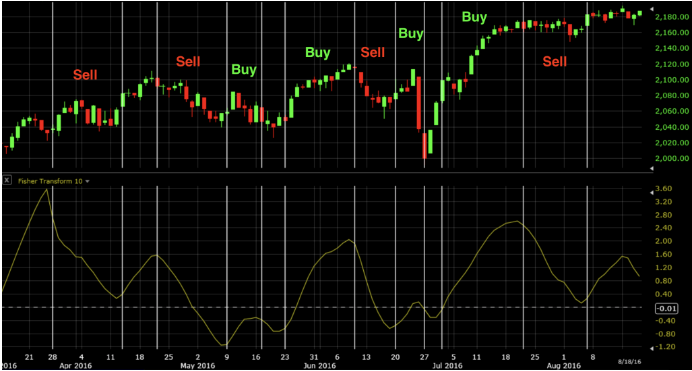
This would have produced four winners and four losers and roughly broken even profit-wise.
If we revise the system to include the rules above but this time take trades only in the direction of the prevailing trend – as dictated by a 50-period moving average – we see greater accuracy.
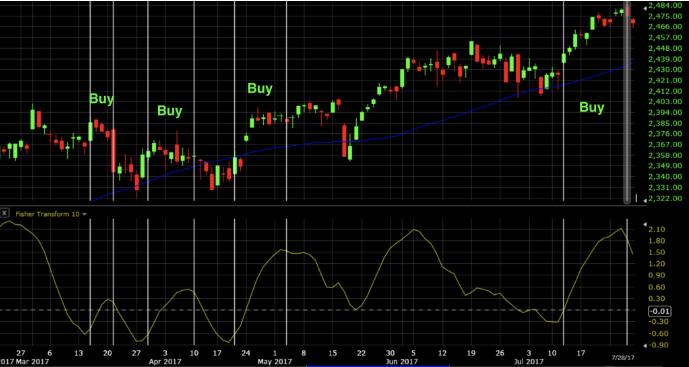
The first trade is a loser. The second roughly breaks even. The third and fourth are winners.
Other indicators can of course be added to the system as the individual trader sees fit.
The Fisher Transform Indicator Trading Applications
The Fisher Transform Indicator is unique in that it transforms price data into a normal distribution that is more sensitive to changes in trend direction.
This can make it easier to identify potential turning points in the market and can provide more accurate trading signals than other traditional technical indicators.
The following are some of the most common trading applications of the Fisher Transform Indicator:
- Identifying overbought and oversold conditions: The Fisher Transform Indicator can be used to identify when a market is overbought or oversold. When the indicator reaches its upper or lower extremes, it can indicate that the market is due for a reversal.
- Generating buy and sell signals: When the Fisher Transform Indicator crosses its signal line, it can generate buy and sell signals. A buy signal is generated when the indicator crosses above its signal line, while a sell signal is generated when it crosses below.
- Identifying trend reversals: The Fisher Transform Indicator can be used to identify potential trend reversals. When the indicator changes direction, it can indicate that the current trend is coming to an end and that a new trend may be beginning.
- Confirmation of other technical indicators: The Fisher Transform Indicator can be used in conjunction with other technical indicators to confirm potential entry and exit points. For example, if the indicator generates a buy signal while a moving average crossover also occurs, it can provide additional confirmation of a potential long entry point.
- Identifying divergence: The Fisher Transform Indicator can be used to identify divergence between the indicator and price action. When the indicator moves in the opposite direction of price action, it can indicate a potential trend reversal.
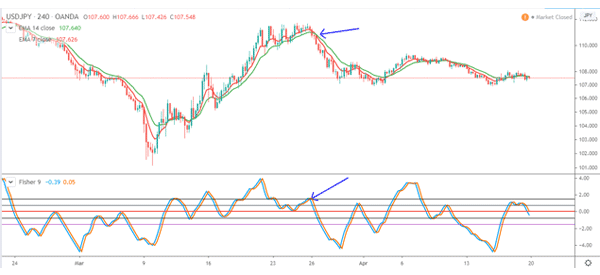
Fisher Transform vs RSI
The Fisher Transform indicator also has a close resemblance to the Relative Strength Index (RSI). The chart below shows the Fisher Transform and the RSI index in a chart.
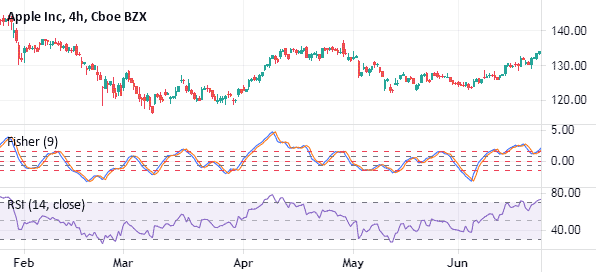
The two indicators are different in how they are calculated. Yet the two indicators are used in a similar way. They can be used to find overbought and oversold levels. Further, they can be used to find divergences and define a trend direction.
Fisher Transform vs Bollinger Bands
The Fisher Transform and Bollinger Bands have very different appearances.
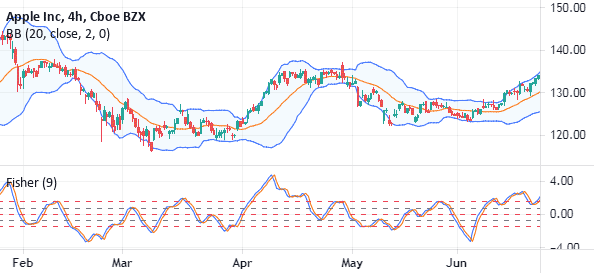
While the Fisher Transform is an oscillator, Bollinger Bands is a trend indicator. The two are also calculated in a different ways since the Bollinger Band is calculated by finding the moving average first and the standard deviations.
The Fisher Transform and Bollinger Bands can be used to complement each other.
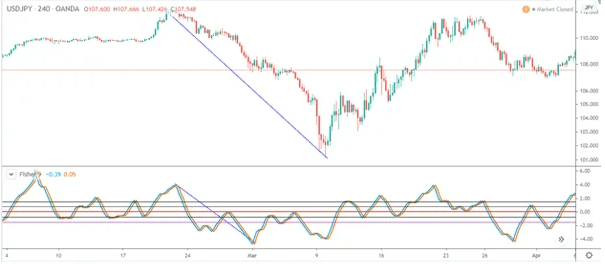
Fisher Transform vs Stochastic
A closer look at the Fisher Transform indicator applied on a chart shows that they have a similar resemblance to the Stochastic oscillator as shown below.
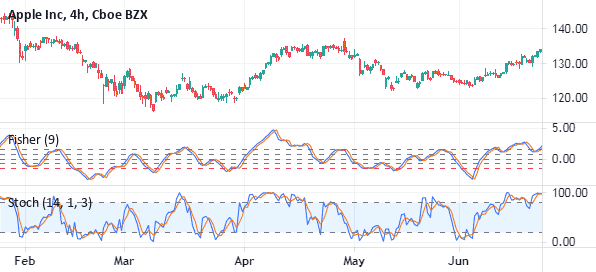
The two indicators have several key differences. The main is how the two are calculated. The calculation of the Stochastic oscillator starts with the calculation of %K and %D.
The %K is calculated by first subtracting the lowest low from the current close. You then minus the lowest low from the highest high. Finally, you divide the two and multiply by 100. The %D is then calculated as the 3-day SMA of %K.
Still, the two indicators are used in the same way. First, you can use the two to identify the oversold and overbought levels. Second, you can use them to follow the trend. The two indicators will mostly rise when the price is rising and fall when the price is falling.
Also, you can use their crossovers to identify buying and selling signals.
Limitations of the Fisher Transform Indicator
The indicator can be rather noisy at times, even though its intent is to make turning points easier to identify. Extreme readings are not always followed by a price reversal; sometimes the price just moves sideways or reverses only a small amount.
Looking at all changes in direction on the Fisher Transform can help spot short-term changes in price direction. However, the signal may come too late to capitalize, as many of these price moves may be short-lived.
Asset prices are not normally distributed, therefore attempts to normalize prices could be inherently flawed and may not produce reliable signals.
Conclusion
In conclusion, the Fisher Transform Indicator is a powerful technical analysis tool that can be used to identify potential price reversals in financial markets.
It has a range of applications, including identifying overbought and oversold conditions, generating buy and sell signals, identifying trend reversals, confirming other technical indicators, and identifying divergence.
Traders who incorporate the Fisher Transform Indicator into their trading strategies may find that it helps them to make more informed trading decisions and improve their overall profitability in the financial markets.


