


The rate of change (ROC) indicator is a momentum indicator frequently used in intraday trading that enables traders to evaluate percentage change in price between periods. It can be used to determine the strength of a trend and identify pivot points as well as divergences. ROC is a leading oscillator whose signals are utilized to corroborate trend change predictions.
In this blog post, we’ll discuss what the rate of change indicator is, its calculations, and how its signals can be used in trading strategies to gain maximal profit.
Rate of Change Indicator – Explained
The rate of change indicator is a technical indicator that belongs to the momentum-based indicator family. Traders and analysts use it in their technical analysis tool belt. ROC calculation compares the percentage change in the current price with the price n periods ago.
To put it simply, the Rate of Change shows us how quickly the price is changing today compared to yesterday, last week, last month, etc.
It can be thought of as a simple velocity indicator.
The Rate of Change (ROC) concept measures two things:
- When changes in momentum take place.
- Strength and weakness of the trend.
These two ideas, when put together, can lead to some excellent reversal trading possibilities.
The rate of change indicator oscillates above and below the zero which is the midpoint level. Negative values usually verify a bearish trend, while positive ROC values usually verify a bullish trend. When the ROC value is near zero, it indicates a flat market.
The indicator can be employed to identify overbought and oversold conditions, centerline crossovers, and divergences.
How to Calculate the ROC Indicator?
The ROC indicator calculates the rate of price change based on the past period. Its formula is as follows:
ROC = [(Closing Price – Closing Price n periods ago) / (Closing Price n periods ago] x 100
Where:
Closing price = The closing price of the most recent period or the last day.
Closing price n periods ago = This refers to the number of periods back to which the present price is being compared.
The default setting for the calculation of ROC is 9 periods, yet 14 and 25 are also commonly used periods.
The 9-period rate of change indicator is more appropriate for short-term trading. When trading stocks for a long time, stock traders must select a longer time frame, such as 50, 100, or even 200 periods for extremely long-term investors.
The multiplier 100 present at the end of the formula is deployed to convert the outcome in percentage terms.
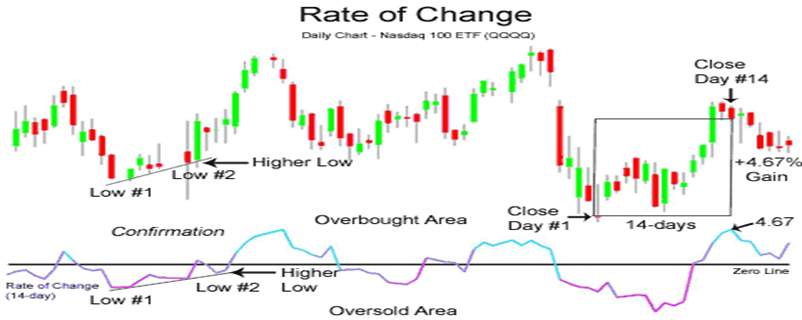
An actual example demonstrates that if the closing price 14 days ago is 85 and today is 100, the ROC= [(100 – 85)/ (85)] x 100 or 17.64. This indicates that the price climbed by 17.64% over the course of 14 days. As can be seen, calculating this momentum indicator is quick and easy.
Interpretation
- ROC indicator moves above or below the zero line (from positive territory to negative territory).
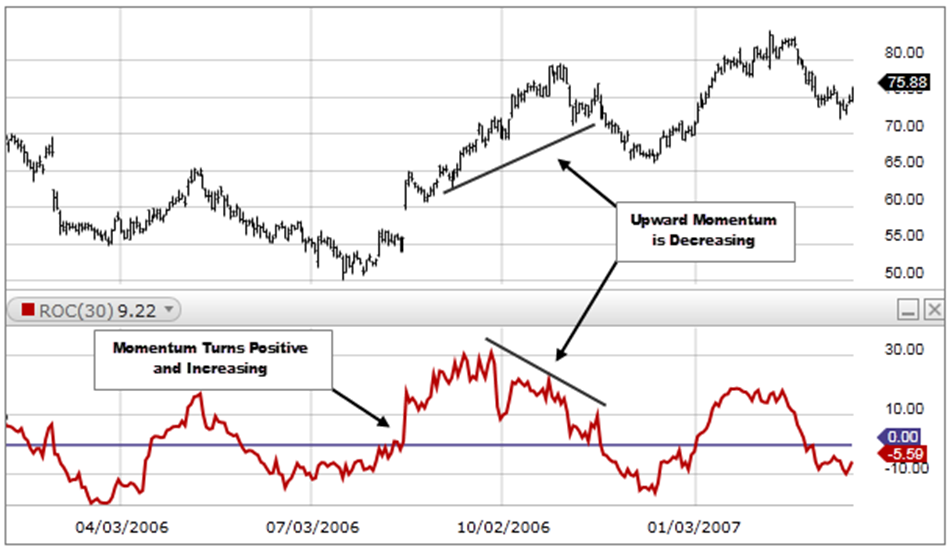
- When the ROC is consistently rising over the zero line, it indicates an uptrend with a sharp price advance.
- When ROC drops and is above the zero line, it signals a steep price decline.
- When the ROC reading is above the zero line, and again starts to increase once more, and crosses the prior highest point, it signals that the uptrend is increasing speedily.
On the contrary:
- When the ROC reading is below the zero line and continues to descend, it reflects that the downtrend is gaining momentum.
- When the ROC starts to ascend and is below the zero line, it indicates that the downtrend is slowing.
- When the ROC is below the zero line and starts to descend again, it signals that the downtrend is once more gaining momentum.
How to Use Rate of Change (ROC) Indicator in Trading – ROC Indicator Strategy
The price rate of change indicator tracks the rate at which price changes and has a peculiar nature that suits traders in carrying out four separate uses in technical analysis and trading:
- Tracking market divergence in a price chart
- An early signal for a trend change with Centerlines Crossovers
- Identifying overbought and oversold levels
- Carrying out breakout trading
Divergences
No matter what name they go by, all oscillators exhibit divergence. Whether you use the Stochastics, Relative Strength Index (RSI), or the Price Rate of Change, the fundamentals of divergence are the same.
Divergence occurs when a security’s price goes in one direction, but the momentum-based technical indicator (ROC) goes in the opposite direction. This suggests that a shift in trend may be imminent and that the current trend could be losing momentum. It is crucial to search for more signals or to analyze price action along with other indicators in order to corroborate this signal.
With this information, traders can use the price rate of change and search for price divergence.
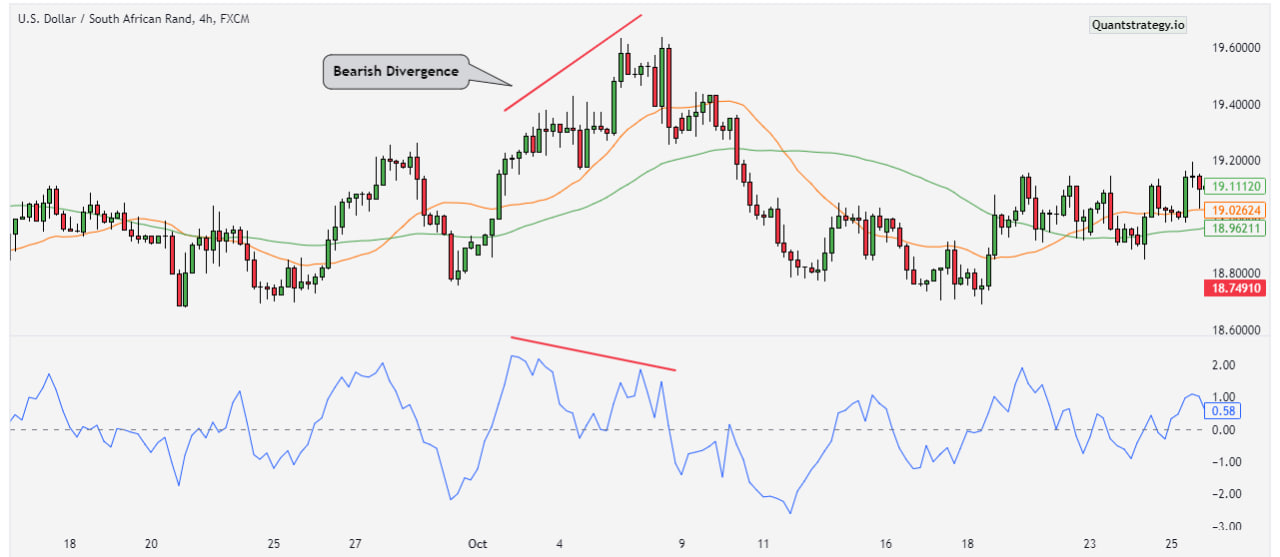
We can observe a divergence instance forming in the example above. In this case, the price made a higher high while the ROC oscillator made a lower high.
This divergence, often known as a bearish divergence, has two applications. After observing this occurrence, a trader can open short positions on the market or wait for the price correction to be finished before entering long positions into the trend.
Hidden bearish or bullish divergences are another type of divergence that can imply the continuation of a trend and are stronger than other types of divergence.
An Early Signal for Trend Changes with Centerlines Crossovers
On a ROC chart, a zero-line cross might be interpreted as a potential sign that the market’s direction is about to change. A bull market may begin if the line crosses from below the zero line, which may indicate that prices are about to rise. On the other hand, if the line crosses from above the zero line, it can mean that prices are falling and that a bear market is about to start.
It is crucial to consider the market volatility and the time frame of the chart in order to ensure that any signals generated by the zero-line cross are accurate.
Overbought and Oversold Levels
The ROC indicator is also used by traders to determine overbought and oversold conditions.
- When the rate of change moves from below a level into the oversold region and back above that level, a buy signal is generated.
- A sell signal is generated when the ROC drops below the threshold after rising above it and entering the overbought region.
This method performs effectively in non-trending markets, but traders frequently receive false signals during big trends, as illustrated in the image below.
Breakout Trading with the Rate of Change Indicator
The ROC indicator and other momentum oscillators excel at trading ranges and breakouts. There are unsuccessful breakouts, as is well known, and it is at this point that a momentum oscillator, like the ROC indicator, might be useful.
Depending on the parameters for the ROC oscillator, one can use either the daily chart or an intraday chart to trade breakouts. Finding the right balance is necessary to prevent the look-back time from being either too choppy or too smooth.
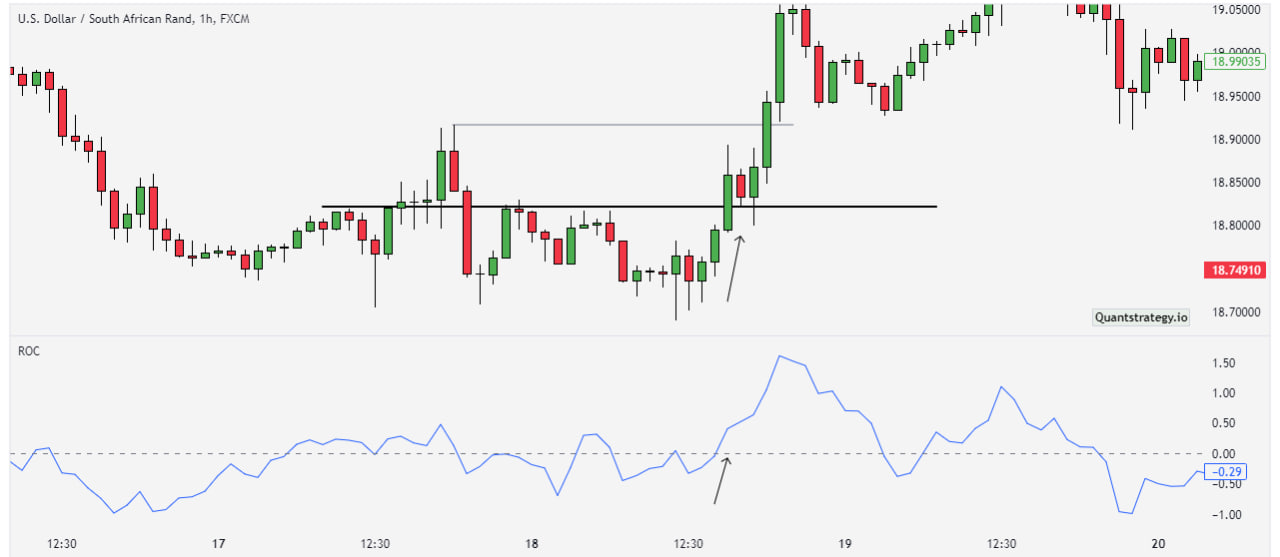
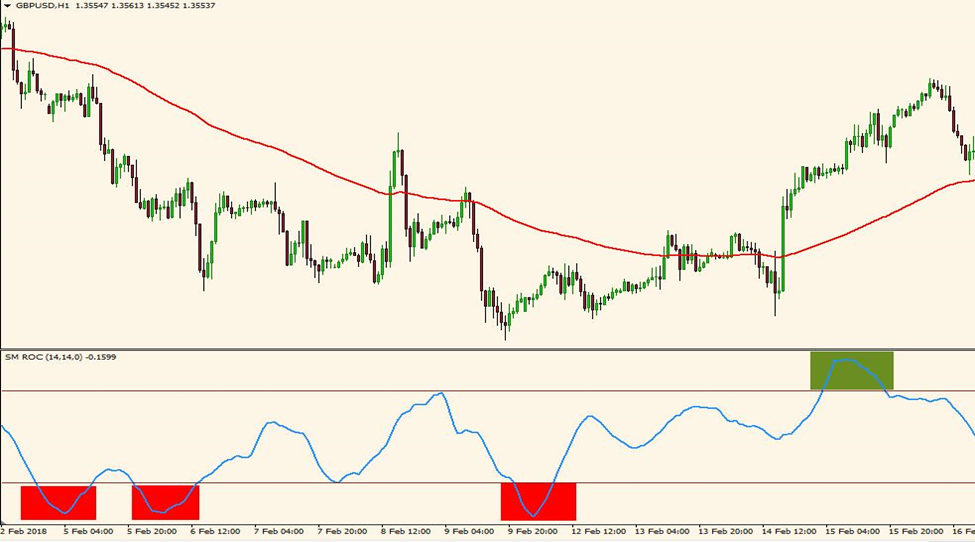
In the aforementioned illustration, we can see how the price managed to stay inside a range of 18.8 and 18.6 for a1-hour period. In order to capture the momentum easily, we are employing a 5-period look back from the ROC in this case.
The goal of using the 5-period ROC setup is to identify the breakout and enter a trade to make a few dollars.
The ROC indicated that the price was above the zero-line once it forcefully broke out above the $29.58 resistance level or the upper range. The breakout appears to be continuing since the trajectory is also ascending higher.
When using this bullish breakout candlestick, traders can simply go long after the close and place their stop-loss orders at the low or the open. The trader is free to set profits between $2 and $5 or a risk-to-reward ratio of 1:2 or 1:3.
The methods shown above are only a few of the various ways to trade with the ROC indicator. Beyond those mentioned above, there are undoubtedly other ways to use the ROC.
Advantages of the ROC Indicator
- Ease of use: Traders of all experience levels can use the ROC indicator because it is simple to compute and comprehend.
- Flexibility: The ROC is adaptable to several timeframes and markets, including stocks, currencies, and commodities.
- Timeliness: By giving traders timely warnings of prospective trend reversals, the ROC enables them to take advantage of market changes.
Disadvantages of the ROC Indicator
- False signals: The ROC occasionally produces multiple false signals that could result in losses, particularly in choppy or range-bound markets.
- Lagging nature: Being a momentum indicator, the ROC might lag behind actual price movements, preventing traders from seeing the best entry or exit positions.
- Reliance on other tools: The ROC is most reliable and useful when used in conjunction with other fundamental and technical analysis tools.
Conclusion
The ROC indicator evaluates the percentage change in price concerning the time period. An upward direction of the rate of change reflects the sharp price move, while the downward plunge in ROC signals a price decline. Besides measuring the speed of price changes, traders use it for assessing market conditions and identifying divergences and overbought and oversold levels. However, it is advised not to use it as a standalone indicator. It’s best used in combination with other technical indicators to help you manage your trading strategy.


