


Analysts and traders rely on or investigate different technical indicators to use the market to their advantage. The McClellan Oscillator is one such momentum indicator that traders can use to understand the market breadth and spot potential trading possibilities based on the distinction between advancing and declining stocks. By validating price patterns, spotting divergences, and verifying trends, traders can enhance their trading outcomes and potentially boost profitability.
In this article, we shall take you through McClellan Oscillator in detail and how it can be used to identify market trends to improve future results and gain more profit.
Understanding the McClellan Oscillator
The McClellan Oscillator is a market breadth indicator that takes into account the distinction between advancing and declining issues on a stock exchange. It’s also a technical analysis indicator that demonstrates significant shifts in market sentiments (breadth thrusts) of several underlying security prices.
The oscillator can be used in several stock exchanges, including the New York Stock Exchange (NYSE), the London Stock Exchange, NASDAQ, and the Deutsche Boerse. The indicator can assist you in determining which sectors are most impacted by an increase in equity prices on various stock exchanges. This information is important for evaluating the strength of price trends in the stock markets. Traders frequently use it for short-term and intermediate-term trading.
The McClellan Oscillator was developed by Sherman and Marian McClellan in 1969 for use with the NYSE and is currently maintained by their son Tom. The McClellans were also credited with creating other technical analysis indicators, including the McClellan Volume Oscillator and McClellan Summation Index.

Using the McClellan Oscillator
It’s crucial to understand that the McClellan Oscillator is determined by all stocks in a particular index, as opposed to other oscillators, which are determined by a single stock. As a result, it’s frequently employed in comparison to other well-known indexes like the S&P 500 or a certain stock market index.
Although many market variables may be studied using the McClellan Oscillator, most analysts concentrate on three main areas:
Momentum
The McClellan Oscillator considers the aggregate value of all stocks on an exchange and consists of two major readings- positive and negative values. The 39-day exponential moving average and the 19-day exponential moving average make up the oscillator. When the 19-day EMA is higher than the 39-day EMA, the oscillator is considered to be in positive territory. On the other hand, If the 19-day EMA is trading below the 39-day EMA, we would consider that the oscillator is in negative territory and shows a negative reading.
As a general rule, when the oscillator is positive and has been rising, this is a sign of more money coming into the market. When the oscillator is negative and has been trending lower, this indicates that more money is leaving the market.
Trend Reversal
Regardless of its value being positive or negative, the McClellan Oscillator displays the index’s current trend. When the oscillator changes from positive to negative or from negative to positive, it signals a possible reversal of the trend. When stock prices and the McClellan Oscillator diverge, it means that the present trend is not strong. For instance, when the McClellan Oscillator increases as the index decreases, it suggests that the current trend may soon change as equities start to be bought. Similarly, when stock prices increase while the McClellan Oscillator decreases, it suggests that prices are set to decline. In other words, the market may start recovering when the oscillator crosses over the zero line from below. Conversely, if the oscillator descends from above the zero line, it can indicate that the market is about to fall.

Overbought/ Oversold
It also functions as an overbought indicator if it pushes over +100 or below -100, respectively.
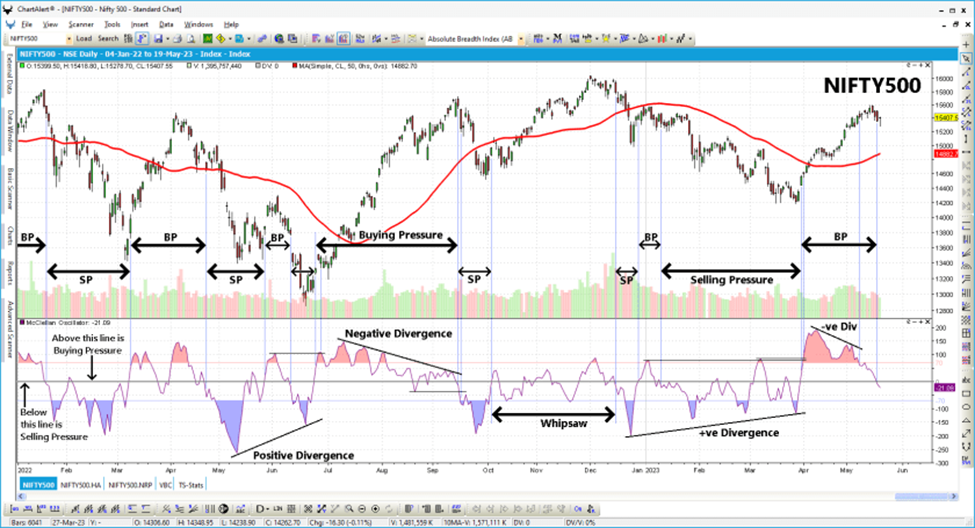
The McClellan Oscillator is applied to the NASDAQ stock prices for Amazon Inc. in the figure below. The oversold level is shown in red, while the overbought level is shown in green towards the bottom of the illustration. The variation displayed here ranges from 80 to -120.

How the McClellan Oscillator is Calculated?
The McClellan Oscillator is an essential indicator for identifying shifts in market sentiments. However, if a trader is unfamiliar with the calculations behind an indicator, they are likely to make mistakes and misread signals. Fortunately, the calculation of the McClellan Oscillator is easier than most traders think.
The steps taken to calculate the McClellan Oscillator are as follows:
- Step 1 – Measure the advances and declines for the periods of 19 and 39 days on a stock exchange.
McClellan Oscillator = (19-day EMA of Advances-Declines) – (39-day EMA of Advances- Declines)
Where EMA indicates exponential moving average. 19-day EMA is a 19-day period exponential moving average. The 39-day EMA is a 39-day exponential moving average.
- Step 2 – Calculate the value of the McClellan Oscillator by inserting the EMA values into the equation.
The same steps are followed when utilizing the ratio-adjusted method, but Ratio Adjusted Net Advances (RANA) is utilized in place of Advances – Declines.
RANA Formula:
RANA = (Advances – Declines)
(Advances + Declines)
How to Use the McClellan Oscillator: Sherman & Marian’s Recommendations
The McClellan Oscillator, developed by Sherman and Marian McClellan, is a flexible instrument that traders can use as both a trend-following and a countertrend indicator. The McClellans have some advice for traders on how to use this market breadth indicator effectively in trading.
- Traders can use the McClellan Oscillator to determine the strength and direction of the current trend to follow it. An uptrend is indicated when the oscillator is above zero, and traders may search for buying opportunities. In contrast, a reading below zero of the oscillator denotes a downtrend, and traders may choose to search for selling opportunities.
- Traders might watch for extremely high or low values in the indicator to spot countertrend opportunities. These levels can indicate that the market is either overbought or oversold and is possibly due for a reversal. Once these high levels are achieved, traders may then think about going against the current trend.
- Traders can use the oscillator with other technical analysis tools, including chart patterns and moving averages, to confirm signals and identify prospective trading opportunities. For instance, if a bullish chart pattern develops and the oscillator also exhibits bullish momentum, it can offer more support for a long position.
McClellan Oscillator & McClellan Summation Index
The McClellans created the McClellan Summation Index in the 1960s, which is also a technical analysis tool like the McClellan Oscillator.
While the Oscillator provides traders with a visual depiction of the strength and direction of the market trends in the short term, the Summation Index can be thought of as the longer-term counterpart of the oscillator, calculated as a running sum of its values. It is a cumulative measure of the McClellan Oscillator’s prior daily values.
It is calculated by adding the previous day’s summation Index with the McClellan Oscillator for the current day. Since it evaluates the oscillator cumulatively, it is thought to be more useful for studying extended periods.
The McClellan Summation Index is frequently employed in conjunction with the Oscillator to give additional verification of a trend or reversal.

The McClellan Financial Publications contain definitions and explanations of the McClellan Oscillator and Summation Index.
Conclusion
The McClellan Oscillator is one of the most extensively utilized breadth indicators, mainly because it enables traders to compare several equities on a stock exchange more effectively. It demonstrates a relationship with stock market movements, giving another way to measure market trends instead of merely looking at the index prices.
The oscillator generates numerous signals in a short time. There are certain drawbacks to employing the McClellan oscillator, though. Some of the signals can be fake and can lead to significant losses. The most effective technique to correct a false signal is to use the oscillator in conjunction with other indicators and price graph analysis. Moreover, the McClellan oscillator’s findings must be confirmed by using additional indicators.


