


Trading is simple; the challenge lies in consistently profitable trades. Since the dawn of time, traders have endeavored to develop a method that would enable them to raise their profit rates while lowering their risk. The Supertrend indicator is one such technical indicator that enables you to do so through its effective day trading strategies.
Developed by Olivier Seban, this tool helps investors identify trends and spot trades (buy and sell signals) with precision through audible alerts and color changes.
Supertrend indicator works for all markets, including futures, forex, or equities, and works at all time frames.
In this article, we shall take a closer look at the Supertrend indicator, explain its signals, and some Supertrend strategies for profitable intraday trading.
What is Supertrend Indicator?
The supertrend indicator is a technical analysis tool created by Olivier Seban. Traders use Supertrend indicator to recognize market trends and possible entry and exit points in trading. It is a trend-following indicator (lagging indicator) that produces a buy or sell signal after a reversal or trend has begun. The supertrend indicator incorporates the concept of a price volatility metric called Average True Range (ATR) and is based on two dynamic numbers, period and multiplier, to determine market volatility. It generates buy and sell signals by plotting a single line on the price chart.
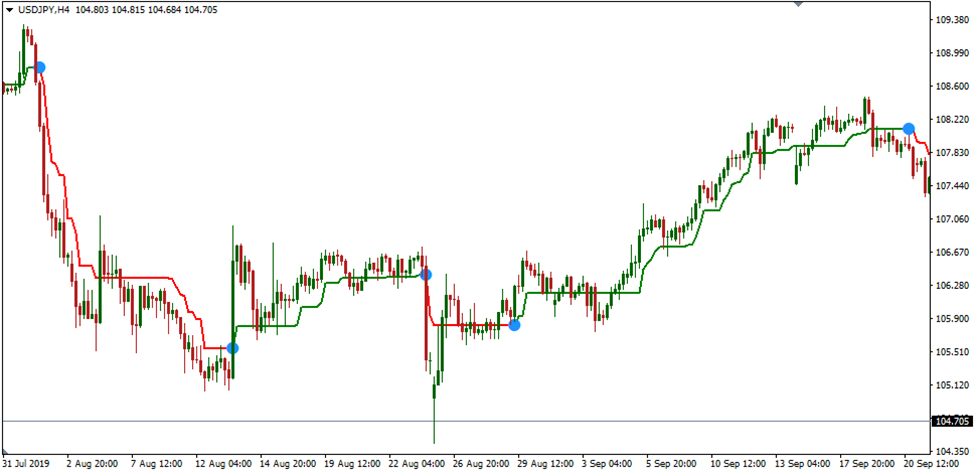
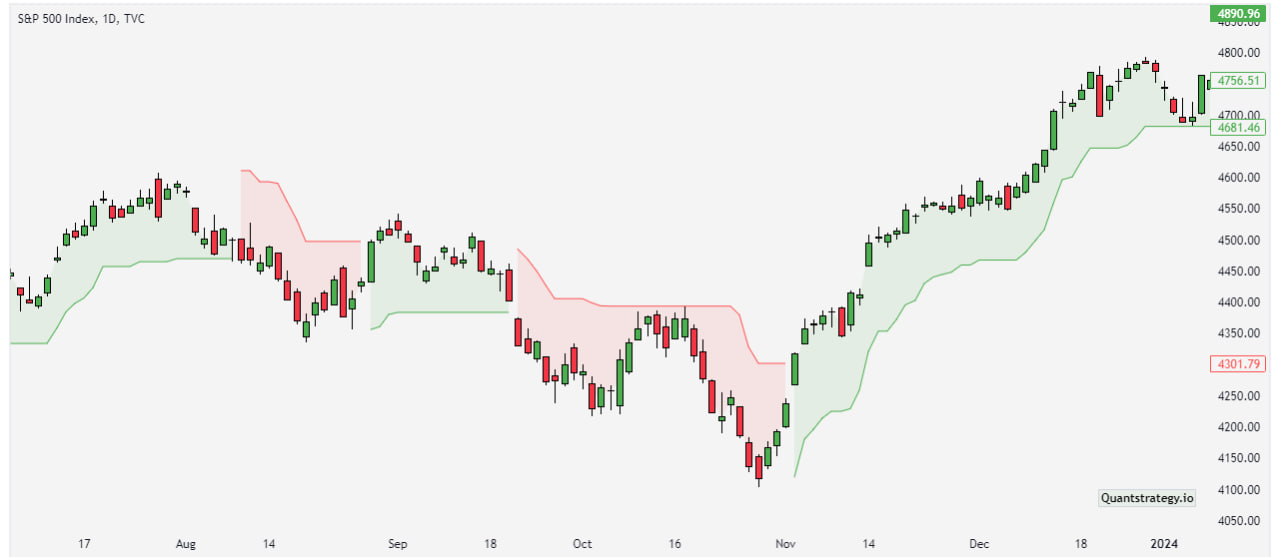
This line denotes the trend direction. The green indicator line occurs when the price is above the Supertrend line and indicates a bullish trend, whereas the red indicator line occurs when the price is below the Supertrend line and indicates a bearish trend.
While Supertrend signals are effective in trending markets, they may not be reliable when the market is trading in a range, meaning it’s best to get additional confirmation before thinking about entering. The indicator works similarly to moving averages or the MACD (moving average convergence divergence).
The parameters of the indicator can be changed by traders to suit their preferences and trading philosophies. It’s a great option for traders of all skill levels because of its simplicity and versatility.
How does a Supertrend Indicator Work?
Traders utilize technical indicators to enter or exit trades based on their profitability. The Supertrend is one of the key indicators that an intraday trader uses to execute entry and exit decisions with exceptional accuracy. It shows the price movement in a trending market. Besides, it is indicated with a red line when prices are falling. When prices increase, the indicator is shown in green.
This indicator is based on the wave principle and displays the movement of prices in a market that is traveling down a specific route. It relies on two parameters: period and multiplier. Further, it also depends on the Average True Range, which is another technical indicator important for measuring the value of market volatility. Investors can easily determine buying and selling signals for a particular stock by monitoring supertrend indicators.
As mentioned above, the supertrend indicators are characterized by green and red lines. A buy signal occurs with the indication of a green line, while a sell signal occurs with the indication of a red line. Thus, intraday traders can easily identify support and resistance levels that have the potential to be broken, as well as gains that may be achieved by buying at support levels and selling at resistance levels.
Any trader can benefit from Supertrend because it can be employed in daily, hourly, or weekly charts. It functions effectively in trending markets but frequently generates false signals when the market moves sideways. Because of this, traders combine it with other indicators like the RSI, MACD, Parabolic SAR, etc.
Supertrend Indicator Formula
The supertrend indicator formula is:
Upper Supertrend Line = (High + Low)/ 2 + (Multiplier x ATR)
Lower Supertrend Line = (High + Low) / 2 – (Multiplier x ATR),
where
High is the highest price for n days
Low is the lowest price for n days
Multiplier is the constant number, usually 3
ATR is the n days average true range.
How to Calculate Supertrend Indicator
Supertrend indicator calculation can be done with these steps:
Calculate the middle price of High and Low prices for given n periods.
- Calculate the average true range and multiply with a multiplier.
- To obtain the indicator upper line add the value from step 2 from midle price for n days.
- To obtain an indicator lower line subtracts the value from step 2 from midle price for n days.
The supertrend technical analysis indicator uses 3 and 10 as default values for the multiplier and ATR values. There are no single optimum criteria because you will likely be working with many different assets.
A longer ATR will smooth out values, while a shorter ATR will emphasize recent price action. But changing this value will not have as much influence on the Supertrend as the multiplier.
Traders can alter the sensitivity of the Supertrend by adjusting the multiplier up or down. A lower multiplier raises the number of false signals and overall signals while enabling a tighter stop loss. On the other hand, a higher multiplier will produce fewer false signals and entries, often at the expense of a wider stop.
Supertrend Trading Strategy – How to Use Supertrend Indicator?
The key challenge for intraday traders is to comprehend and recognize buy and sell profitable signals. The supertrend indicator depicts both uptrends and downtrends. The flipping of the Supertrend over the closing price demonstrates a signal for a particular stock. The green color indicates a buy signal, whereas the red color indicates a sell signal. When it closes higher than the price, a sell signal is generated. The crossover point is the point where the indicator changes color.
For instance, when the prices are dribbling in the direction of the Supertrend and the green color depicts a buy signal, traders can enter a long position at this point, which also serves as a support level. Similarly, price points, which are touching or nearing the indicator, serve as levels of resistance when the indicator is red and denotes a sell signal.
Supertrend indicator strategy offers support and resistance levels to traders for entering and exiting trades profitably. In addition, it offers the signals required for placing stop losses.
You can put the stop loss below the green line if you have gone long. To take a short position, on the other hand, you can hang on until the prices fall below the red line level.
Position holders and swing traders can deploy longer timeframes. The smallest timeframe that can be used is a 1-minute chart. The indicator may also be used across multiple timeframes; you can position it on a larger timeframe and then move it down to a lower timeframe to use it for an entry and exit signal.
Supertrend Indicator – Pros & Cons
Like other indicators, the supertrend indicator has its own set of pros and cons.
Pros
- It provides one of the most accurate signals at specific periods.
- It is available on various trading platforms, which enhances its accessibility.
- It helps intraday traders to make accurate and fast decisions.
- It is easy to use and can be used in any timeframe.
- Other indicators may be used in conjunction with it.
- With the help of this indicator, traders can easily discover profitable buy and sell opportunities for securities and maintain long-term participation in a trending market.
Cons
- It is prone to generating wrong signals. This means it can’t be followed blindly, and it is necessary to have another way to get filtered signals.
- ATR and multiplier are only the two parameters used in its analysis. Hence, it may be insufficient for a trader to employ it to predict market trends under various circumstances with precision.
- Not all circumstances call for the usage of this trending indicator. It performs best in a trending market. Thus, only short-term technical analysis benefits from it.
Conclusion
The supertrend indicator is an easy-to-understand and simple technical analysis tool that requires little technical expertise to use effectively. It helps intraday traders identify market trends and make profitable entry and exit into trading options. It is a great choice for traders of all skill levels because of its simplicity and versatility. However, using multiple indicators and techniques will help minimize the chances of false signals and manage risk effectively. Traders can enhance their overall performance and experience more consistent gains by adjusting the indicator’s parameters and incorporating it into a comprehensive trading strategy.


