


Technical analysis is a trading strategy used to assess investments and find short-term or long-term trading opportunities by examining price movement and volume charts with the help of specific indicators. One of these technical indicators is the piercing line pattern that provides critical market signals to traders.
It forms at the bottom of a downward trend and suggests that the current trend may change. This enables traders to spot new price trends and identify buying opportunities.
In this article, we’ll discuss the piercing line candlestick pattern in detail as well as how to interpret it for profitable trades.
What is Piercing Line Candlestick Pattern?
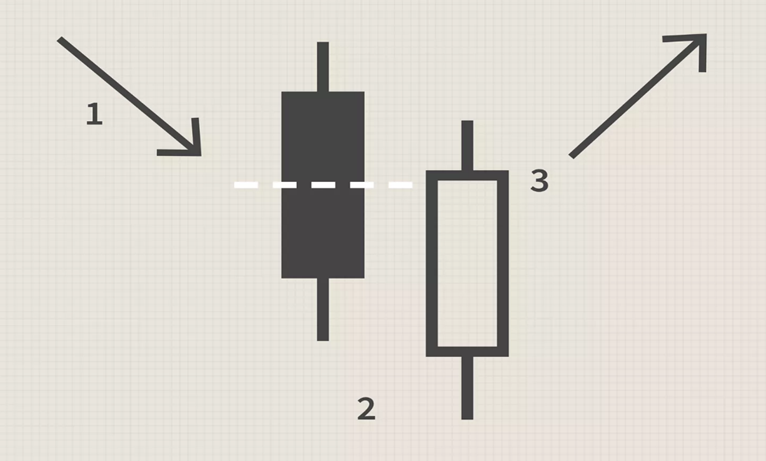
The piercing line is a double candlestick pattern that signals a bullish trend reversal. This makes it a bottom reversal pattern, which develops toward the end of a downtrend. It is the opposite of the bearish dark cloud cover pattern, which forms in an uptrend. Since the piercing line pattern is a bullish reversal pattern, it must emerge in an existing downtrend for it to have any relevance.
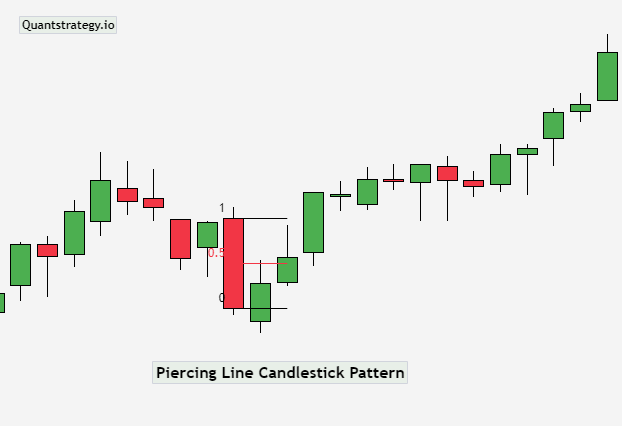
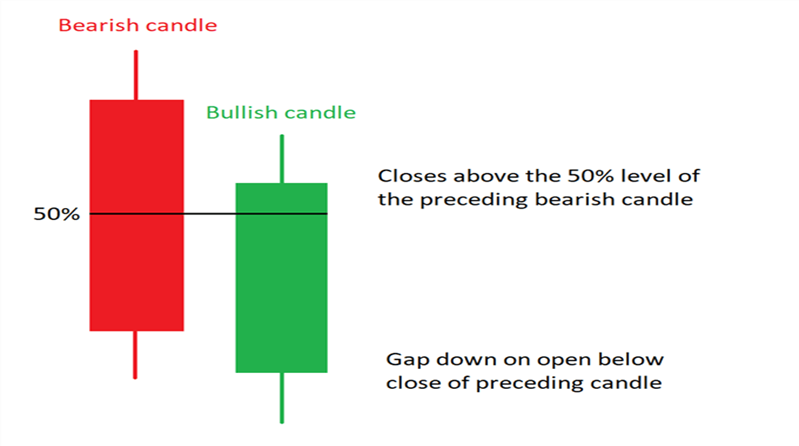
The piercing line pattern consists of two candles, a bearish candle of day 1 (first candle) and a bullish candle of day 2 (second candle). The candles have short lower and upper wicks and long bodies. The near-high opening prices of day 1 and the near-low closing prices of day 2 are what determine the piercing pattern. Its trading range can vary from an average to a greater size.
The small gap down after the first day is also a component of this two-candle pattern. The opening price of the second candle is lower than the first candle’s closing price (which means it opens below the close of the prior candle). The second candle, however, immediately reverses to close at a higher level, piercing the top of the first candle in the process by closing just below the top of the first candle (above the midpoint of the preceding bearish candlestick). That is the reason it is named a piercing line candlestick pattern.
How Piercing Line Patterns Work?
A piercing line pattern involves two days, the first of which is strongly impacted by sellers and the second of which is responded to by eager buyers. This could be a sign that the supply of shares, which market participants wish to sell, has been somewhat exhausted and that the price has fallen to a point where there is an increase in demand for buying shares and is also readily noticeable. This dynamic appears to be a somewhat accurate predictor of a short-term upward trend.
How a Piercing Line Pattern Forms?
A bullish piercing line pattern is one of a few significant candlestick patterns which technical analysts usually identify on a price series chart. Its formation timeline is two days and involves two consecutive candles previously mentioned. It also has additional important features (as noted in the figure above).
- A downtrend precedes the pattern. Although this can be a short downtrend only, it is not a significant reversal indicator if the candles occur following an uptrend.
- The price gaps down at the start of the second day. Stocks tend to exhibit this pattern more frequently than currencies or other 24-hour trading assets since they can have overnight gaps. On a weekly chart, however, this trading pattern could show up in any asset class. Moreover, gaps can only occur when the opening price of a security is higher or lower on the second day than the closing price on the first day.
- The bullish candle closes above the midpoint of the bearish candlestick. This shows that buyers outnumbered sellers on this particular day.
The bearish candlestick is usually represented as a red candle and denotes a down day, whereas the bullish candlestick is represented as a green candle and denotes a day, which closes higher than it opened. Any red candlestick followed by a white candle could serve as a warning for a trader looking for a bullish reversal, but the piercing line pattern stands out because the reversal is probably unexpected for most traders in the market.
Interpreting the Piercing Candlestick Pattern
The first candle indicates a bearish trend in the financial market. The second candle opening with a bearish gap signals strong expectations of bears. The second candle, however, closes on a powerful bullish note, defying the predictions of the bears. As a result, a bullish piercing line pattern alerts a trader to an impending trend change and also indicates that bearish traders have begun losing control.
The bullish piercing line pattern is an excellent tool that indicates that a security’s price trend has run out of momentum and a support (bullish) or resistance (bearish) level has been attained. This can aid traders in foreseeing a change in the price action of a commodity.
How to Trade a Bullish Piercing Line Pattern?
The piercing candlestick pattern is a bullish trend reversal pattern, which suggests that there’s weakness in the present downtrend, and it may end soon. Therefore, once the piercing line formation is complete, traders will attempt to go long (buy). A risk-taking trader might open a long position on the opening of the subsequent candlestick and put a stop order just below the low of the bullish piercing line candlestick pattern. Traders holding on to short positions might also wish to exit these short positions at this stage since continuing to keep them would be dangerous.
More cautious traders would hold off on opening a long position until the subsequent candlestick confirmed the reversal. This confirmation would come in the shape of the following candle closing higher than the pattern’s second candlestick. Again, a protective stop order should be set here just below the low of the bullish piercing pattern because a break below the formation would devalue the pattern. The trader could wait for a pullback near the expected support area of the piercing pattern’s bottom before entering a long position if the protective stop loss is too distant from the entry of the trade. This would move the entry much nearer to the safety stop and lower the amount of capital at risk on the trade.
Although the bullish piercing pattern does not offer a clear profit goal, an initial price target could be set at prior levels of support or prior areas of consolidation. A profit target based on a predetermined risk/reward ratio, a measured move, or another trading technique might also be employed by the trader to exit the trade. This could be a trailing stop, a Fibonacci retracement level, or the emergence of a bearish candlestick formation.
The piercing pattern, like most trend reversal patterns, becomes more reliable based on where it occurs on the price chart concerning pivot points, trend lines, support and resistance lines, etc. Additionally, traders can combine the piercing pattern with an oscillating indicator, such as the RSI, that signals an oversold asset.
Piercing Line Pattern – Pros & Cons
Piercing line candlestick patterns have distinct strengths and weaknesses, much like all other technical analysis tools. You must weigh these benefits and drawbacks when making trading decisions for this pattern.
Pros
- Simple to use and does not require software or high-level math to calculate
- Reliable chart pattern on short and long-term timeframes (daily, weekly, monthly)
- Easy to spot when trends are present
Cons
- It cannot be traded in isolation, and other technical indicators are necessary to validate the piercing line formation
- They form very rarely
Final Thoughts
The piercing line candlestick pattern is an important indicator of price reversal. It forms at the end of a downward trend in an asset’s price movement. Because of what this trading pattern implies about the underlying order flow shift in the market, we can use it in any market (stocks, commodities, forex, equities) and trade it in any time frame. So, regardless of whether you choose to scalp on the shorter timeframes or trade on the larger timeframes, this setup is reliable. It is crucial to remember that to avoid trading errors, you should evaluate signals from other market indicators and compare them with the outcomes from piercing line patterns.


