

Trading in the financial markets involves analyzing various factors to make informed decisions.
One essential aspect of technical analysis is the identification of reversal patterns, which indicate potential changes in the direction of a trend. By recognizing these patterns, traders can seize opportunities for profit and manage risk effectively.
In this article, we will explore the best candlestick and chart reversal patterns that every trader should know.
Introduction to Candlestick and Chart Reversal Patterns
Candlestick and chart reversal patterns are visual representations of price movements that suggest a potential shift in market sentiment.
Traders use these patterns to identify possible trend reversals and take advantage of favorable entry or exit points in their trades.
By understanding the characteristics and significance of these patterns, traders can enhance their decision-making process.
Understanding the Importance of Reversal Patterns in Trading
Reversal patterns play a crucial role in trading as they provide insights into financial market and help traders anticipate potential changes in price trends.
These patterns facilitate the identification of the end of a trend and the commencement of a new trend, empowering traders to modify their trading tactics effectively.
By recognizing reversal patterns, traders can avoid being caught on the wrong side of a trade and capitalize on emerging opportunities.
Bullish Reversal Patterns
Bullish reversal patterns indicate a potential change from a downtrend to an uptrend, signaling the possibility of a bullish uptrend. These patterns often represent a shift in supply and demand zones, suggesting that buyers may be gaining control over the market. Traders who spot bullish reversal patterns can position themselves for potential buys.
Bullish Engulfing Candlestick Pattern
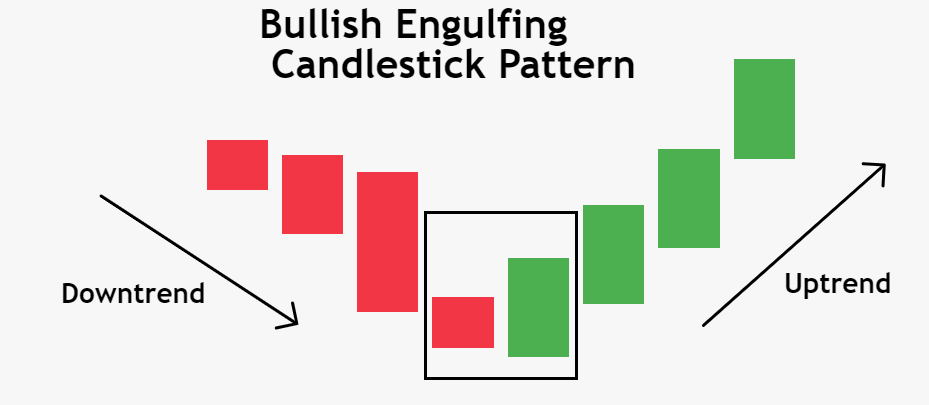
One of the most popular bullish reversal patterns is the bullish engulfing candlestick pattern. This pattern occurs when a small bearish candle is followed by a larger bullish candle that completely engulfs the previous one.
It suggests a shift in market structure from selling pressure to buying pressure, indicating a potential trend reversal. Traders prefer candlestick patterns to identify reversals on current trend.
Also patterns like rising wedge and falling wedge helps in identifying intraday reversal.
Hammer
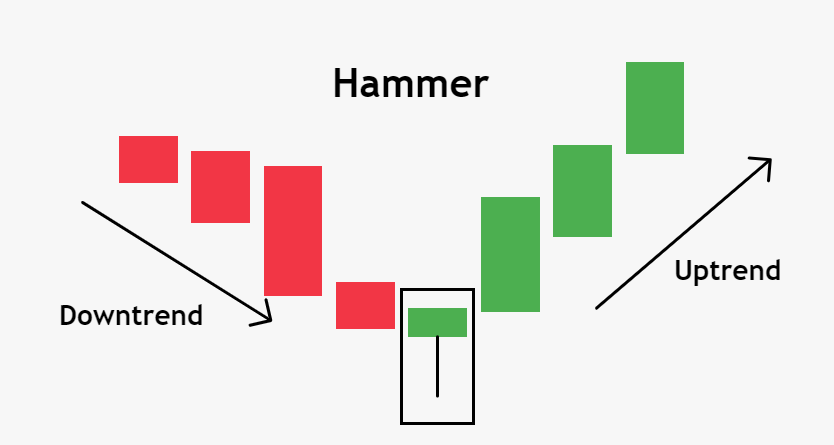
It can signal an end of the bearish trend, a bottom or a support level. The candle has a long lower shadow, which should be at least twice the length of the real body. The color of the hammer doesn’t matter, though if it’s bullish, the signal is stronger.
Hammers occur frequently and are easy to recognize. They show that although bears were able to pull the price to a new low, they failed to hold there and by the end of a trading period lost a battle with buyers. The signal is stronger if a hammer forms after a long decline in the price.
Moreover, the buy signal will be more reliable if a hammer is followed by a candlestick that closes above the opening price of the candlestick on its left. Here’s how a hammer looks at the real chart:
Morning doji star
Doji Morning Star is bullish reversal pattern that is very similar to the morning star. The signal of this pattern is considered stronger than a signal from a simple “morning star” pattern.
It appears in a downtrend and forms a small wick on the upper and lower end with almost no body. The idea behind this candlestick is that the bearish trend will end and bulls will soon take charge.
Inverted hammer
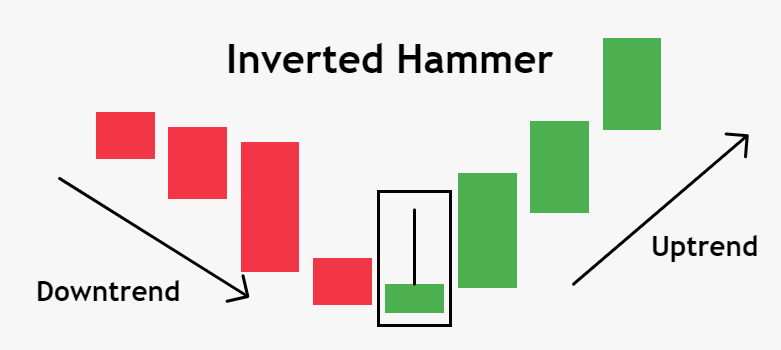
The candle has a small body and a long upper shadow, which is at least in 2 times longer than the real body.
The color of the hammer doesn’t matter, though if it’s bullish, the signal is stronger. An inverted hammer always requires further bullish confirmation. Trader can look for long positions on the chart formation of large bullish candle i.e bullish engulfing pattern.
Bearish Reversal Patterns
Bearish reversal patterns indicate a potential change from an uptrend to a downtrend, signaling a shift in market sentiment towards a bearish outlook. These patterns often occur when selling pressure begins to outweigh buying pressure, suggesting a possible trend reversal. Traders who identify bearish reversal patterns can prepare for potential price declines.
Bearish Engulfing Candlestick Pattern
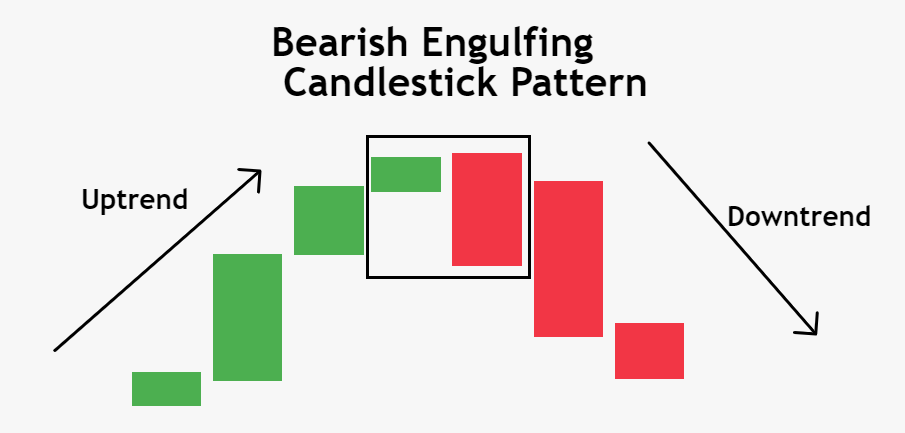
The bearish engulfing candlestick pattern is a popular bearish reversal pattern. It occurs when a small bullish candle is followed by a larger bearish candle that engulfs the previous one entirely. This pattern suggests a shift in market structure from buying pressure to selling pressure, indicating a potential trend reversal to the downside.
Three Black Crows
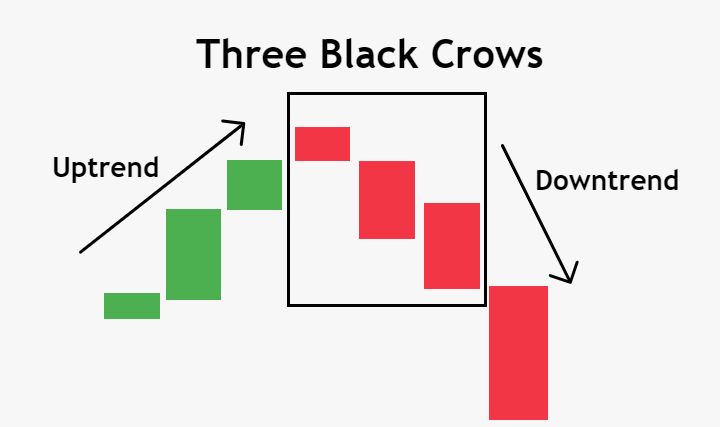
The three black crows is a bearish candlestick pattern that consists of three consecutive long-bodied bearish candles. This pattern is very often spotted in the market structure indicating downward trend.
Tweezer Top
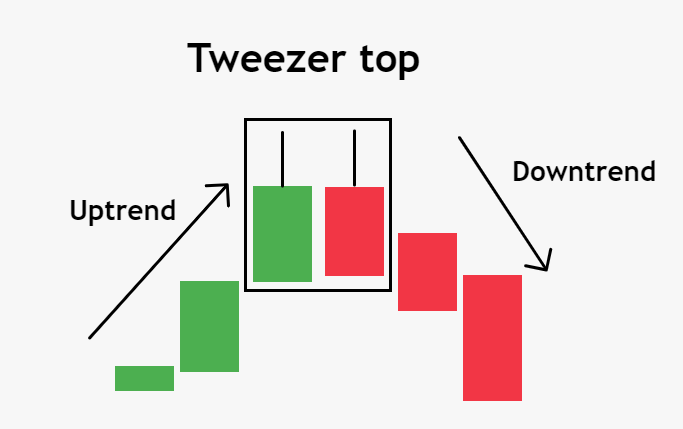
The tweezer top candlestick pattern is a bearish reversal pattern that often occurs at the end of an uptrend. It is formed by two consecutive candlesticks with similar highs, where the first candlestick is bullish and the second one is bearish. This pattern suggests that the buying pressure has weakened, and a potential trend reversal may be imminent.
Shooting star
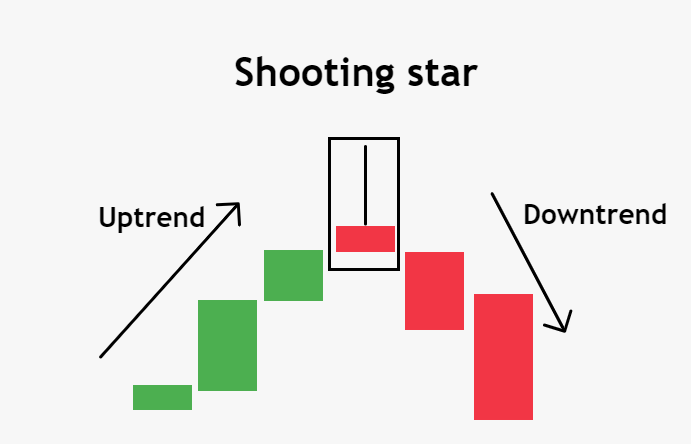
The candle’s body is small. The upper shadow is long and exceeds the body in at least 2 times.
The long upper shadow implies that the market tried to find where resistance and supply were located, but the upside was rejected by bears. The candle may be any color, though if it’s bearish, the signal is stronger.
Evening star
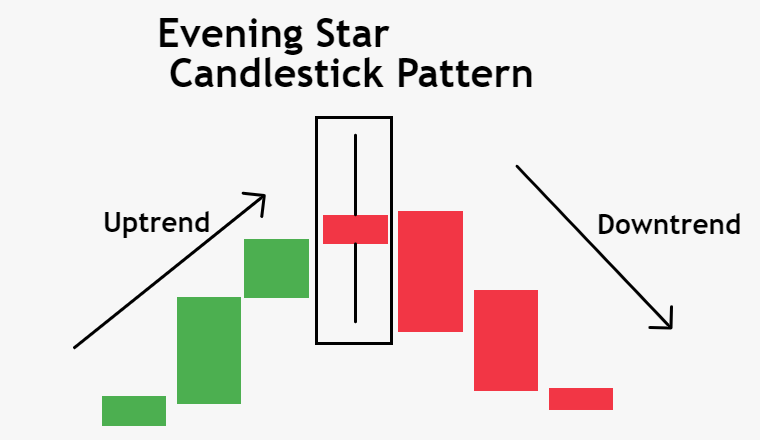
It appears on a top of an uptrend. It involves three candles the previous bullish and evening star itself indicating losing momentum and the next candle totally bearish. Indicating shift in the market structure. This Candlestick patterns can be often found in any financial markets.
Evening doji star
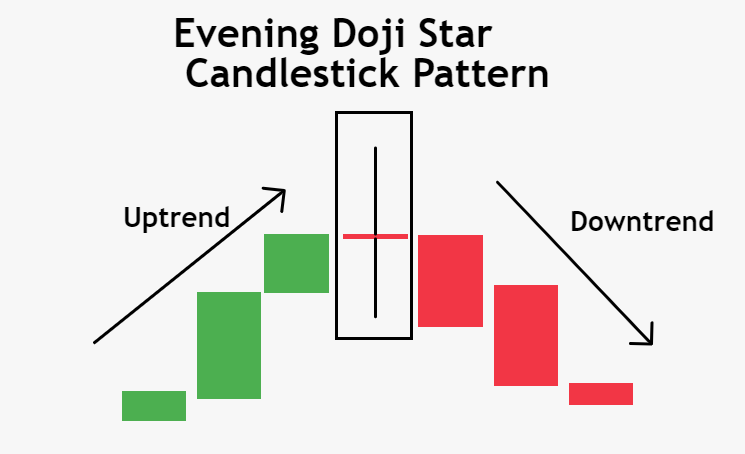
The pattern is similar to the “evening star”, but is considered to be a stronger signal as the middle candle is doji.
The signal of this pattern is considered stronger than a signal from a simple evening star pattern.
Hanging man
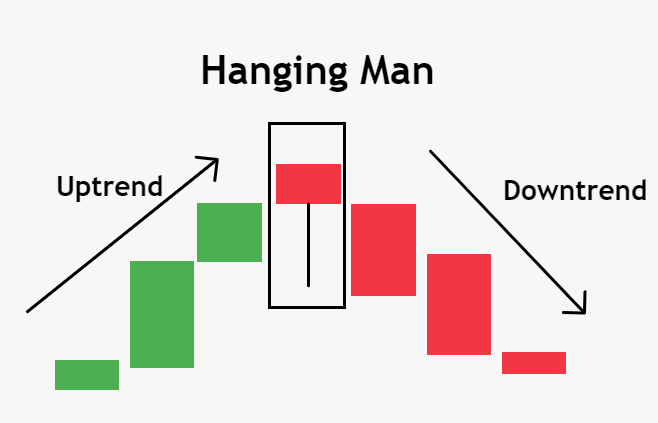
This is basically once candlestick pattern. It can signal an end of the bullish trend, a top or a resistance level. The candle has a long lower shadow, which should be at least twice the length of the real body. The candle may be any color, though if it’s bearish, the signal is stronger.
The pattern requires further bearish confirmation. The sell signal is confirmed when a bearish candlestick closes below the open of the candlestick on the right side of this pattern.
Dark cloud cover
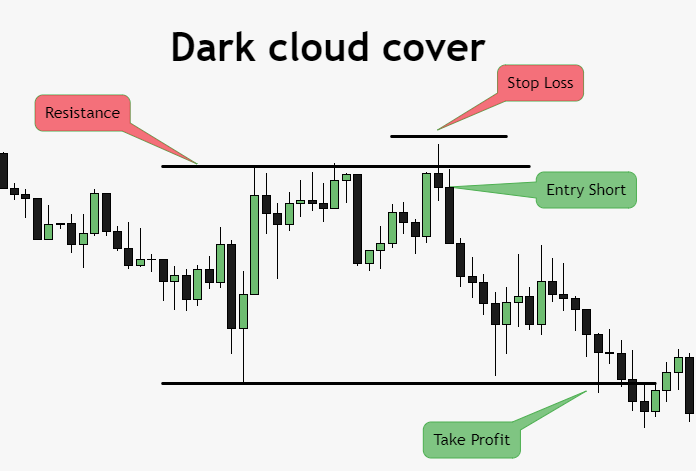
A 2-candlestick pattern. The first candle is bullish and has a long body. The second candlestick should open significantly above the first one’s closing level and close below 50% of the first candlestick’s body. The sell signal is moderately strong.
Tips for using patterns
Here are some tips for using the patterns:
- Use scaling. Increasing or reducing the scale will allow you to receive a clearer picture of previous extremes. Avoid the mistake of self-deception; avoid wishful thinking. Wait for the pattern to fully form, seek for the signal confirmation and then open a position.
- Look for a combination of patterns. A combination of several patterns confirming each other is an amplifying signal. Open a position only on the next candle or the second candle after pattern formation or at breakout of key levels.
- Do not open positions at the time of fundamental volatility no matter how strong the pattern is. The market can quickly change direction at those moments.
-
Use high timeframes. Patterns “do not know” how to distinguish prolonged strong and short-time correction movements. On a daily interval, a movement of 3-4 candles indicates profit, while on M5-M15 timeframe, this movement does not pay off the time.
Chart Reversal Patterns
Chart reversal patterns typically occur after a strong trend and can signal a change in direction, allowing traders to enter or exit positions at the right time.
Head and shoulders pattern
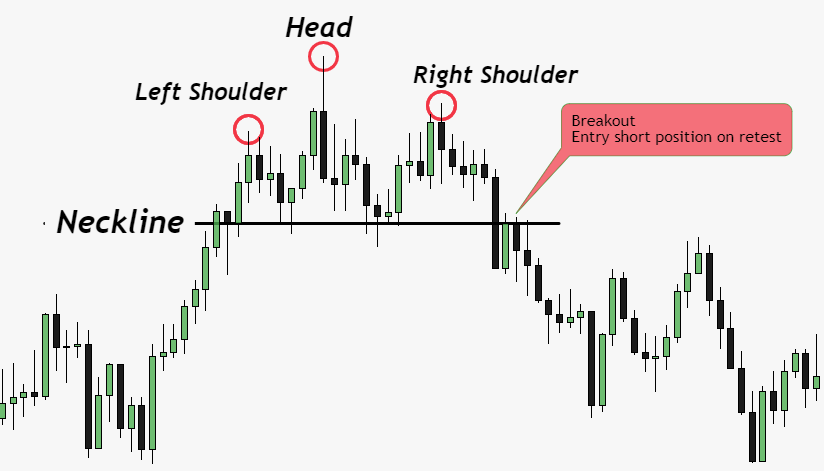
Head and shoulders pattern is formed by three consecutive peaks, with the central peak being the highest (the head) and the two outer peaks on either side (the shoulders). The pattern resembles the shape of a head and shoulders, hence its name.
Traders closely watch for the completion of this pattern as it often indicates a shift in market sentiment and can be used as a signal to enter short positions or to exit long positions.
In the above image, price breaks the neckline and then retests, traders can enter positions on retest.
Double Top pattern
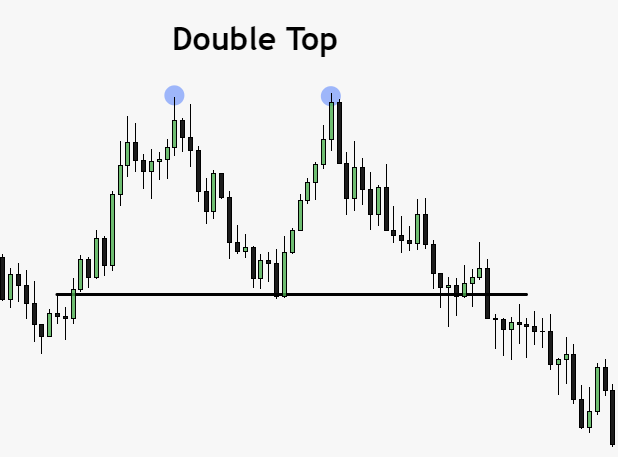
Double Top is formed by two peaks of similar height, separated by a trough. The pattern resembles the letter “M,” with the two peaks representing resistance levels that the price failed to break.
The double top pattern suggests that buying pressure has weakened, and sellers may gain control, leading to a potential decline in prices. Traders often look for confirmation signals, such as a break below the neckline, to validate the pattern and consider taking short positions.
Triple Top and Bottom
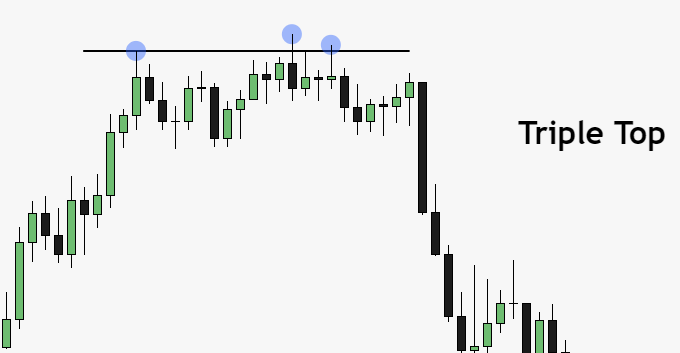
Triple is formed by three consecutive peaks, where the middle peak is higher than the other two (forming a “top” formation). The pattern suggests that the market has repeatedly failed to break above a certain resistance level, indicating a weakening of buying pressure.
Traders watch for the completion of the triple top pattern as it can indicate a shift in market sentiment and provide an opportunity to enter short positions.
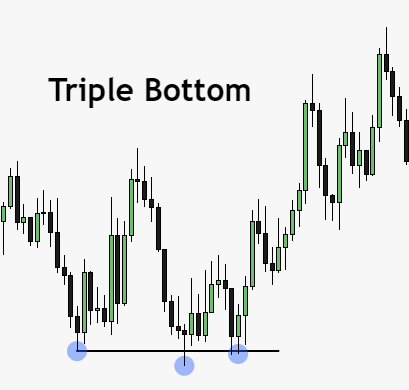
Similar to Triple Top, here the market shifts from downward trend to uptrend. Traders can look for long positions on the 3rd tap on confirmation.
Sushi roll reversal pattern
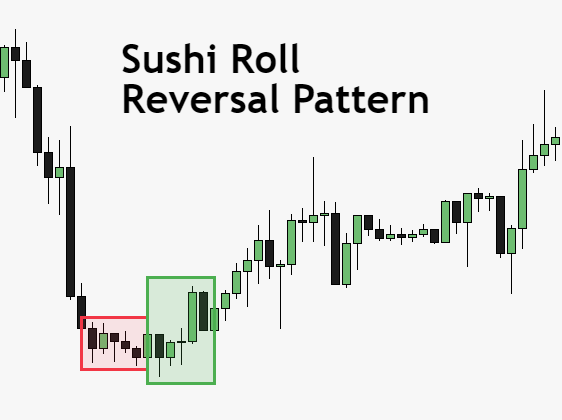
The term sushi roll candlestick pattern was first coined by the British writer Mark Fischer in ‘The Logical Trader’, a book he authored. Sushi Roll is defined as a candlestick pattern that consists of 10 bars.
The first five bars are known as the inside bars, which are confined within a slim or narrow range consisting of highs and lows.
The remaining five bars, known as the outside bars surround the first five bars with both, lower lows and higher highs. This results in the creation of a pattern resembling a literal sushi roll.
Quasimodo Pattern
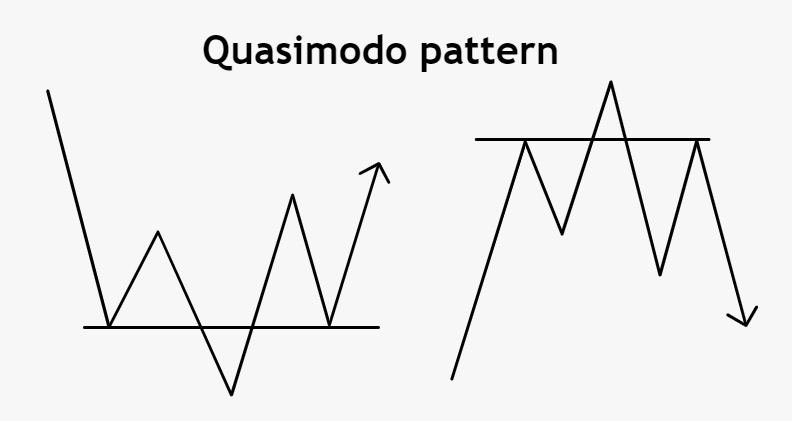
Quasimodo is basically a series of higher highs and lower highs. This pattern can be spotted at the end of uptrend and downtrend both as shown in above image.
From downtrend to uptrend shift, here the price creates a sequence of lower lows and lower highs, price breaks the recent lower high and creates a higher high indicating a shift in market structure. Similar to this setup, traders can look for long setup too.
The Role of Technical Analysis in Identifying Reversal Patterns
Technical analysis plays a crucial role in identifying and confirming reversal patterns. Traders utilize price action analysis, trend lines, and candlestick patterns to gauge market sentiment and forecast potential trend reversals.
By studying historical price data and analyzing chart patterns, traders can enhance their understanding of market dynamics and improve their trading strategies.
Conclusion
In conclusion, being able to recognize and interpret candlestick and chart reversal patterns is a valuable skill for traders. Bullish and bearish reversal patterns provide insights into potential trend reversals, allowing traders to adjust their strategies and take advantage of favorable market conditions.
Traders are suggested not to trade solely on patterns, but also use the combination of technical indicators. By combining technical analysis, chart patterns, and trend reversal indicators, traders can enhance their trading decisions and improve their overall success in the financial markets.
FAQs
1. What is the best way to identify reversal patterns?
The best way to identify reversal patterns is by combining different tools and techniques such as candlestick analysis, chart patterns, and trend reversal indicators. This comprehensive approach helps in confirming potential trend reversals and improves the accuracy of your analysis.
2. How can I incorporate reversal patterns into my trading strategy?
You can incorporate reversal patterns into your trading strategy by using them as signals for entry or exit points. When a reversal pattern forms and is confirmed, it can indicate a potential change in market direction, allowing you to adjust your positions accordingly.
3. Are reversal patterns always reliable?
While reversal patterns can provide valuable insights, it’s important to remember that no trading strategy or pattern is 100% reliable. It’s essential to use reversal patterns in conjunction with other technical analysis tools and consider the overall market context before making trading decisions.
4. Can reversal patterns be used in different timeframes?
Yes, reversal patterns can be used in different timeframes, ranging from intraday charts to longer-term charts. However, it’s important to consider the timeframe you’re trading in and adjust your analysis accordingly. Reversal patterns may have different levels of significance depending on the timeframe.
5. How can I improve my ability to identify reversal patterns?
Improving your ability to identify reversal patterns requires practice, observation, and ongoing education. Study different types of reversal patterns, analyze historical price data, and familiarize yourself with various technical analysis tools. Additionally, Backtesting your strategies can help you gain confidence in identifying reversal patterns.
Now you have a comprehensive understanding of the best candlestick and chart reversal patterns that every trader should know. By incorporating these patterns into your technical analysis, you can enhance your trading decisions and potentially improve your overall profitability.
Remember to combine different tools, consider the market context, and continually refine your skills to become a successful trader.


