

Trading is a dynamic and exciting world. Trading professionals seek to educate themselves and predict market movements as much as possible for consistently profitable trading. And one effective way of doing this is by employing technical analysis, which involves studying different candlestick patterns. One such pattern is the evening star, which is known for its ability to indicate a potential bearish reversal.
In this article, we’ll explore the key characteristics as well as how to trade the evening star candlestick pattern.
What is Evening Star Candlestick Pattern?
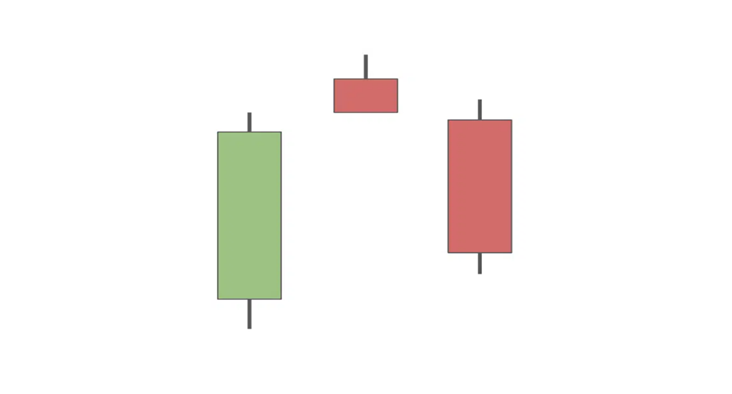
The evening star pattern is a stock price chart pattern deployed by technical analysts to determine when a trend is going to reverse. Even though it is uncommon, traders believe the evening star pattern to be a trustworthy technical indicator. It’s a bearish candlestick pattern that forms over three days. It consists of three Japanese candles one for each day:
A bullish candle: This green long-body candlestick signifies a strong rise in price movement on the first day, with the close price adjusting above the open price. It reflects an upward momentum of the price, indicating that buyers are in control.
A small-bodied candle: This is a small green or red or Doji candle that occurs on the second day when the open and close prices are close together, indicating indecision in the market. It reflects a slowdown in the prior bullish momentum. In ideal evening star patterns, there must be a gap up from the first candlestick to the Doji candle. It implies that the open price escalated rapidly from the previous close price with very few, or if any, transactions taking place in the meantime.
A large bearish candle: This red candlestick denotes a downward movement of the asset price, signaling that sellers are now controlling the market. It occurs on the third day.
Evening star patterns form when the small-bodied candlestick gaps above the prior bullish candle and the bearish candle fall below the middle of the first candle. This candlestick pattern is thought to be more dependable if the bearish candle completely engulfs the bullish candle.
The length of the candle bodies is a function of the trading range between the highest and lowest price of that trading day. A longer length signals a higher fluctuation of price and vice versa. Trading analysts pay greater attention to open and close prices instead of the trading range of that day while identifying evening star patterns.
An evening star pattern is associated with the peak of a price uptrend, indicating that the uptrend is about to terminate. The morning star pattern, which is seen as a bullish indicator, is its opposite.
Morning Star Pattern
The morning star pattern is a bullish reversal pattern, which indicates a prospective reversal from a downward trend to an upward trend and gives a buying signal. A bearish candle, a small-bodied candle, and a bullish candle make up its three candlesticks.
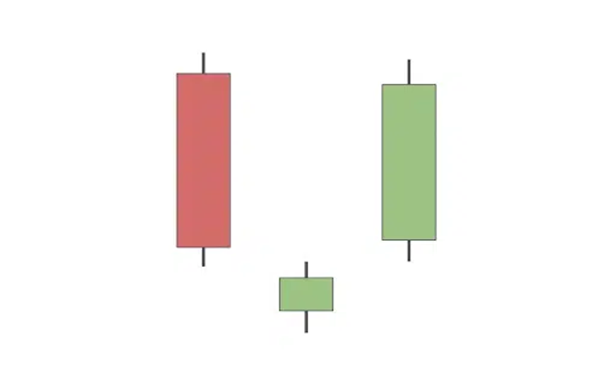
The morning star is formed when a small-bodied candle gaps below the preceding bearish candle, and a bullish candle follows it with a close above the first candle’s midpoint. Similar to the evening star, the morning star pattern is thought to be more dependable when the bullish candle engulfs the bearish candle.
How to Trade with Evening Star Pattern?
Like other candlestick patterns, trading with the evening star pattern is quite straightforward. To do this and increase the chances of success, traders need to recognize the evening star formation, which is a long bullish candle, Doji candle, and bearish candle, define a market entry, establish a stop loss, and place a profit target. Let us see how it can be executed:
- Identify and Confirm the Pattern
A potential trend reversal should be indicated by a bullish trend that is followed by the creation of the evening star pattern. To confirm the accuracy of the signal, wait for more bearish candlestick patterns or other technical indicators, such as resistance levels or trendlines, that point to a bearish reversal.
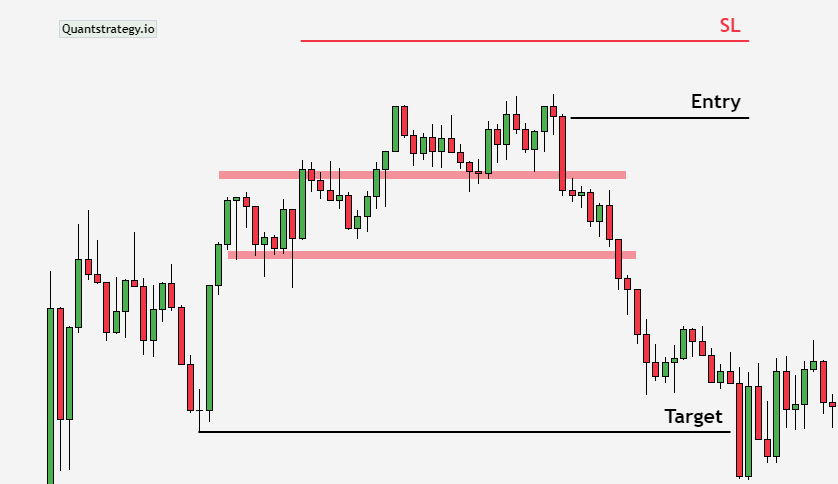
- Market Entry
The procedure of defining market entry with evening stars is rather easy. Finding a short trade position is simple once you recognize the three-candle pattern.
Set a sell order below the third candle of the pattern to execute a trade using evening stars. Once the order is carried out, a new short position will become available.
- Stop Loss
To reduce potential losses if the trend reversal does not occur, place a stop-loss order above the highest point of the pattern. The stop loss is usually placed above the Doji candle. It is a buy order that, if filled, ends the short position.
- Profit Target
Since the evening star pattern predicts downside market moves, the profit target should be set before the following support level.
- Monitor the Trade
Watch the price movement and change the take-profit and stop-loss levels as necessary.
Example of an Evening Star Candlestick Pattern
The simplicity of trading single candlestick patterns is one of their top advantages. See the GBP/USD example below for a practical example of how it works.
These steps were taken to carry out this GBP/USD evening star trade:
- An uptrend was noticed.
- The evening start pattern was identified.
- A sell order was set at 1.4175 beneath the pattern.
- A stop loss was established at 1.4250 above the second candle.
- A profit objective was determined to be at 1.4100 using a risk-to-reward ratio of 1:1.
- The trade resulted in a 75 pips profit when the profit objective was reached.
The Evening Star Pattern – Pros & Cons
Here are some of the common pros and cons of the evening star pattern:
Pros
- It has a simple three-candle formation that can be easily identified by most price action traders.
- It can be traded on all time frames and securities.
- It can be used in combination with other technical analysis tools to form a robust trading system.
- It is a reliable bearish reversal pattern that is useful for traders who wish to profit from possible market downturns.
Cons
- It doesn’t guarantee price reversals.
- It may produce false signals in potent bullish trends. This means that the market might not move in the anticipated direction, resulting in possible losses for traders.
- It may lose efficacy in rotational markets.
Conclusion
The evening star trading pattern is a useful bearish reversal pattern that indicates potential trend reversals in the financial market. Traders commonly use this pattern to identify prospective selling opportunities. However, it’s never a good idea to rely solely on it. Trading decisions should also take into account fundamental analysis, additional technical indicators, and risk management techniques.


