


Technical analysts and traders are always looking for chart patterns while trading. The reason is that patterns are easy to trade, offer explicit trading outcomes, and can be identified across all time frames. Today, we will see and learn one such trading pattern called the Megaphone Chart pattern.
Like all price formations, the megaphone pattern can be bearish or bullish. It was first introduced in 1932 in Richard Schabacker’s book, named “Technical Analysis and Stock Market Profits”. It looks like a megaphone, which is where it got its name.
It informs a lot about a stock, depending on which direction they are going. While they aren’t the summit of investment selections, they can act as a reliable technical indicator in a market that is pushing or pulling.
This pattern is also known by several other names, such as broadening formation, broadening wedge, and inverted symmetric triangle. However, we’ll be using the name Megaphone pattern in this article.
What is Megaphone Chart Pattern?
Megaphone patterns are one of the most useful price charts in stock trading and forex trading. They are considered both reversal and continuation patterns.
A megaphone pattern consists of a minimum of two higher highs and two lower lows. It usually forms in high market volatility where traders are doubtful about the prospective market direction. It generally develops after a strong uptrend or downtrend in the stock price.
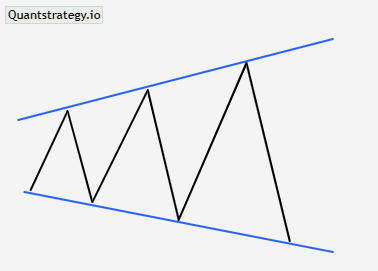
The broadening formation or megaphone pattern has five different swings. The pattern gets the appearance of a megaphone because each swing is larger than the prior swing. In the megaphone pattern, the key swing points are joined by two diverging trendlines and are composed of lower low troughs and higher high peaks. These swings could all possibly involve smaller, less significant swings. The first and fifth swings of the pattern, which depict the reversal of prime direction before the megaphone pattern forms, are its important swings. Another distinctive feature of megaphone patterns is that each swing’s growing volatility causes reversals of up and downside swings.
The megaphone chart pattern describes the normal state of the market. It depicts a situation in which bears and bulls are fighting over a specific stock market direction. To simplify, the megaphone pattern occurs in most instances when the market is very volatile and the general market orientation is unclear. As prices rise, buyers are more inclined to purchase at higher prices, and sellers are more driven than ever to make a profit. As a result, there are several greater interim price peaks and lower interim lows. The two diverging trend lines create a widening pattern that resembles a megaphone or reverse symmetrical triangle by joining these highs and lows.
Since megaphone patterns form at the top or bottom of the market, they are most useful in long-term trends. The longer the time frame, the better they perform. Nonetheless, the majority of traders use the megaphone trading pattern when it takes shape in a daily or weekly time frame.
Traders use the megaphone stock pattern to generate signals to buy or sell a stock based on the direction of the market when it’s reaching either end of its range. It offers numerous trading opportunities, including situations when it fails, though it is crucial to identify the failure accurately.
However, in order to achieve successful results, all data must be confirmed from various sources, just like with any other technical indicator or chart pattern.
Finding entry and exit opportunities with a multidisciplinary strategy is a certain way to earn stock market profits.
Identifying the Megaphone Chart Pattern
Megaphone patterns aren’t difficult to identify and do not require advanced knowledge on the part of the chartists. They entail a series of swing highs and swing lows. Yet they must have at least two swing highs and swing lows for the pattern to form completely.
By drawing trend lines and connecting points 1 with 3 and 2 with 4, we get a broadening pattern similar to the shape of a megaphone.
The present swing low or swing high should close below or above the prior ones. This results in pivot swing lows (S1, S2, S3, and more) and pivot swing highs (R1, R2, R3, and more).
A breakout occurs as the price closes outside the two trendlines (outside the pattern) after forming the fifth swing.
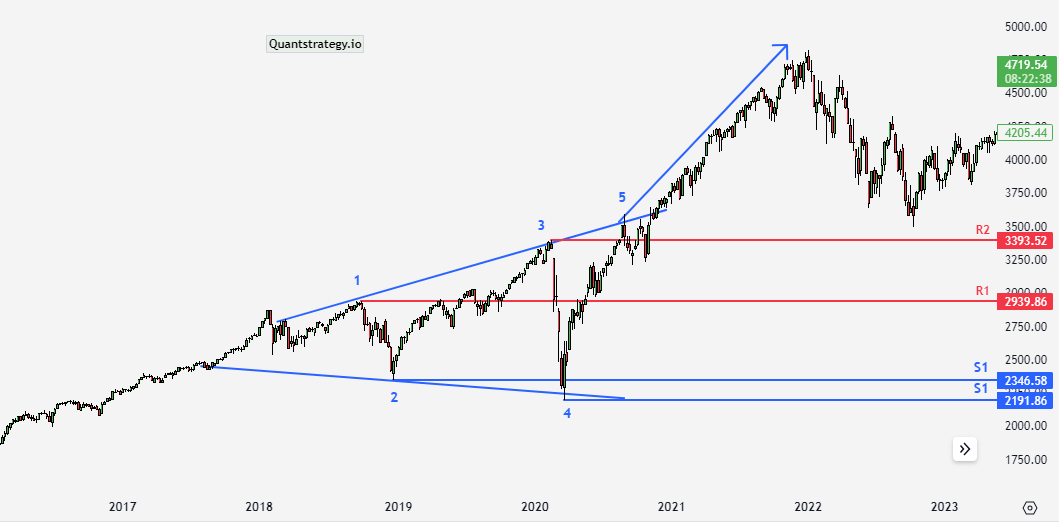
The below S&P 500 chart on a weekly time frame demonstrates how the price breaks after the fifth swing high.
Are Megaphone Patterns Bearish or Bullish?
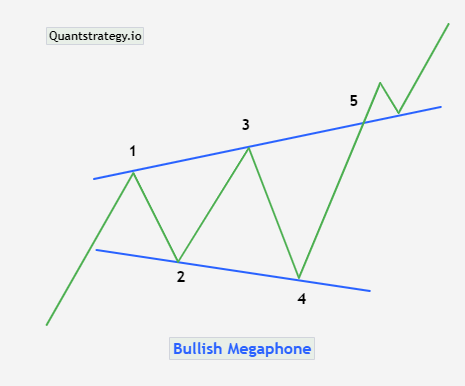
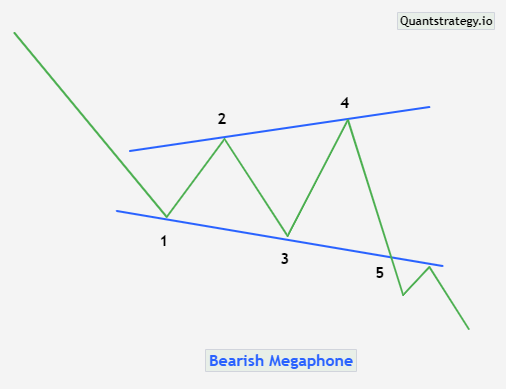
Megaphone patterns can be displayed as a bullish megaphone pattern or a bearish megaphone pattern based on the trend before it.
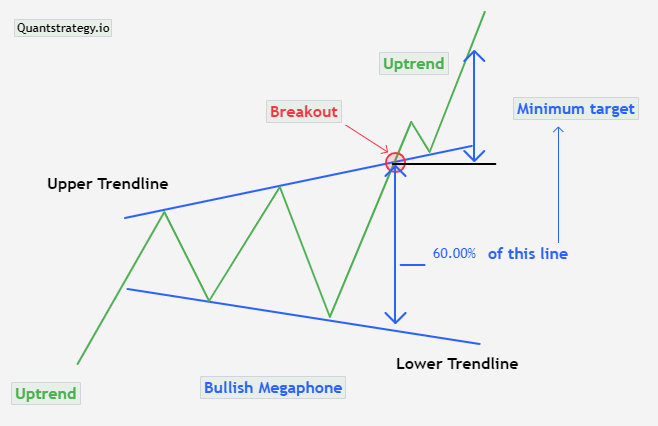
If the stock or security experiences a bullish trend (upward movement) when the megaphone chart pattern begins, it is called a bullish megaphone pattern or megaphone bottom. This pattern usually results in a breakout upwards, above the upper trend line. Thus, it verifies the persistence of the current bullish momentum.
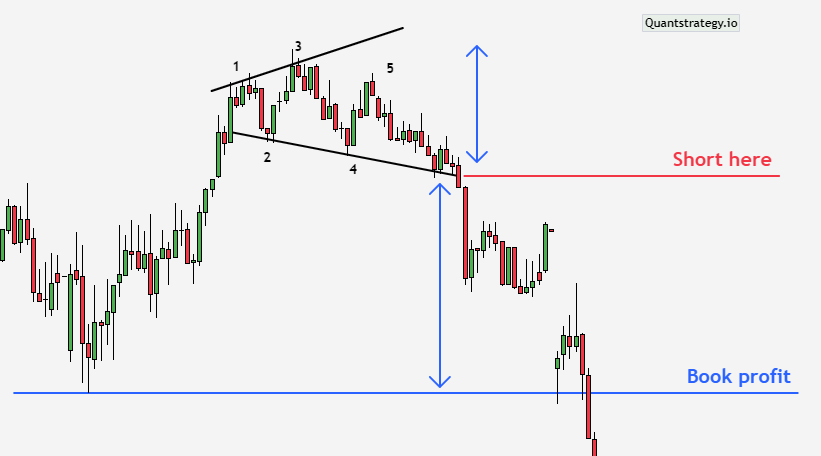
If the stock experiences a bearish trend (downward movement) when the megaphone chart pattern begins, it is called a bearish megaphone pattern or megaphone top. This pattern usually leads to a breakout downwards, below the lower trend line. Thus, it verifies the persistence of the current bearish momentum.
Trading the Megaphone Pattern
Megaphone patterns are most useful for day trading as well as swing trading. However, long-term traders can employ it as an indication to buttress their current positions. Additionally, the identification of the chart type can help traders anticipate the market direction. Nevertheless, traders can trade megaphone patterns in two ways. The breakout can be traded as a megaphone continuous pattern whereas reverse movements can be traded by considering the pattern as a reversal pattern.
To clarify, the megaphone pattern acts as a continuation pattern when it appears in a bullish market and the price closes above the upper trend line. On the other hand, a megaphone pattern is considered a reversal pattern when it emerges in an uptrend and the price closes below the lower trend line.
Hence, this pattern can be availed in multiple ways by stock traders. Some of the trading strategies to trade megaphone patterns are:
Trading Breakouts
This is the most straightforward trading strategy in which traders wait till the price breaks the trend line after forming the fifth swing. Breakout can occur in either positive or negative directions based on the type of megaphone pattern (bullish or bearish megaphone pattern).
As a rule, traders can open a trade immediately after the price closes outside the pattern to get a strong verification of the breakout.
In such a case, it will not be simple to recognize a precise target (exit point). Still, traders deploy an easy way to set their stop loss. They place their exit point at 60% of the line, which is equal to the distance between two trend lines from the breaking point. This is illustrated in the example below.
Swing Trades
As a geometrical pattern, the megaphone pattern respects the Fibonacci levels as well as the pivot line since it is impossible to properly examine the Fibonacci level without considering pivot lines. Hence, this pattern will involve some essential S&R lines.
Moreover, it has to be made clear that the pattern will have a defined pivot line, along with a corresponding support and resistance line, to help in the interpretation of the pattern.
Resistance one (R1) and resistance two (R2) can act as possible resistance for traders who prefer long positions. On the contrary, support one (S1) and support two (S2) can work as possible support for traders who wish to take a short position.
Again, it can be difficult to determine the target as the best exit point is not always simple to locate. Traders can make a profit and create an exit point at 60% of the line, as mentioned above.
This strategy deploys crucial trading forex block levels to allocate stop loss, entry points, and price targets. Traders depend on Fibonacci retracements and extensions in this regard, to make the right trading decisions.
Trading Failures
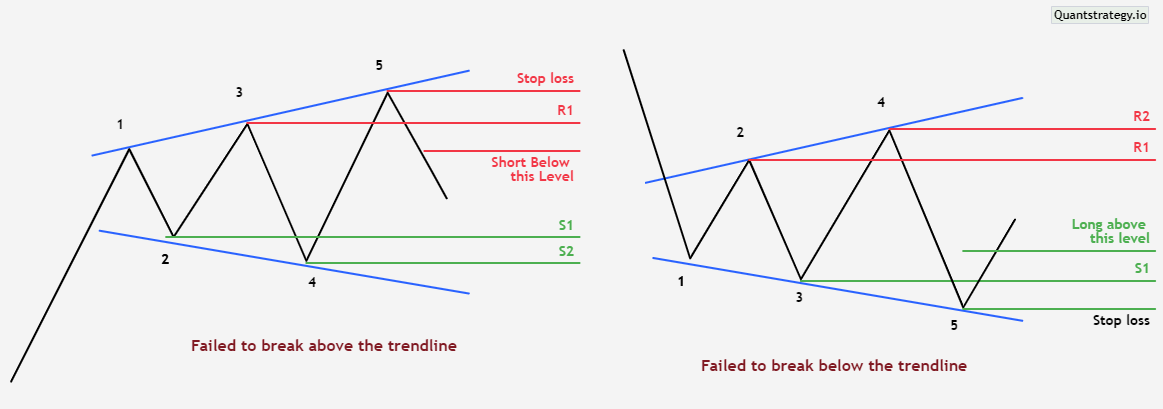
A chart pattern can be used for trading even if it fails to form perfectly. Though this fact sounds confusing, it is true in the case of broadening formation. However, the pattern has to be confirmed first for this strategy to succeed. But how can one identify a swing failure? This is a case when the price does not successfully break the trend line after creating the fifth swing.
To explain, let us consider a bear market where a megaphone chart pattern is identified. The price fails to break the lower trend line. The trader will go long at this point when the price moves below the third swing low.
Similarly, the circumstances remain the same when the pattern develops in a bull market, and the price does not penetrate the upper trend line. The investors will go short if the price moves above the third swing high.
Conclusion
The formation of different patterns helps traders to anticipate price direction. The megaphone pattern is one such chart pattern that is beneficial in guiding price direction once the volatility subsides. Depending on if it is heading up or down, the megaphone pattern can be a bearish or bullish megaphone chart pattern. It usually develops in volatile situations when sellers and buyers are battling over the direction of a stock. Thereby, it is most applicable for day and swing traders. Nonetheless, long-term investors can employ it to support their investments as well.


