


In the realm of technical analysis, two technical indicators stand out as pillars of understanding market movements and trends – Moving Averages (MAs) and Fibonacci Retracement. Moving averages are the most determinant and useful technical factors due to their visibility, simplicity, and flexibility. Everyone observes them to find support and resistance levels and to follow the trend. The Fibonacci retracement tool, on the other hand, forms the cornerstone in the tool kit of many traders, providing a mathematical approach to recognizing potential reversal points. Fascinatingly, it’s based on the Fibonacci sequence, which was discovered over 700 years ago.
When combined, they do the same job as normal Fibonacci retracement and Moving Average Indicators but with improved reactivity and quicker response to market moves as well as more accurate support and resistance levels. This powerful Fibonacci Moving Average Strategy enables traders and investors to spot potential entry and exit points and more confirmation for trading decisions.
In this comprehensive article, we’ll discuss the intricacies of both Moving Averages and Fibonacci Retracement, exploring their individual functionalities and how they synergize to create an effective trading strategy.
The Concept of Moving Averages
Moving Averages (MAs) are among the most widely employed technical analysis tools that help us confirm and follow the trend. They are essentially smoothed-out lines that demonstrate the average price of a security over a specified period. They are termed ‘moving’ because they continuously update as fresh data becomes available, offering traders a more precise picture of price trends.
Moreover, they are the most renowned technical indicator and the reason is their simplicity and track record of improving the analysis. By computing the average closing price over a specified timeframe, MAs enable traders to find potential entry and exit points, stops and targets, potential trend reversals, support and resistance areas, and comprehend the underlying trend.
Moving Averages apply to various timeframes, ranging from short-term charts such as 5-minute or 15-minute to longer-term charts such as daily or weekly. The timeframe used is determined by the trader’s preferences and trading style.
Longer time frames offer more dependable indications but fewer trading opportunities; shorter timeframes offer more frequent signals but can be more susceptible to market noise
Different Types of Moving Averages
There are various types of Moving Averages, but Simple Moving Average (SMA) and Exponential Moving Average (EMA) are the two most commonly used.
- Simple Moving Average (SMA): The SMA determines the average closing prices over a specified number of periods equally. It is simple and offers a clear depiction of price trends over time.
- Exponential Moving Average (EMA): On the contrary, EMA places more weight on the recent data points, which renders it more responsive to short-term price movements.
While SMA has simple calculations, EMA is favored by many traders because it reacts quicker to price changes and can be beneficial in fast-paced markets.
The choice between SMA and EMA relies on the preference of the trader and the particular requirements of their trading strategy. Some traders prefer the responsiveness of the EMA, while others value the simplicity of the SMA.
The price is generally in an uptrend and is considered bullish when it is above its Moving Average. Conversely, it is generally in a downtrend and is considered bearish when it declines below the Moving Average.
Understanding Fibonacci Retracement
Fibonacci retracement is a popular technical analysis tool developed by an Italian mathematician named Leonardo Fibonacci during the 13th century. The indicator is based on the Fibonacci sequence – a series of numbers where each number represents the sum of the preceding two. The sequence begins with 0 and 1 and goes on by adding the two preceding numbers to obtain the next one: 0, 1, 1, 2, 3, 5, 8, 13, 21, and so on.
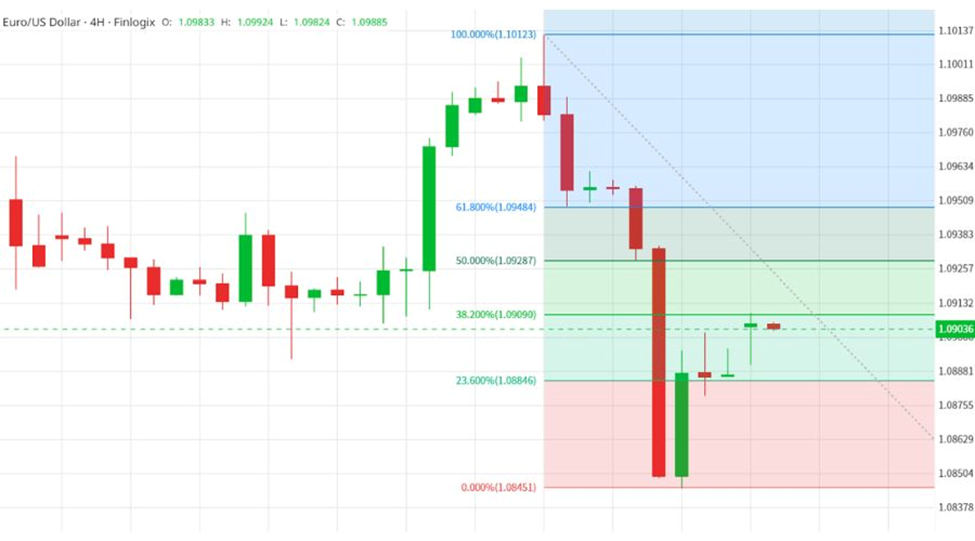
Fibonacci retracement levels are actually horizontal lines plotted on a price chart at particular Fibonacci ratios that indicate possible support and resistance levels in price action. These levels provide valuable insight regarding where the price of a currency pair may reverse or consolidate before resuming its prior trend, thus offering strategic points for entry and exit. The key retracement levels used in trading are 23.6%, 38.2%, 50%, 61.8%, 78.6%, and 100%. A Fibonacci trading technique would involve these levels to analyze price behavior.
The interesting thing about the Fibonacci sequence is that as it goes on, the ratio of any two consecutive numbers gets closer to the “Golden Ratio,” which is roughly 1.618. The Golden Ratio, often represented by the Greek letter Phi (Φ), is a mathematical constant that frequently appears in nature, architecture, and art. In the Fibonacci retracement framework, traders use the Fibonacci ratios generated from Phi to spot support and resistance levels in price charts.
Regarding the Fibonacci retracement timeframe, it is important to understand this technical indicator is applicable across different timeframes, ranging from one-minute to monthly charts. However, the dependability of retracement levels usually rises in higher time frames. This means the ones plotted on daily or weekly charts usually give stronger support or resistance relative to ones on shorter timeframes.
Implementing the Moving Averages and Fibonacci Retracement
In trading, the strategies involving Fibonacci Moving Averages can significantly increase decision-making. Besides, when a Moving average aligns with a Fibonacci retracement level, it can increase the probability of a successful trade.
Here are some distinct ways Fibonacci Moving Averages can be used to recognize high-probability trade setups.
Identify Potential Support and Resistance Zones
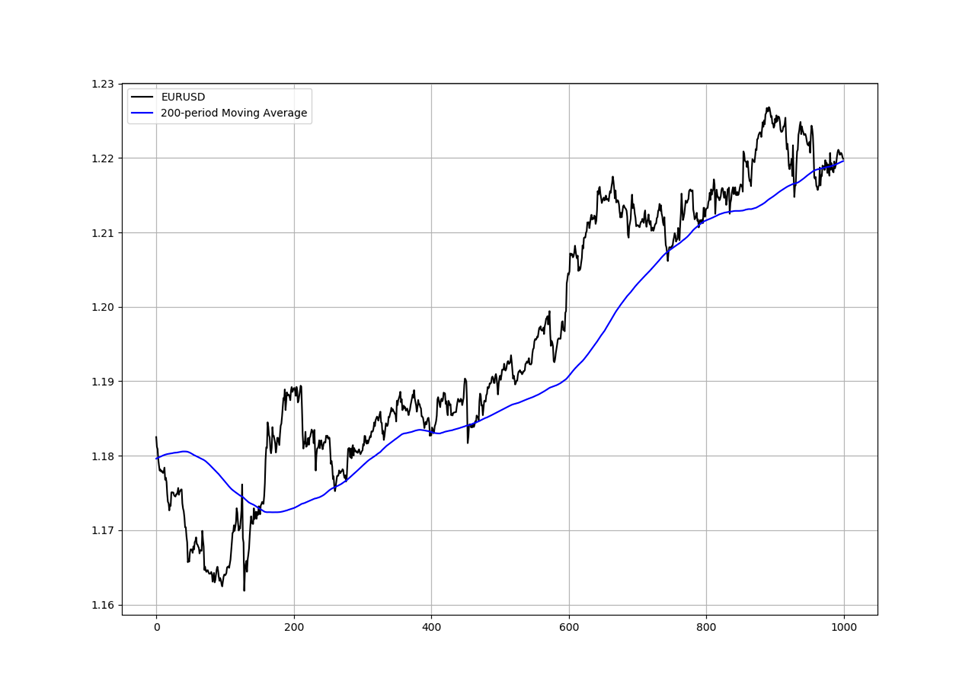
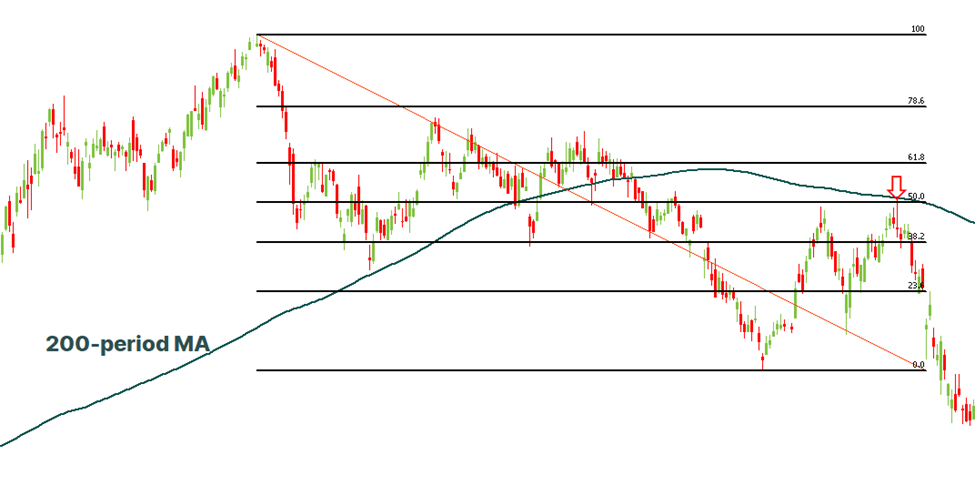
The Fibonacci Moving Average is useful for spotting potential support and resistance zones. Fibonacci retracements are frequently utilized with the 200-period Moving Average particularly because if it matches with the 50% retracement level, a pullback is most likely going to occur at this level. This is an excellent time to enter the market and start making money.
Identify Buying Opportunity or Potential Reversal
The Fibonacci Moving Averages strategy can signal a possible buying opportunity if the price of a currency pair trends upward and pulls back to a key Fibonacci level.
Conversely, if the price pulls back to a Fibonacci retracement level that aligns with a Moving Average acting as resistance, it can signal a possible reversal or continuation of the downward trend.
Example – Fibonacci Retracement with Moving Average Crossover
In this Fibonacci Moving Average strategy, traders combine Fibonacci retracement with two Exponential Moving Averages set at 9 and 12 periods to determine entry and exit locations. They use the retracement tool to measure possible reversal zones once they’ve identified a trend, whether bullish or bearish. The 38.2%, 50%, and 61.8% retracement levels are particular areas of interest. The next step is to monitor the Exponential Moving Average indicators if the price reacts at any of these zones—possibly supported by a bullish or bearish candlestick pattern.
Entry
A Moving Average crossover in the direction of the current trend is often considered a sign of potential entry by traders.
Stop Loss
Stop losses might be positioned above or below the closest swing low or high. On the other hand, others choose to set it higher, such as 23.6% or 78.6%.
Take Profit
Profits are usually taken at the low or high of the retracement area where the price reacted initially.
Tips for Effective Fibonacci Retracement and Moving Averages Strategy
Traders should take into account the following advice in order to apply the Fibonacci Retracement and Moving Averages technique effectively:
- Identify the Trend: Examine the price-moving average relationship to ascertain the current trend. This will serve as the basis for your trading decisions.
- Pick Appropriate Timeframes: Pick suitable timeframes for your Moving Averages and Fibonacci levels based on your trading goals and approach. Long-term investors may prioritize longer timeframes, whereas short-term traders might favor shorter ones.
- Confirm with Other Indicators: Use additional technical analysis tools or fundamental analysis to confirm signals produced by Fibonacci levels and Moving Averages. This can help in reducing false signals and improve trading accuracy.
- Use Appropriate Risk Management Techniques: To safeguard your capital from unfavorable market fluctuations, use appropriate risk management strategies, including stop-loss orders and adherence to position sizing guidelines.
- Backtest and Optimize: Backtesting your trading technique using historical data can help you assess its performance and pinpoint areas for development. Make constant improvements to your strategy in response to actual outcomes and shifting market dynamics.
Conclusion
Mastering the Moving Average indicator and Fibonacci Retracement strategy demands a thorough understanding of both technical indicators and how they fit into a cohesive trading framework. Through the integration of Moving Averages’ trend-following properties with Fibonacci Retracement’s reversal-predicting skills, traders can augment their capacity to detect high-probability trading opportunities within the stock market. Still, you need to practice discipline, patience, and risk control to be consistently successful with this trading method.


