In the fast-paced world of trading, investors and traders are constantly seeking ways to gain an edge in the market. One popular approach is technical analysis, a method of evaluating securities based on statistical trends and historical price and volume data.
In this article, we will explore what technical analysis is and how it can be effectively utilized in trading.
What is Technical Analysis?
Technical analysis is a method used by traders and investors to evaluate securities and forecast future movements based on historical data. It involves the study of price charts, patterns, and various technical indicators to gain insights into market trends and make informed trading decisions.
The core principle of technical analysis is that historical patterns tend to repeat themselves, and by identifying these patterns, traders can anticipate future price movements. It assumes that market behavior is driven by supply and demand dynamics, investor psychology, and other factors that are reflected in the price action of a security.
Technical analysts utilize a variety of tools and techniques to analyze price data. This includes chart patterns such as support and resistance levels, trendlines, and chart formations like head and shoulders, triangles, and double tops/bottoms. Additionally, technical indicators such as moving averages, oscillators, and volume indicators are used to generate trading signals.
Both in forex markets and stock markets, technical analysis helps traders in understanding market sentiment, identify potential support & resistance levels, and recognize patterns that may indicate trend reversals or continuation. It provides a framework for interpreting price data and assists traders in formulating trading strategies based on historical price movements.
Unlike fundamental analysis, which analyzes a company’s financial health and intrinsic value, technical analysis primarily examines price and volume patterns to make predictions.
The Basics of Technical Analysis
To understand technical analysis better, let’s explore some fundamental concepts used in this approach:
Price Charts
Price charts are graphical representations of a security’s price movement over a specific period. They provide valuable information about the historical performance of a security and help traders identify patterns, trends, and potential support & resistance levels.
There are different types of price charts, including line charts, bar charts, and candlestick charts. Line charts display the closing prices, while bar charts and candlestick charts provide additional information such as the opening, high, and low prices.
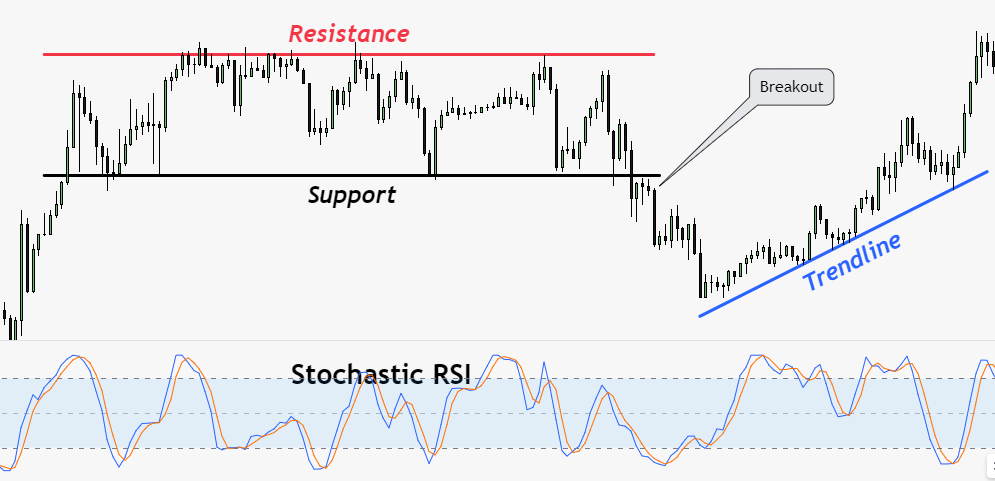
Support and Resistance
Support & resistance levels are key concepts in technical analysis. Support represents a price level where buying pressure exceeds selling pressure, causing the price to stop falling and potentially reverse.
On the other hand, resistance is a price level where selling pressure exceeds buying pressure, preventing the price from rising further.
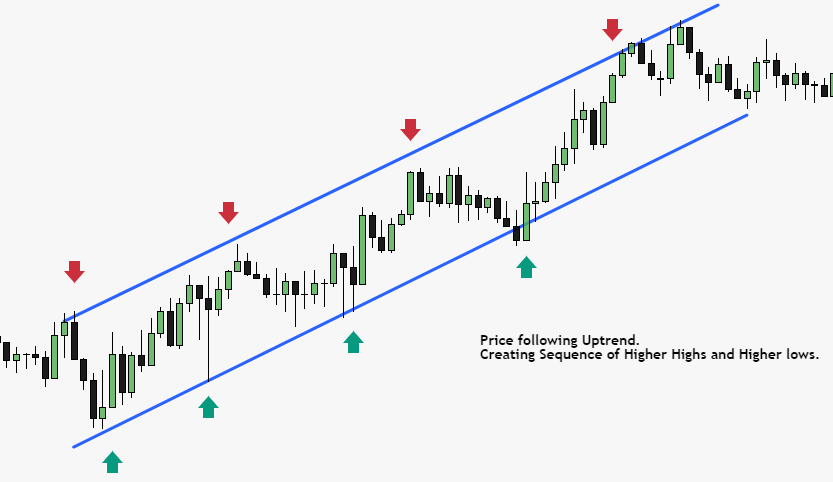
Trendlines
Trendlines are lines drawn on a price chart to connect a series of rising lows or falling highs. They provide visual representations of the direction and strength of a trend. An uptrend is characterized by higher highs and higher lows, while a downtrend exhibits lower highs and lower lows.
Trendlines can also act as dynamic support or resistance levels. When prices break above a downtrend line or below an uptrend line, it may indicate a potential trend reversal or continuation.
Technical Indicators
Technical indicators are mathematical calculations applied to price and volume data to provide additional insights into market trends and potential reversals. Examples of popular technical indicators include moving averages, relative strength index (RSI), and MACD (Moving Average Convergence Divergence).
Technical indicators are used to confirm price patterns, generate trading signals, and identify potential entry or exit points. By combining different indicators, traders aim to increase the accuracy of their analysis and improve their trading strategies.
Types of Technical Analysis
The technical analysis encompasses various types of analysis that traders use to gain insights into market behavior. Let’s take a look at four common types:
Trend Analysis
Trend analysis focuses on identifying the direction of a security’s price movement. It helps traders determine whether a stock is in an uptrend, downtrend, or trading within a range. By following trends, traders can align their positions with the prevailing market sentiment.
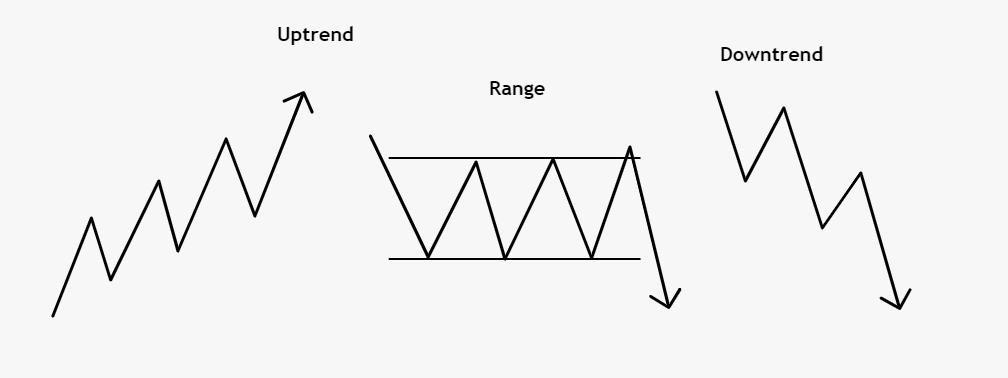
Traders utilize trend analysis to make informed trading decisions. By identifying the prevailing trend, they can align their trades with the momentum of the market. Trend analysis helps traders identify potential entry and exit points, as well as manage risk by adjusting their positions according to the changing trend.
Momentum Analysis
Momentum analysis is a technique used by traders and investors to assess the strength and speed of price movements in a security. It focuses on the rate of change in prices rather than the actual price levels. By examining the momentum of security, traders aim to identify potential trends, confirm price movements, and determine the likelihood of continued price momentum.
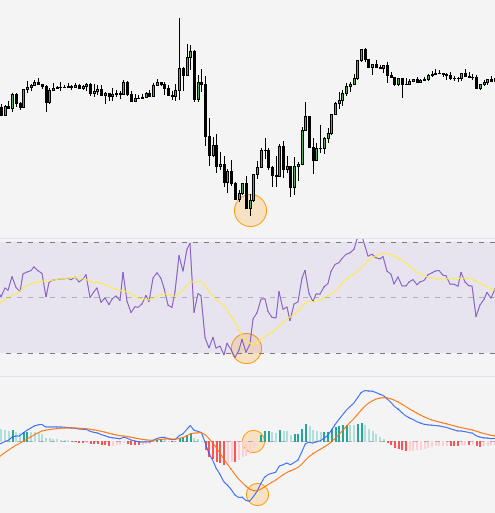
Momentum indicators, such as the Relative Strength Index (RSI) and Moving Average Convergence Divergence (MACD), are commonly used in momentum analysis. These indicators compare the current price to previous price levels and provide insights into overbought or oversold conditions.
Volatility Analysis
Volatility analysis is a method used by traders and investors to assess the degree of price fluctuations and market volatility in a security or market. It measures the rate at which the price of a security moves up and down over a specific period. Volatility analysis helps traders identify potential trading opportunities and manage risk effectively.
Volatility can be calculated using various statistical indicators, such as standard deviation or average true range (ATR). These indicators quantify the price variability and provide a measure of the security’s volatility.
High volatility indicates larger price swings and can present profit opportunities, especially for short-term traders. Conversely, low volatility suggests a more stable and predictable market environment, which may favor long-term investors seeking steady returns.
Volume Analysis
Volume analysis is a method used by traders to analyze the trading volume of a security. It focuses on the study of the number of shares or contracts traded during a given period. Volume is an essential component in technical analysis as it provides insights into the level of market participation and the strength of price movements.
High volume during price rallies or declines indicates strong investor interest and conviction in the direction of the market. It suggests that a significant number of market participants are actively buying or selling the security, which can potentially validate the price trend. On the other hand, the low volume may suggest a lack of market interest or indecision among traders.
Volume analysis is often used in conjunction with price analysis to confirm or contradict price movements. For example, if security is experiencing a significant price increase accompanied by high volume, it suggests a strong bullish sentiment. Conversely, if the price declines with high volume, it may indicate bearish pressure.
Applying Technical Analysis in Trading
Now that we have covered the basics, let’s explore how technical analysis can be applied effectively in trading:
Identify Trends
The first step in utilizing technical analysis is to identify the prevailing trend. By analyzing price charts and trendlines, traders can determine whether a security is in an uptrend, downtrend, or range-bound. This information is crucial for making informed trading decisions.
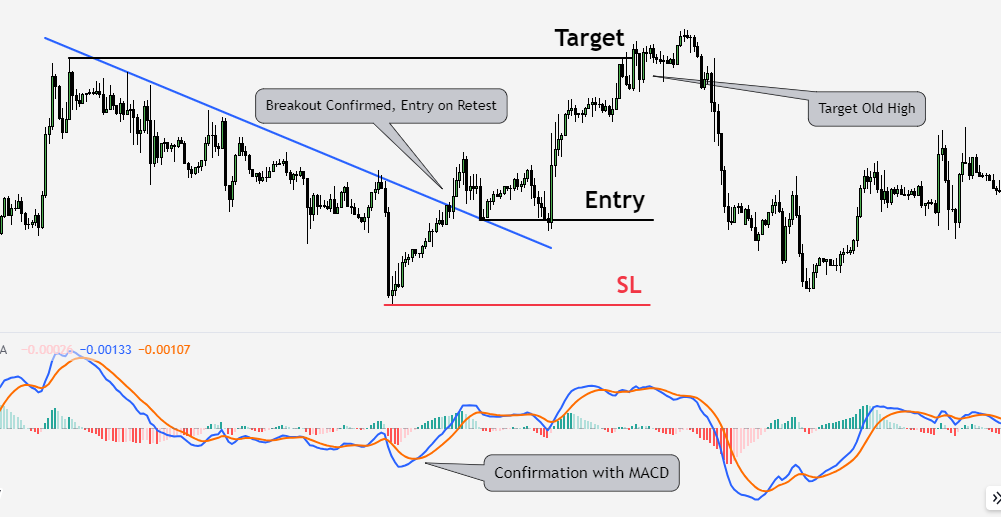
Confirm with Indicators
Technical indicators can confirm a trend or signal potential reversals. For example, a trader may use a moving average crossover as a signal to enter or exit a position. Combining multiple indicators can offer a more comprehensive analysis and increase the probability of successful trades.
Determine Entry and Exit Points
Technical analysis helps traders pinpoint entry and exit points for their trades. Support and resistance levels can be used to identify optimal buy or sell points. Additionally, indicators like the RSI can signal overbought or oversold conditions, indicating when to enter or exit a trade.
Technical Analysis vs. Fundamental Analysis
When it comes to analyzing securities, two primary methods are widely used: technical analysis and fundamental analysis. Let’s explore the key differences between these approaches:
Technical Analysis
- Relies on historical price and volume data.
- Focuses on market trends, patterns, and indicators.
- Emphasizes charts and mathematical calculations.
- Seeks to predict future price movements.
- Does not consider the intrinsic value of a security.
Fundamental Analysis
- Analyzes a company’s financial health, management, and industry factors.
- Considers earnings, revenue, assets, and liabilities.
- Evaluates the intrinsic value of security.
- Determines if security is overvalued or undervalued.
- Useful for long-term investment decisions.
Technical analysis focuses on studying price patterns, chart formations, and market indicators to predict future price movements. It assumes that historical price and volume data can provide insights into market behavior and sentiment. Technical analysts believe that all relevant information is already reflected in the price, making fundamental factors less significant.
On the other hand, the fundamental analysis examines a company’s financial statements, industry trends, and economic factors to assess its intrinsic value. Fundamental analysts believe that the market may misprice securities, presenting opportunities to profit from undervalued or overvalued stocks. They focus on identifying companies with strong financials, competitive advantages, and growth potential.
While technical analysis is commonly used by short-term traders and technical traders, fundamental analysis is often employed by long-term investors seeking to build a portfolio based on the underlying value of a security.
In practice, many investors use a combination of both approaches to gain a comprehensive understanding of the market and make well-informed investment decisions. By leveraging the strengths of technical and fundamental analysis, investors can enhance their ability to navigate the complex world of financial markets.
Key Assumptions of Technical Analysis
Technical analysis is based on several key assumptions that form the foundation of its principles and methodologies. These assumptions guide the analysis of price charts and the use of technical indicators. Let’s explore the key assumptions of technical analysis:
-
Market Prices Reflect All Available Information
Technical analysis assumes that market prices already reflect all relevant information, including fundamental factors, economic data, and market psychology. This means that past price movements, patterns, and trends can provide insights into future price movements.
- Price Movements Are Not Random
Technical analysis assumes that price movements follow trends and patterns that are not purely random. It suggests that market participants’ behavior and psychology contribute to the formation of repeatable price patterns, which can be identified and analyzed to make predictions.
- History Tends to Repeat Itself
Technical analysis assumes that historical price patterns and trends tend to repeat themselves. It suggests that human behavior in the markets, influenced by fear, greed, and other emotions, leads to the formation of similar price patterns under similar circumstances. Traders use these historical patterns to anticipate future price movements.
- Price Trends Are More Likely to Continue than Reverse
Technical analysis assumes that once a price trend is established, it is more likely to continue than to reverse abruptly. This assumption is based on the belief that market participants tend to follow established trends until there is evidence of a trend reversal.
- Technical Indicators Provide Valuable Insights
Technical analysis assumes that technical indicators, such as moving averages, oscillators, and volume indicators, provide valuable insights into market trends and potential reversals. These indicators are believed to reveal patterns and signals that can help traders make informed decisions.
While these assumptions serve as guiding principles for technical analysis, it is important to note that they are not universally accepted. Critics argue that market inefficiencies and unpredictable events can challenge the assumptions of technical analysis. Nevertheless, many traders and investors continue to use technical analysis as a tool to analyze price data and make trading decisions based on these assumptions.
Limitations of Technical Analysis
While technical analysis can be a valuable tool, it’s essential to acknowledge its limitations:
- Subjectivity: Technical analysis relies on interpretation and can be subjective. Different traders may interpret the same chart pattern or indicator differently, leading to varied trading decisions.
- Market Sentiment: Technical analysis focuses on historical price and volume data, but it may not capture significant market events or changes in investor sentiment that can impact prices.
- False Signals: Technical indicators are not foolproof and can generate false signals, leading to potential losses if traders rely solely on them without considering other factors.
Despite these limitations, many traders find technical analysis to be a valuable tool in their trading strategies.
Conclusion
Technical analysis is a popular approach used by traders to evaluate securities and make informed trading decisions. By analyzing price charts, patterns, and indicators, traders can identify trends, confirm market signals, and determine optimal entry and exit points.
While technical analysis has its limitations, it remains a widely used and effective method in the world of trading.
FAQs
1. Can technical analysis guarantee successful trades?
No, technical analysis cannot guarantee successful trades. It provides insights into potential market trends and signals, but other factors, such as fundamental analysis and market sentiment, should also be considered.
2. How can I learn more about technical analysis?
There are numerous resources available, including books, online courses, and tutorials, that can help you learn more about technical analysis. Additionally, practice and hands-on experience are crucial for developing proficiency in this field.
3. Is technical analysis suitable for all types of securities?
Yes, technical analysis can be applied to various securities, including stocks, commodities, currencies, and cryptocurrencies. However, it’s important to adapt the analysis to the specific characteristics of each market.
4. Are there any risks involved in relying solely on technical analysis?
Relying solely on technical analysis without considering other factors, such as fundamental analysis and market news, can pose risks. It’s important to have a well-rounded approach and consider multiple factors when making trading decisions.
5. Can I use technical analysis for long-term investments?
Yes, technical analysis can be used for long-term investments. It helps identify long-term trends, determine entry and exit points, and manage risks in a long-term investment strategy.